What Observability-Driven Development Is Not
At Honeycomb, we are all about observability. In the past, we have proposed observability-driven development as a way to maximize your observability and supercharge your development process. But I have a problem with the terminology, and it is: I don’t want observability to drive your development.


At Honeycomb, we are all about observability. In the past, we have proposed observability-driven development as a way to maximize your observability and supercharge your development process. But I have a problem with the terminology, and it is: I don’t want observability to drive your development.
What is observability-driven development?
Observability-driven development implies that you think about observability before you write a line of code. What change do you want to make? …No, not to the customer interface. Not to the data. What change do you want to make to your traces?
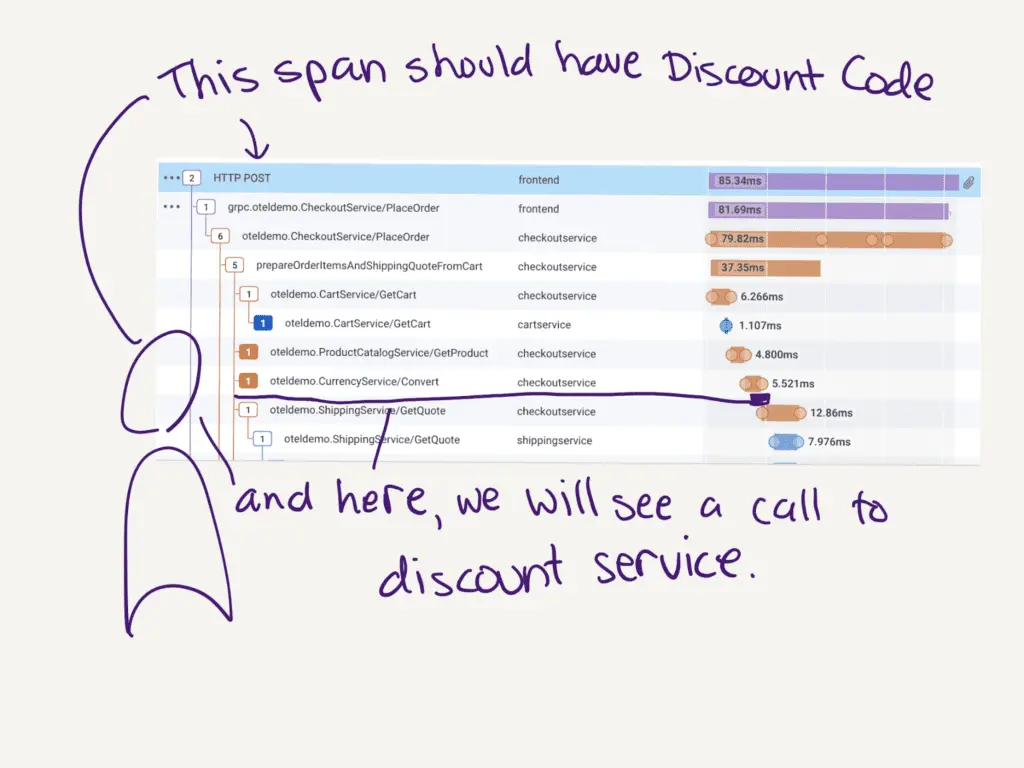
Now make your spans look like that. This will result in implementing some functionality. You’ll know that functionality works when your spans look sweet and express the new feature perfectly.
When your feature is live in production, you can tell who uses it, how long it takes, and what kind of value you’ve just provided. Because you have optimized for observability!
Developing this way is a good idea for many features. But should we base our development flow around it? Should it drive our work?
Watch Jessica’s Intro to O11y Series
Where did the term come from?
Phrases like “x-driven development” started with Rebeccah Wirf-Brock’s Responsibility-Driven Design back in 1989. There’s Behavior-Driven Development, Domain-Driven Design, and plenty of others. The biggest is Test-Driven Development (TDD), thanks to Kent Beck and his Xtreme Programming crew. TDD says you write tests before writing any code, because this pushes you to design the code in ways that are testable, with APIs that are usable. TDD is a great design practice.
But which should drive our development? Tests, or behavior, or responsibility, or observability?
There are always tradeoffs
Observability is important, and so are many other focuses of attention.
In testing, more isn’t always better. Every assertion in an automated test adds brittleness to the system. Refactors can change how classes interact, breaking a test, forcing a future team member to decipher what that test tried to hold constant—and whether it still matters.
In feature work, seeing the difference in traces is useful. But is it more important than the customer interface, or the database, or domain boundaries? Observability is useful when it supports the many facets of our work, not when it supplants them.
Infrastructure is necessary. Troubleshooting production is necessary. Smooth deployments are necessary. But if I have perfect infrastructure, brilliant observability, and space-age continuous deployment, that won’t get me customers. These aren’t of value to customers; they can only support adding value for customers.
I want smooth deployments in order to have exciting releases. I want to troubleshoot bigger and better functionality all the time. And, I want infrastructure that scales because my customers demand more.
My goal as a software developer is to provide valued capabilities to customers, by operating useful software. Observability is necessary and helpful, but it is not the point. That’s why I don’t like the word “driven” in observability-driven development. Observability should help your development practice, not distract from it.
Doing development + observability right
Observability can help the development process! For instance:
- Do start a new feature by looking at existing traces and asking, “Where will this be different?” when it’s appropriate. This might lead you to add some instrumentation, if that’s not too difficult.
- Do think about what new spans, in what service, you expect to see. This can help you reach the architecture you intend. Architecture is built out in everyday coding, and your traces can help you keep that in mind.
- Do add attributes to spans, and new spans as appropriate, and look at traces while you’re developing locally. This may be slower than printf debugging, but you don’t throw it away afterward. This information stays with you through to production. When you add attributes on existing spans, and you’re a Honeycomb customer, it costs you nothing to keep that newly relevant context, making your traces ever more valuable.
- Do look at these traces in production when your feature is released. You know just what to look for. When something surprising happens, you’ll have all the context that you used in local debugging to apply to production.
If you do this, you’re using observability during development. And you can tell people you’re using ODD, observability-driven development.
ODD is another way that we keep our code operable, reliable, and readable. Observability is our tool, not the other way around.
The crucial question behind TDD, and Behavior-Driven Development, and observability during development is the same. For each feature, start with: “How will I know it works?”
Tests can answer this question at small scales in controlled environments. Only observability can answer it in production, in every scenario encountered by real customers. Looking at traces during development, and iterating on those traces until they tell us what’s happening, answers “How will I know it works?” both in development and in production.
Please do observability during development. You don’t have to pretend it’s the point.
Want to know more?
Talk to our team to arrange a custom demo or for help finding the right plan.