Observability for New Teams: Part 1
Any significant shift in an organization’s software engineering culture has the potential to feel tectonic, and observability (o11y for short)—or more specifically, Observability Driven Development—is no different. Leaning into observability, which calls for tool-enhanced…

By: Josh Levin

Any significant shift in an organization’s software engineering culture has the potential to feel tectonic, and observability (o11y for short)—or more specifically, Observability Driven Development—is no different. Leaning into observability, which calls for tool-enhanced investigation, hypothesis testing, and data richness can be cumbersome even for the most veteran of teams. The fear factor only increases for new teams that are unfamiliar with observability and don’t have an established best practice for troubleshooting systems issues, software development lifecycle (SDLC) improvements, and collaboration.
This post is the first in a two-part series that is intended to help ease the transition from traditional monitoring and logging to the world of observability. In this post, I’ll show:
- Why instrumentation is key to observability
- Why wide events and high cardinality enable you to slice and dice billions of rows of data any way you want to find the answers you need
- How you can take control of your investigations using the scientific method in Honeycomb
- How to gain the same level of visibility of your CI/CD pipeline using buildevents and markers
Instrumentation
“You can have data without information, but you cannot have information without data” – Daniel Keys Moran
The value driven from a tool is directly contingent upon the data that underlies it. This is an unmistakable truth that echoes even louder during high-pressure incident response, where one does not have time to add contextual information from a historical event. This is why we highly encourage all teams to instrument their code to emit telemetry data.
The truly prepared, however, will have the data readily available, leaning not just on the auto-instrumentation provided by most telemetry SDKs, but going the extra mile to manually add information specific to the business, internal processes, and architectural patterns.
Within the realm of instrumentation best practices, OpenTelemetry (or OTel, for short) has become a phenomenal tool for software engineers to standardize their telemetry across their services and production ecosystem, providing a consistent and vendor-agnostic view of the health of their systems.
OTel provides a set of APIs, SDKs, and additional tools to add telemetry data across a huge swath of programming languages and frameworks (a large portion of which also provide the auto-instrumentation mentioned above!). Not only does Honeycomb accept this data in OTel format, but we also provide distributions for certain languages to make it easier for those new to OTel and plan to release more distributions in the near future.
Finally, the flexibility of Honeycomb’s column datastore encourages the use of instrumentation that generates wide events (events with a lot of contextual information) and attributes high in cardinality—that is, those that can have a very high number of distinct values (like “user_id”). Providing yourself with the most “bang-for-your-buck” telemetry will enable the tool to perform well in complex situations, and ultimately decrease your mean-time-to-detect (MTTD) and mean-time-to-resolve (MTTR).
“That’s all well and good, but we came here for specifics, not just soap-box preaching!” is something you may be thinking. Luckily, such specifics can be broken into three major categories:
- Business context: user information, team/organization names, customer type, etc.
- Technical context: cloud instance specifics, region/availability zone, etc.
- Propagation Headers: any kind of information that downstream services could use for context (NOTE: be sure to disable propagation headers for services that send an API response back)
Your systems will naturally grow in complexity and scale, and so should your observability tool’s ability to track it. Part of the iterative nature of o11y is the need for a consistent review of new information to add to the instrumentation. The more formalized a process you and your team can introduce to this (through internal documentation, runbook requirements, etc.), the less likely an issue will crop up based on untracked instrumentation.
Investigation best practices
At Honeycomb, we work to build functionalities to enable you to be the best systems “detective” you can be. From making it flexible to query across, and group by, high-cardinality fields, to multiple views of the same slice of data (such as the trace waterfall view or metrics overlay), Honeycomb can be the all-in-one toolbox for research and analysis. With that said, there are ways of optimizing this process even within Honeycomb.
The first is centered around being able to ask any question of your system and get answers you didn’t even know you were looking for. Most everyone is familiar with the scientific method at a high level, but many also neglect to implement it in real-world investigations. The simplicity of it translates well to Honeycomb as your first tool in finding the “unknown unknowns“ of your production environment. In other words, you want to be able to:
- Question the performance of your system
- Develop a hypothesis around why performance is being impacted
- Gather data around your hypothesis
- Analyze your data to answer the original question
If you want to see this in action, take a look at some investigations around a leaky Redis cluster and some uncooperative API hosts!
The second involves giving yourself the room and flexibility to test. Most of our customers have a dataset (or group of datasets) for data emitted from their lower environments (dev, stage, etc.), but some fall into the trap of leveraging it like their old logging systems; i.e., just a place to off-load data with the sole purpose of having a fallback if things break. But there’s so much potential for using those systems as a testing bed for strategic improvements to your upstream systems, a place to truly dev(elop) and stage incremental improvements to production.
The natural question here is, “What’s the intrinsic benefit of implementing these best practices?” With regard to the first point, breaking down a problem into a series of investigatory steps will make holes in your observability landscape (e.g., missing telemetry) more obvious, allowing for a more organized and thoughtful pipeline for improvements to be made for all users’ benefit.
For example, if I see a spike in response latency from my API and believe it’s related to a malicious user impacting performance of others (steps 1 and 2), but then realize some portion of my API real estate has little to no telemetry (step 3), my ability to answer my question (step 4) is directly impacted—but at the same time, knowing where that investigatory bottleneck is makes it easier to identify where improvements can be made.
For the second point, the ability to safely control the “blast radius” of incremental changes, both small and large, to your systems gives you the flexibility to truly test its ability to handle requests outside the norm. In order to understand how those incremental changes impact system health and reliability, you need telemetry data similar in robustness to production to fully appreciate what happens downstream and feel more confident deploying changes to production.
A lens on CI/CD pipelines
Reliability and availability don’t have to be the sole metrics you use to measure system robustness. Why not move your investigatory lens towards the processes before production—aka your CI/CD pipeline? Honeycomb enables you to do this via two major features: buildevents and our Markers API.
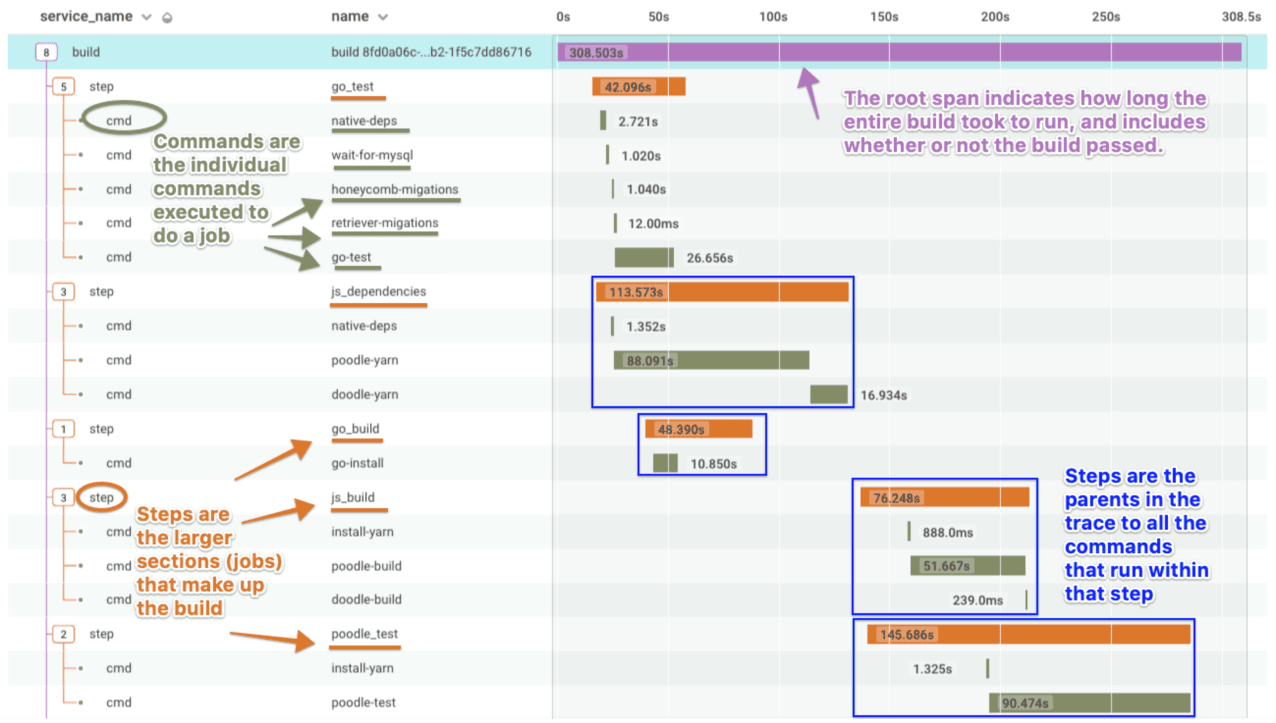
Using buildevents, you can observe the performance of your CI builds, visualizing what steps or tests tend to be bottlenecks, and leverage the Honeycomb waterfall trace view to improve the code deployed to your production environments.
In conjunction with the detail provided by buildevents, markers allow you to superimpose flags onto your telemetry data via a flexible API endpoint. Using markers, you can see the downstream impacts of deployments, infrastructure allocation, and even incident tracking. At
Honeycomb, we use markers internally to link our builds to production data:
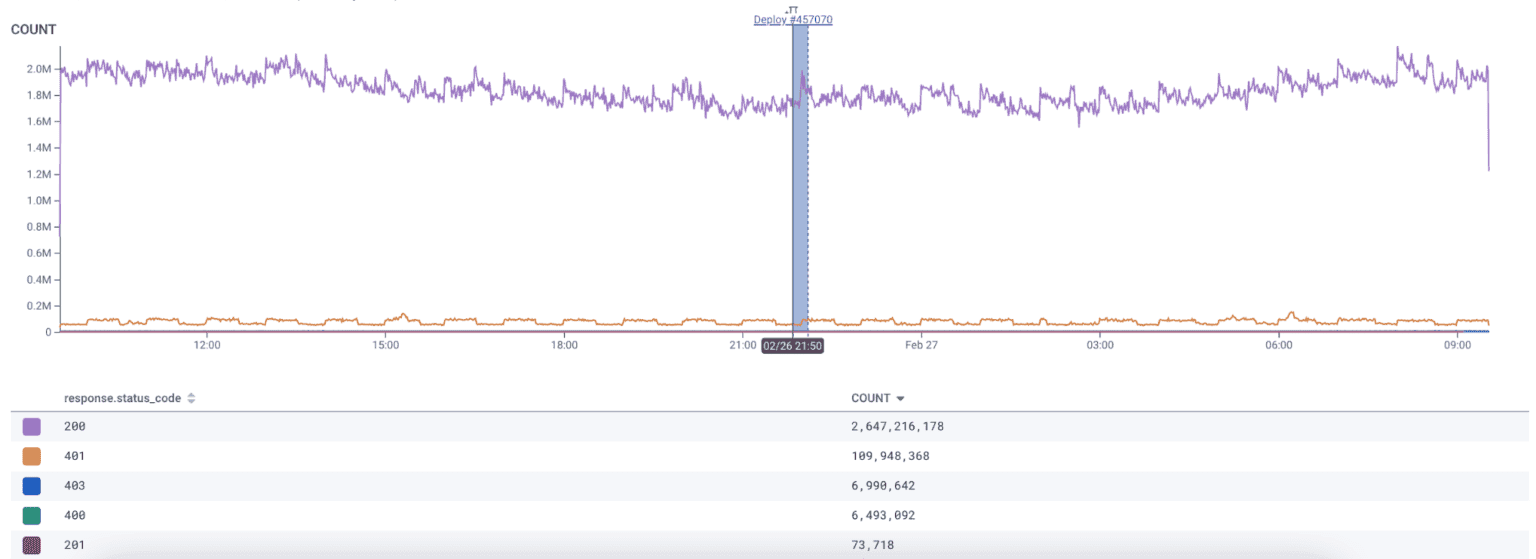
Using the marker type above, which is hyperlinked to the deploy in our build system, we can respond quickly to any negative impacts of bad builds with full fidelity.
Conclusion
As you can see, the flexible and dynamic nature of Honeycomb—and observability as a whole—can greatly impact your team’s ability to maintain the health of your distributed systems. Keys to maintaining this ongoing health are robust instrumentation (so your data contains all the nuance of the systems it represents), a reliable set of investigation best practices (allowing you to make the most of said instrumentation), and expanding the lens of your observability to pre-production work via your CI/CD pipeline (so you can deploy quicker and with less heartburn).
Want to know more?
Talk to our team to arrange a custom demo or for help finding the right plan.