Quickly Turn ALB/ELB Status Codes into an Issue-Seeking Heatmap
More often than not, as developers, when we get a report that a large customer is hitting 500 errors, there’s a flurry of activity. What’s wrong? Is something deeply broken? So you start digging…

By: Brian Langbecker
More often than not, as developers, when we get a report that a large customer is hitting 500 errors, there’s a flurry of activity. What’s wrong? Is something deeply broken? So you start digging through AWS logs to see what you can find, but it’s hard to reproduce. Sometimes, there’s no clear answer, and you move on without any resolution. What if I told you it doesn’t have to be this way?
In this post, I’ll show you how using Honeycomb, we can quickly pinpoint the source of our status codes, so we know what’s happening and whether our team should drop everything to work on a fix.
This post will walk you through how to:
- Surface issues from ALB/ELB status codes
- Set up ALB logs reporting to Honeycomb in less than 30 minutes
- Explore logs in a new and faster way, using Honeycomb’s query engine
Here’s what you should have to follow along:
- ANY data with status codes
- The example below uses an AWS account, ALB/ELB, S3, and a Lambda to send log data to Honeycomb
- A Honeycomb API key (create a free account)
Easily get data into Honeycomb
To get data into Honeycomb, begin by reviewing the following step-by-step AWS ALB documentation. For this setup, we are going to use an Application Load Balancer (ALB).
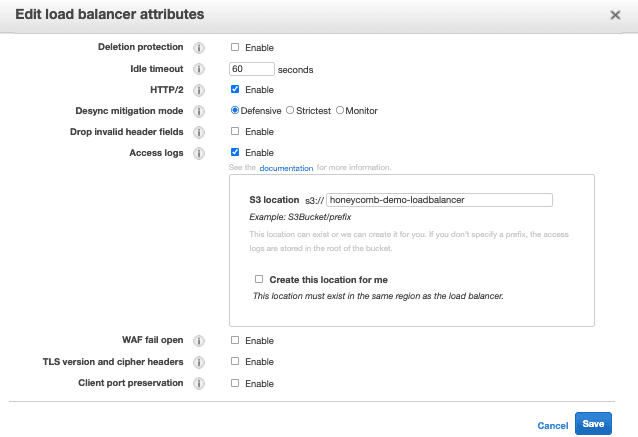
Before starting, ensure that your ALB sends logs to an S3 bucket:
We’ll begin by logging into our AWS account and launching the following Honeycomb ALB AWS Cloudformation template.
Reference the image below and provide the following required parameters:
- Stack Name
- S3 Bucket Name
- Our Honeycomb API Key (optionally encrypted)
- Honeycomb Dataset Name
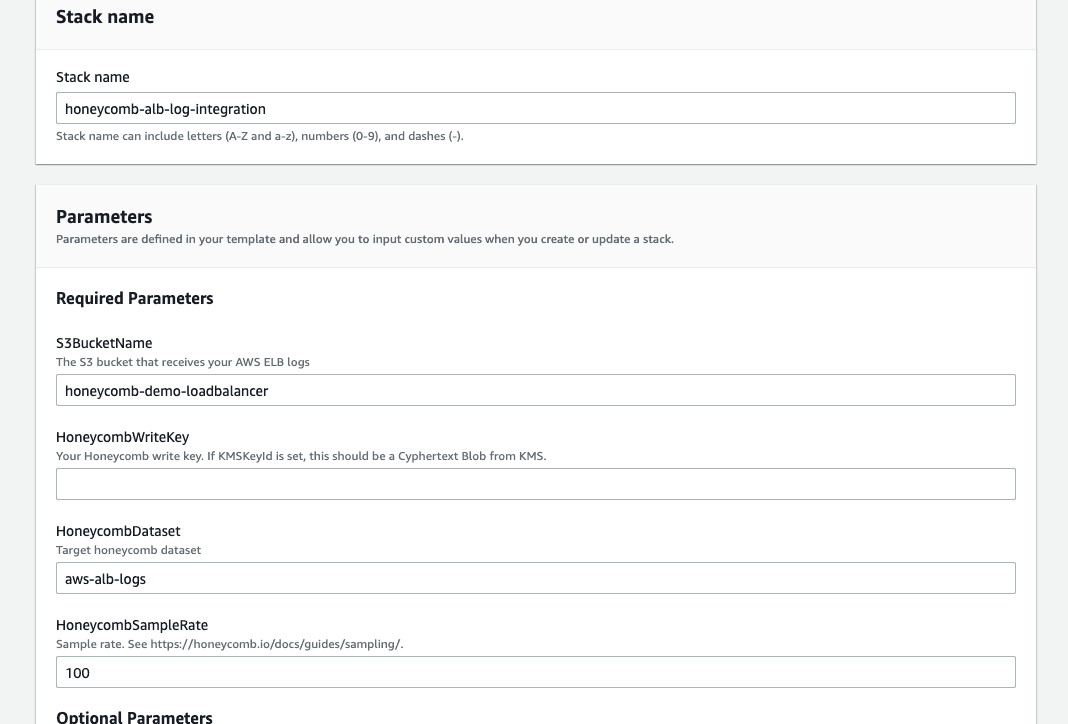
Click next and wait until the CloudFormation template creates the necessary resources.
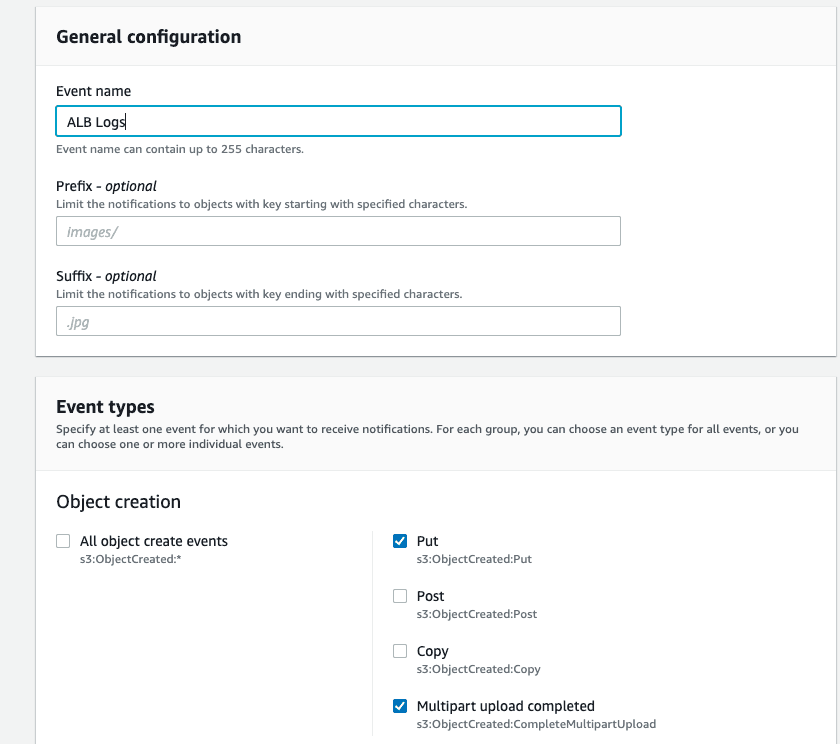
Once that is created, we need to make sure our S3 bucket is associated with our Lambda. To do this, we’ll go to the S3 bucket, select “properties,” and set our event name (I used “ALB Logs”). Lastly, select the options “put” and “multipart upload completed.”
Additionally, we’ll need to make sure our Lambda function is associated with our S3. Here it is below:
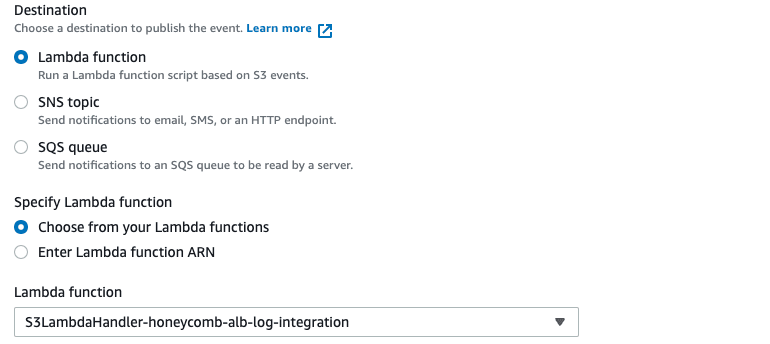
Ta-da! Now your data should start flowing in over the next 5 to 10 minutes!
Using data to find critical issues
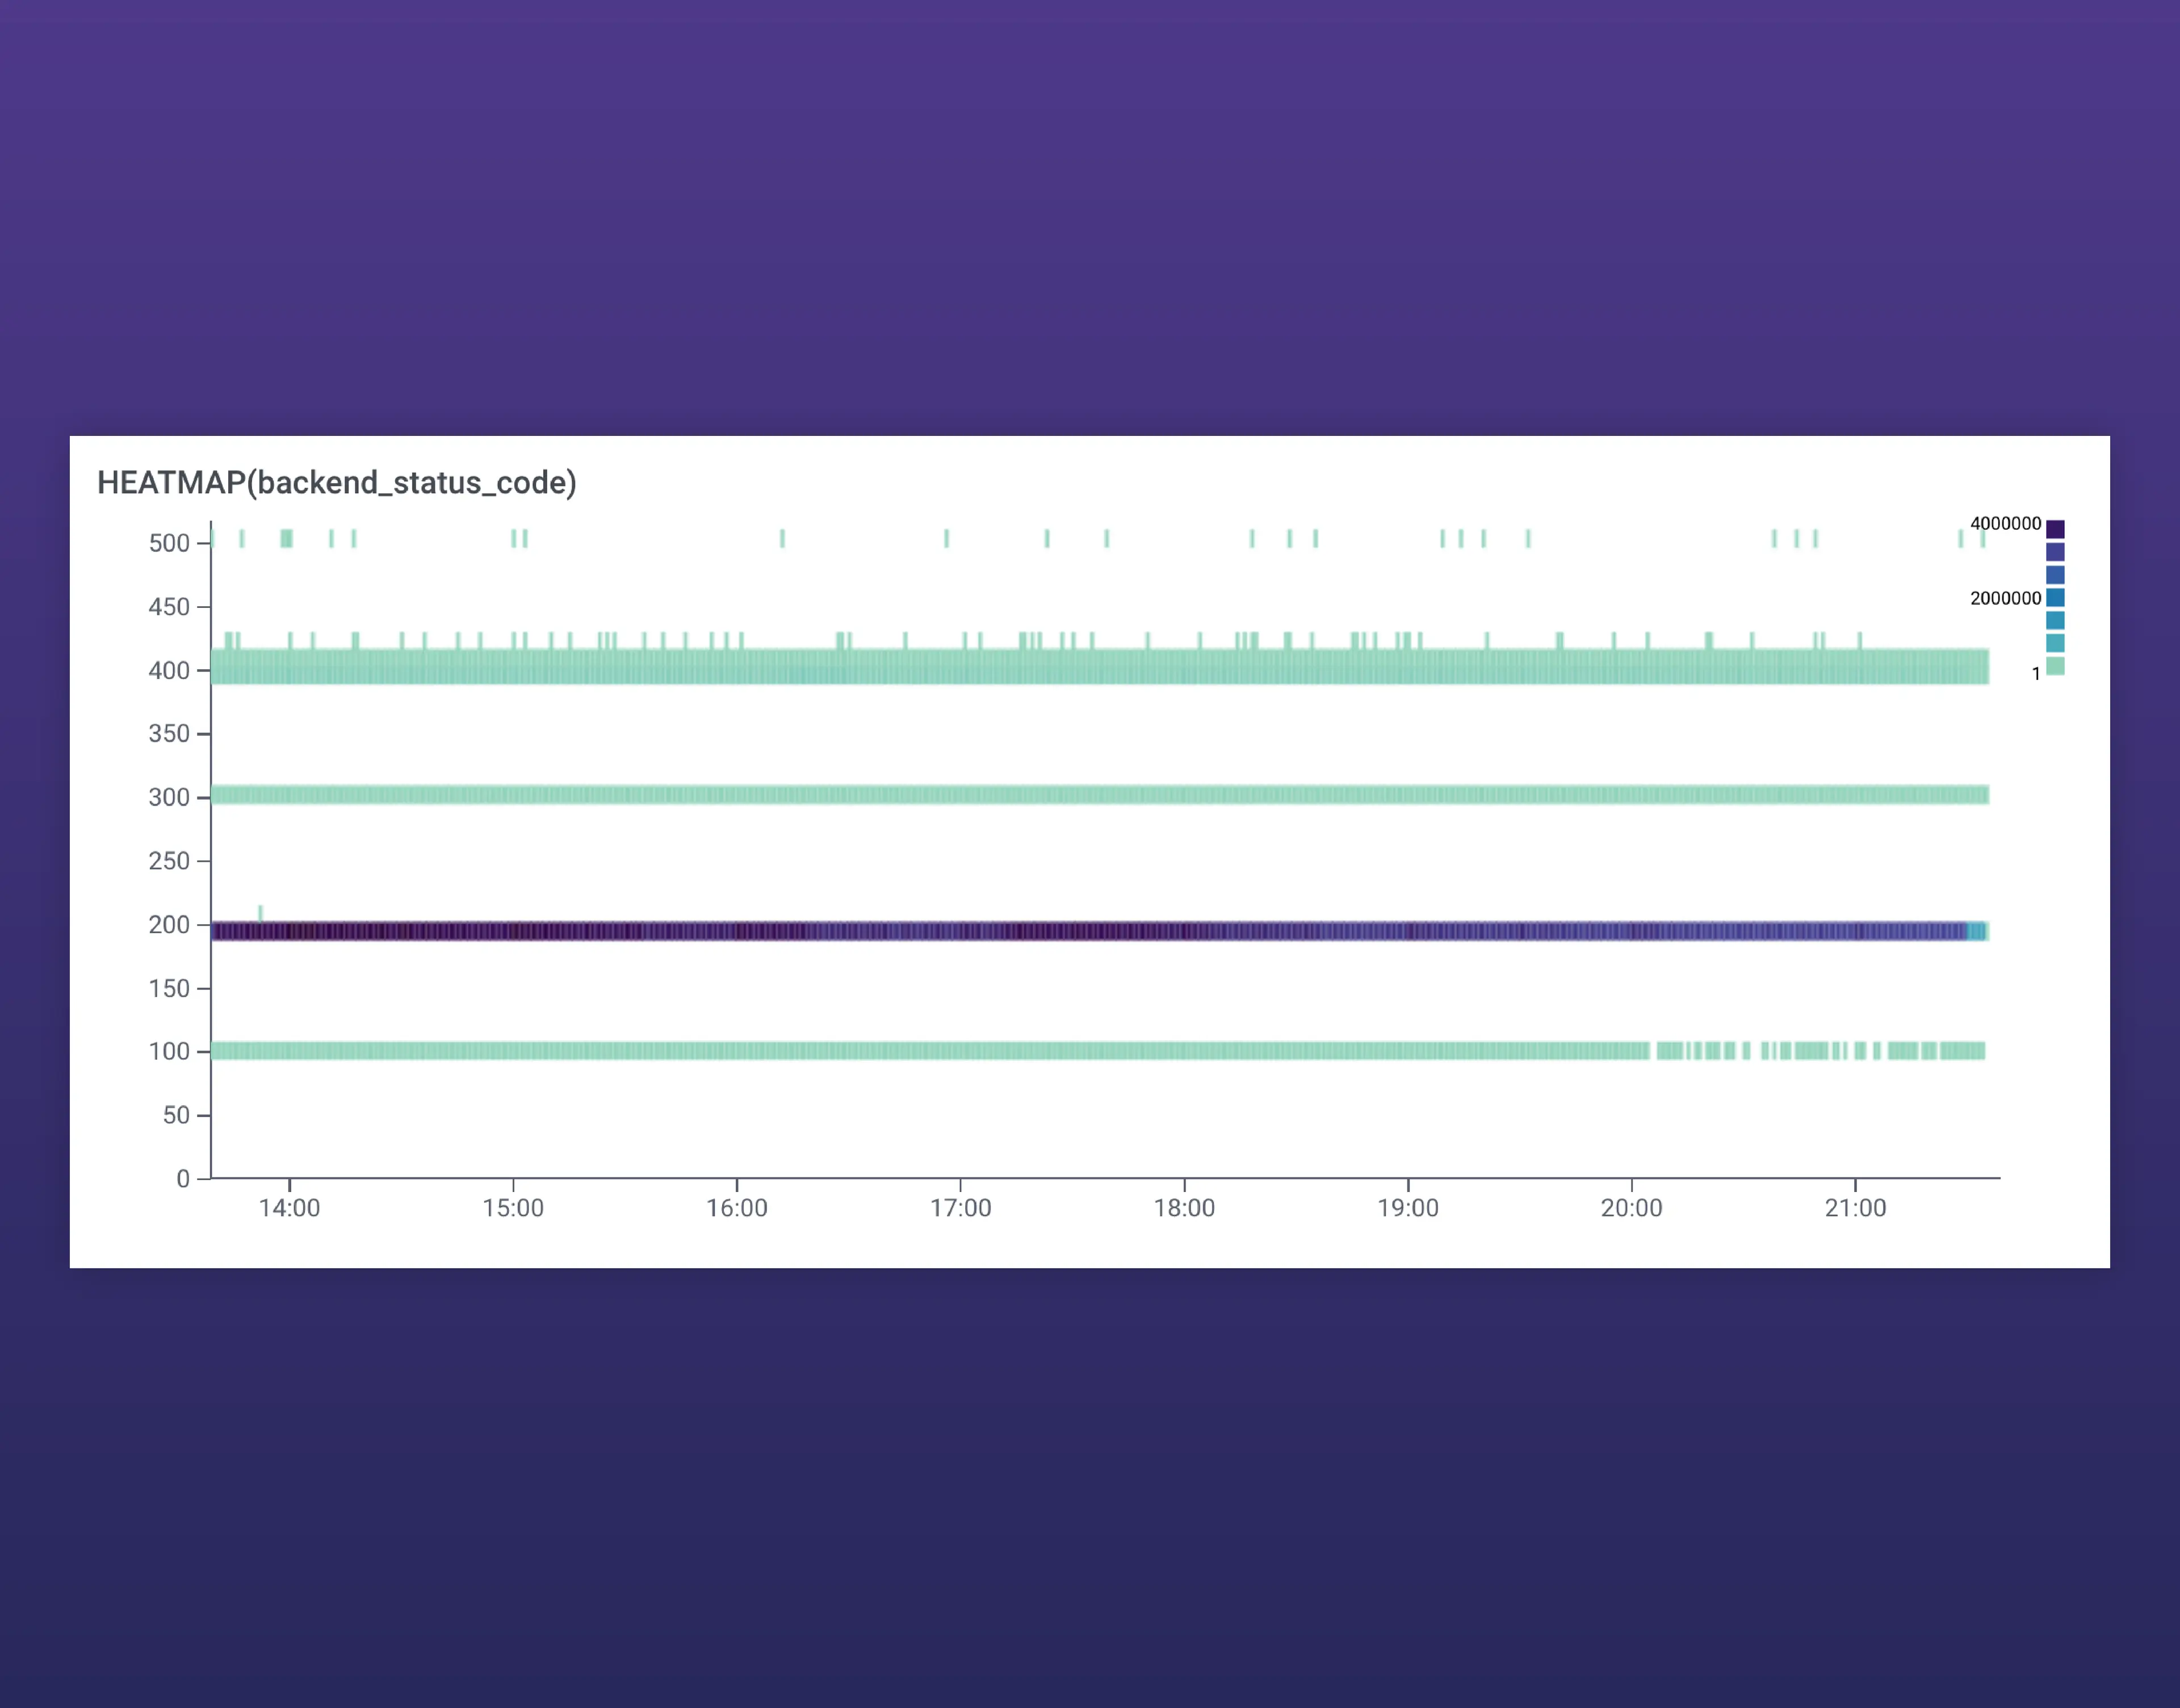
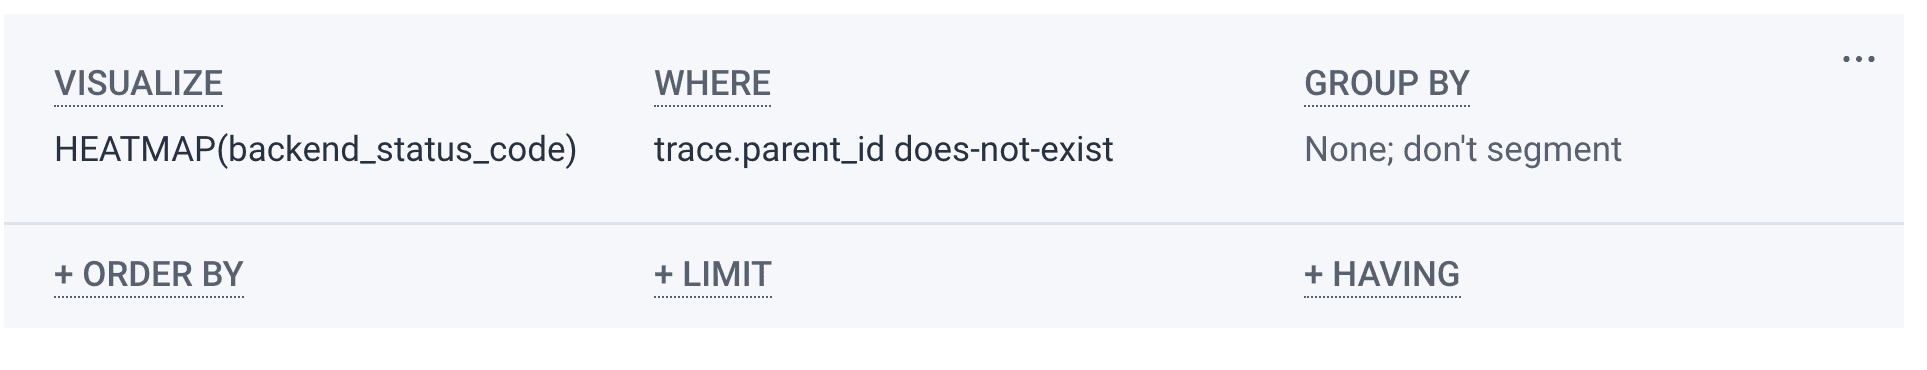
Now that we have our data in Honeycomb, let’s go back to our introductory scenario where a customer is encountering 500 errors on our site. How do we investigate? We can start by generating a Heatmap of all web requests based on the following query. By visualizing on the backend_status_code parameter, we can easily see which requests are resulting in an error, and setting the condition “WHERE trace.parent_id does-not-exist” narrows our results to root spans to prevent duplicate results.
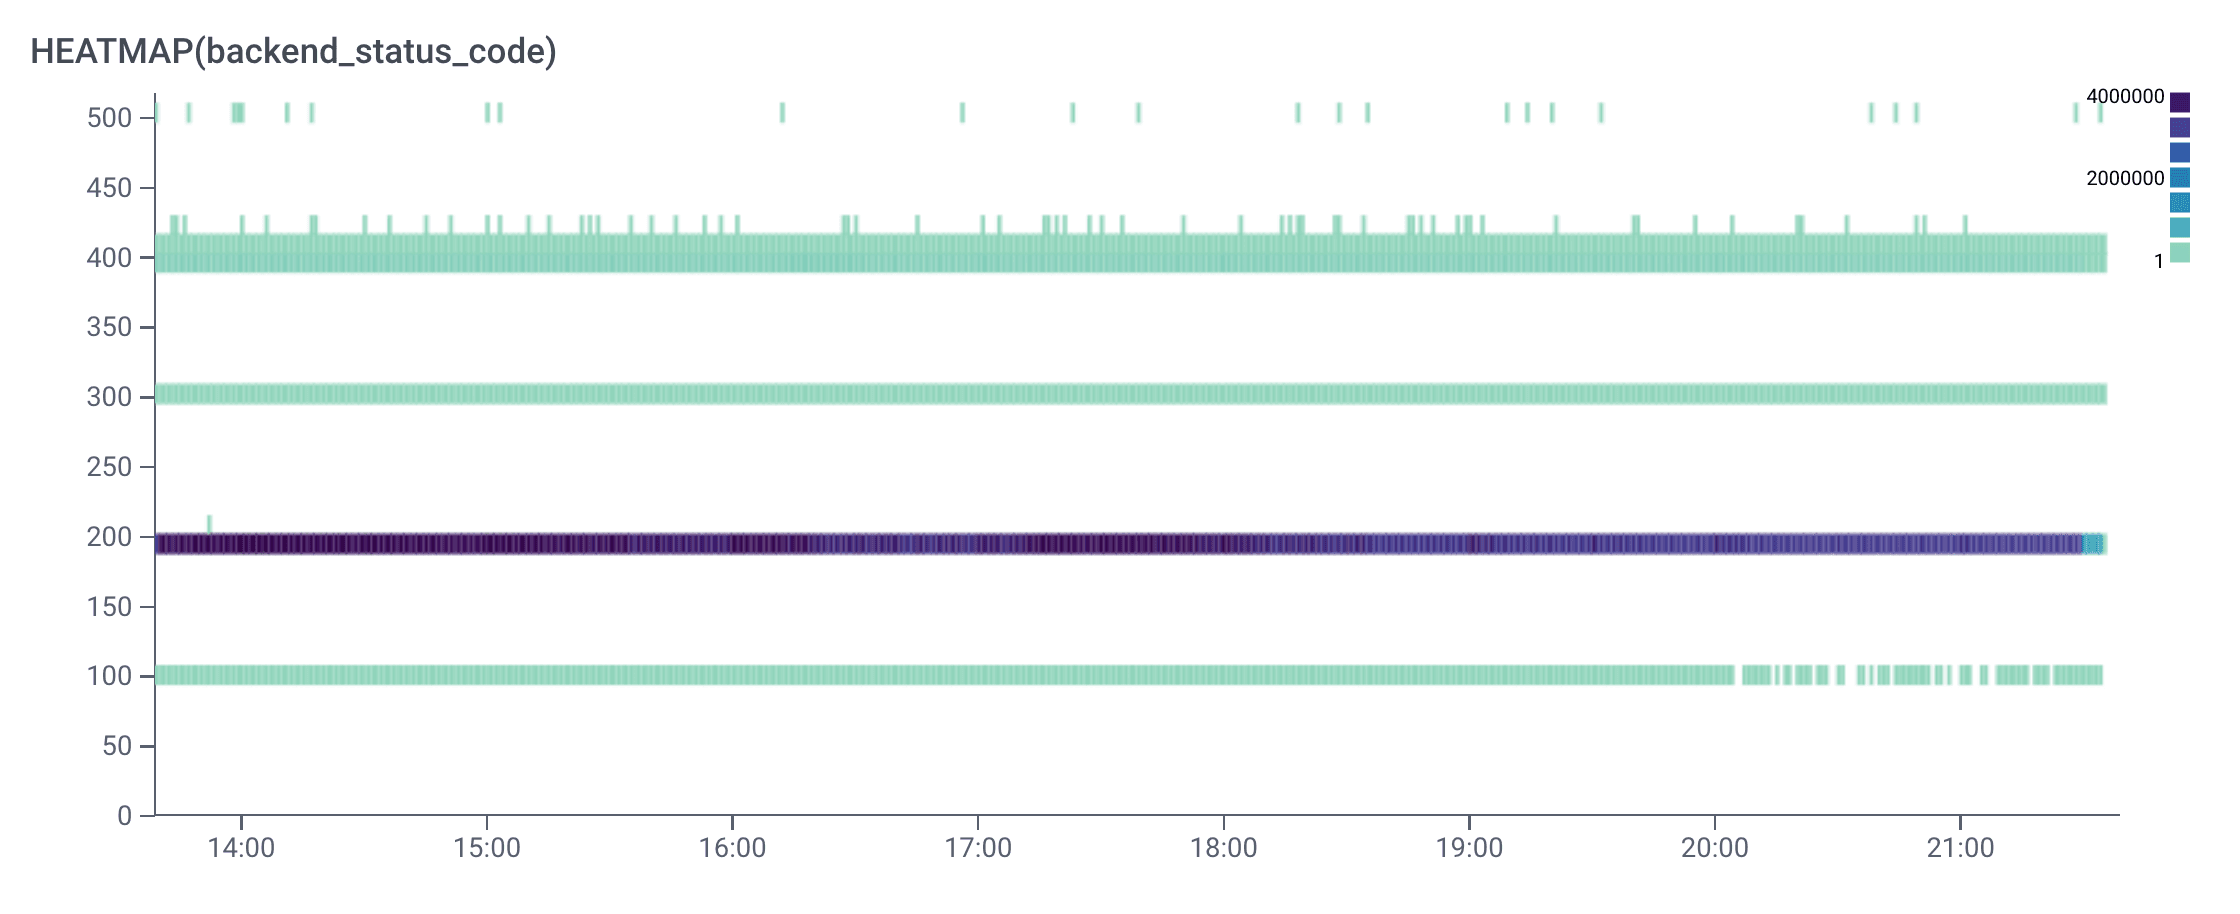
Note: Heatmaps are a visualization that show the statistical distribution of results over time.
When running this query, let’s say we get the following Heatmap broken up by status codes. The legend in the upper-right shows how many requests are returning the associated code at any given time and most of the activity (indicated by the darker purple color) is a 200 status code, which is good. As the status codes increase, the issues get worse:
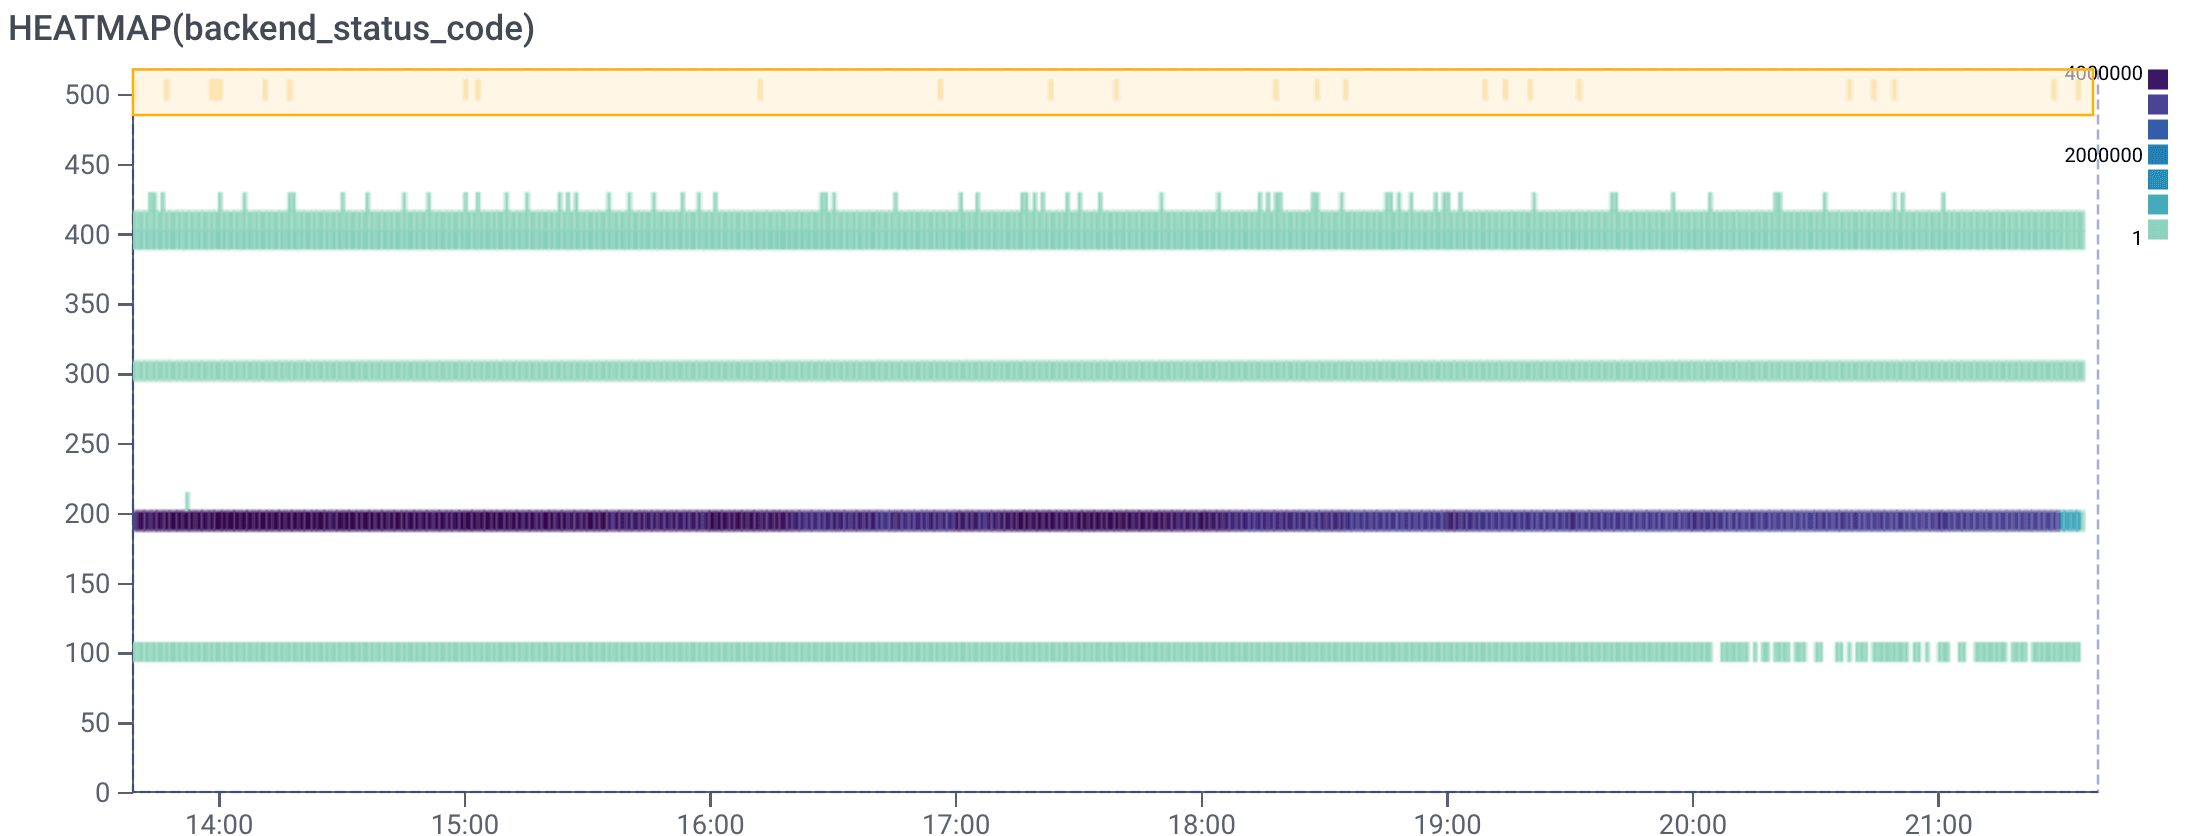
What we want to do next is select BubbleUp and highlight the area we’d like to compare against the rest of our data. Once we’re in the BubbleUp tab, we can drag a box across the 500s group of status codes at the top.
Note: BubbleUp is intended to help explain how some data points are different from the other points returned by a query. The goal is to try to explain how a subset of data differs from other data. This feature surfaces potential places to look for patterns and outliers within our data.
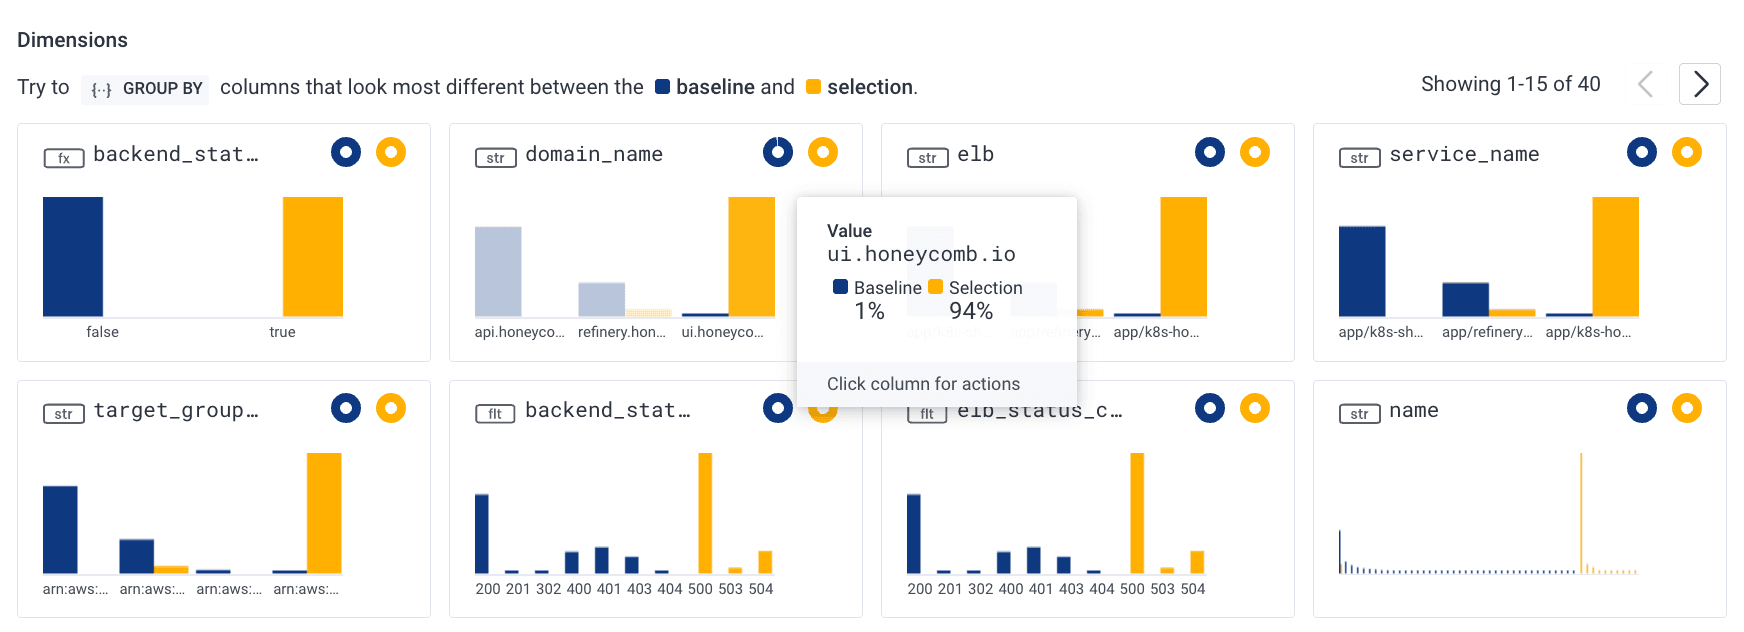
Next, we’ll examine the context/dimensions area below the graph where we’ll find that the majority are a 500 status code, which is an internal server error and affects the Honeycomb frontend domain. We have confirmed customers are in fact being affected and we can even see the actual client IPs in one of the boxes below (not shown to protect privacy).
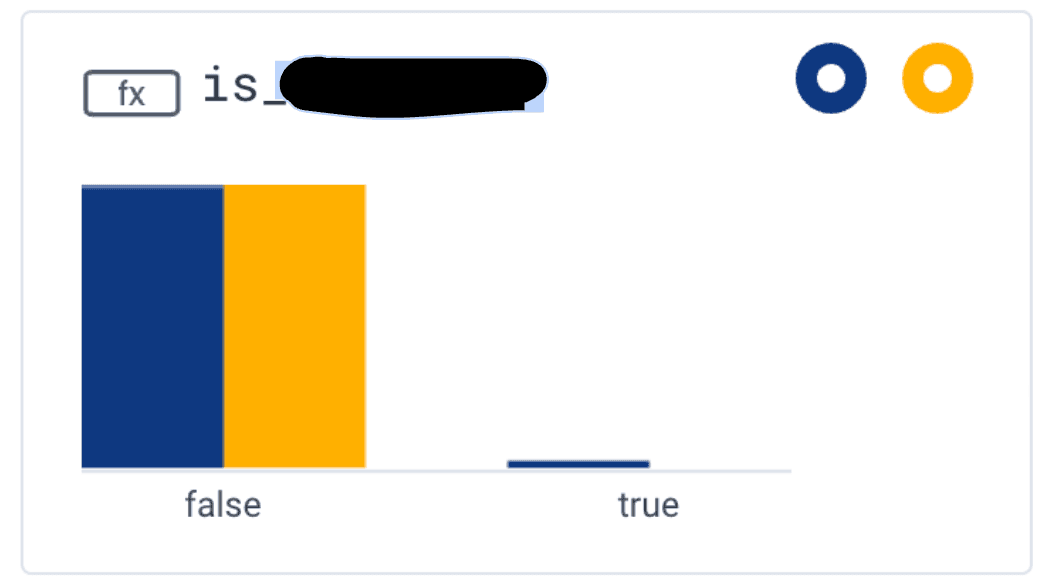
With this knowledge, we can determine if the customer who called us is indeed the one being impacted. In looking at client IPs, we determined that the customer who called was only affected a small percentage of the time. To help the next time the customer calls us, we will create a derived column for the IP range specific to this customer so that we will quickly see our largest customer in its own attribute—“is_customer_name.”
Note: Derived columns allow us to run queries based on the value of an expression that is derived from the columns in an event.
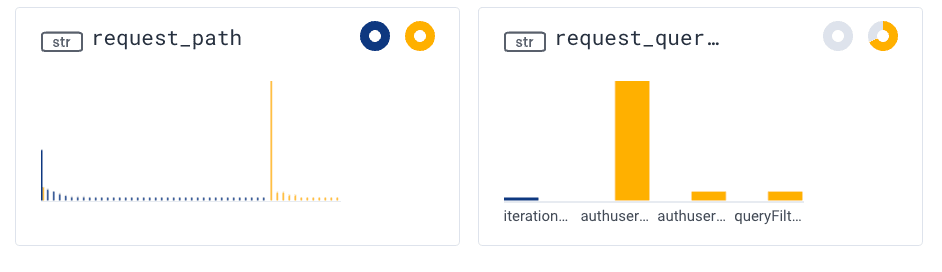
Another thing we can observe by looking at the dimensions in our BubbleUp data is that the vast majority of requests with errors have a query that begins with “authuser”, suggesting an authentication issue. But what if we want to explore even further? Can we isolate these requests from the remaining 500 errors? (Spoiler: we can)
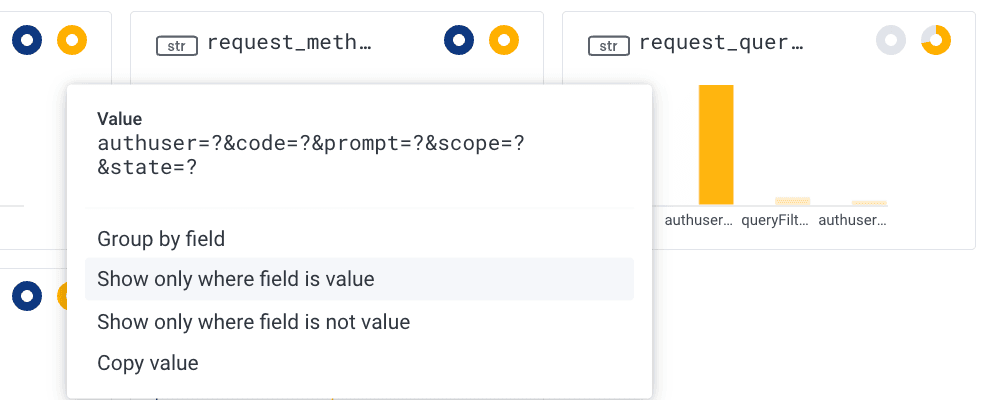
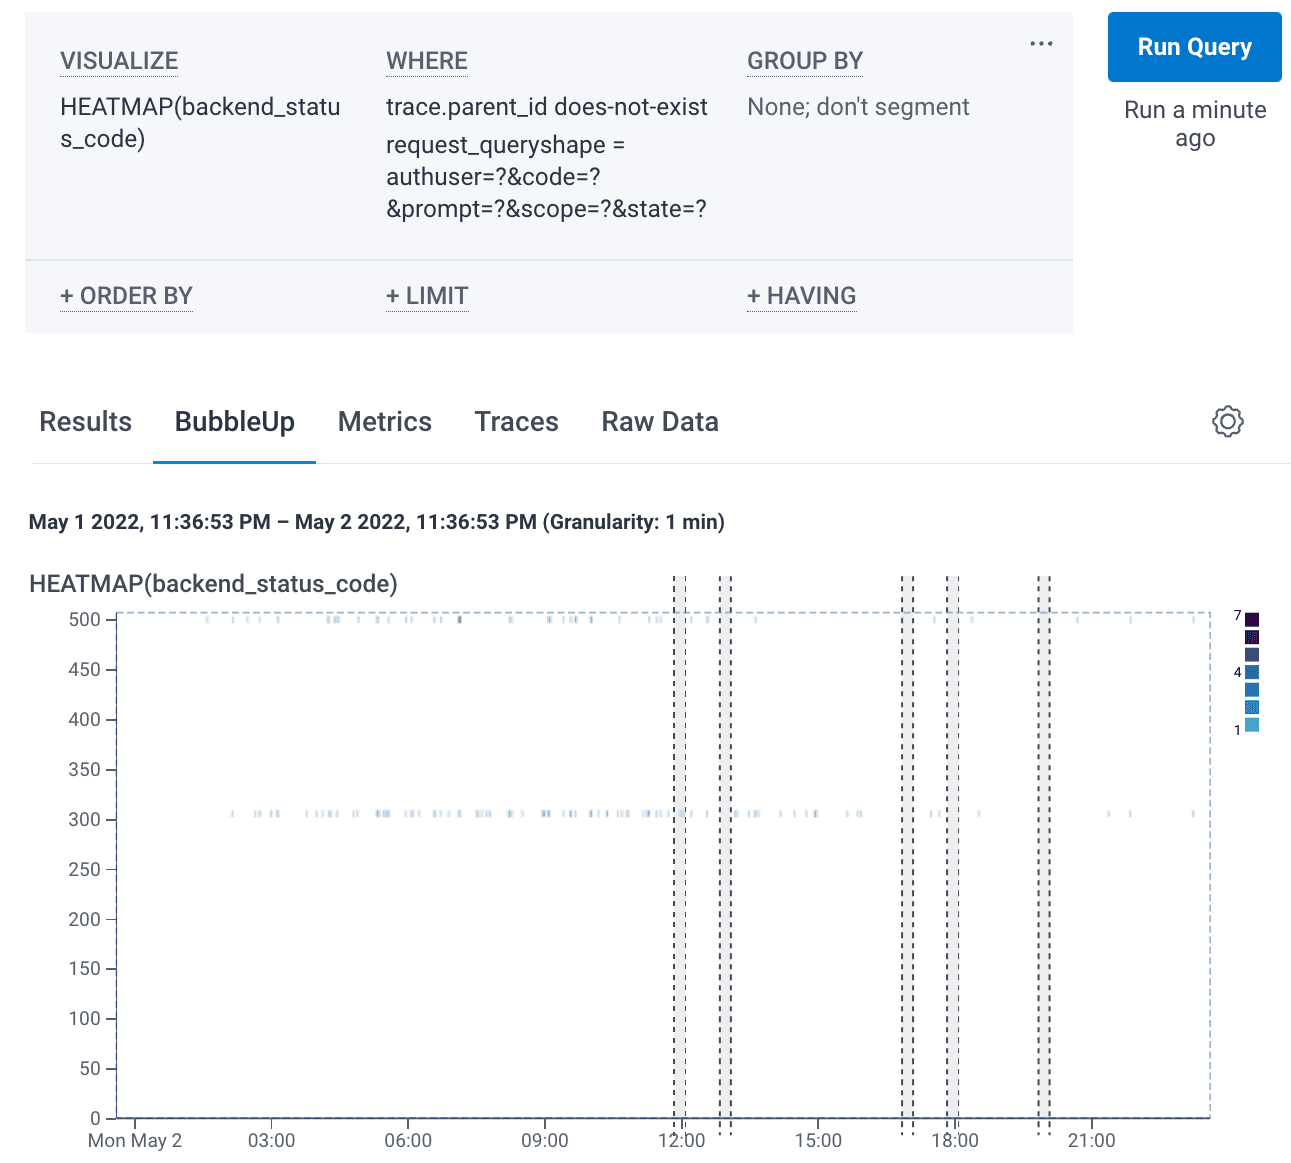
We can then click on any dimension and create additional filters from there. For example below, in the “request_queryshape” dimension since the vast majority of our 500 errors share the same shape, we might want to update our query to capture just those requests. By clicking on that column (beginning with “authuser”) and clicking on “show only where field is value”, we can filter out all other results, and our query will be updated accordingly.
We see the following showing 500s and 300s (redirection messages) status codes and continue on our journey running queries.
Wrapping up
In this incident, we confirmed the customer who called us was only being affected a small percentage of the time and we reached out to the customer to mitigate this percentage. We also leveraged Honeycomb to create a derived column that quickly tells us the percentage of issues that belong to this critical customer.
So what have we learned using Honeycomb today? We don’t have to manually comb through tedious logs trying to find issues, it’s easier to just send the data to Honeycomb. By leveraging Honeycomb’s super fast query engine to create Heatmaps and BubbleUp we’re able to discover relevant context to isolate issue(s) based on contextual attributes.
Eager to try this yourself? Get started by signing up for Honeycomb’s Free tier (always free, not just for two weeks… and sales won’t contact you!) to start pulling data and continue exploring.
Want to know more?
Talk to our team to arrange a custom demo or for help finding the right plan.