Simplify OpenTelemetry Pipelines with Headers Setter
In telemetry jargon, a pipeline is a directed acyclic graph (DAG) of nodes that carry emitted signals from an application to a backend. In an OpenTelemetry Collector, a pipeline is a set of receivers that collect signals, runs them through processors, and then emits them through configured exporters. This blog post hopes to simplify both types of pipelines by using an OpenTelemetry extension called the Headers Setter.

By: Mike Terhar

In telemetry jargon, a pipeline is a directed acyclic graph (DAG) of nodes that carry emitted signals from an application to a backend. In an OpenTelemetry Collector, a pipeline is a set of receivers that collect signals, runs them through processors, and then emits them through configured exporters. This blog post hopes to simplify both types of pipelines by using an OpenTelemetry extension called the Headers Setter.
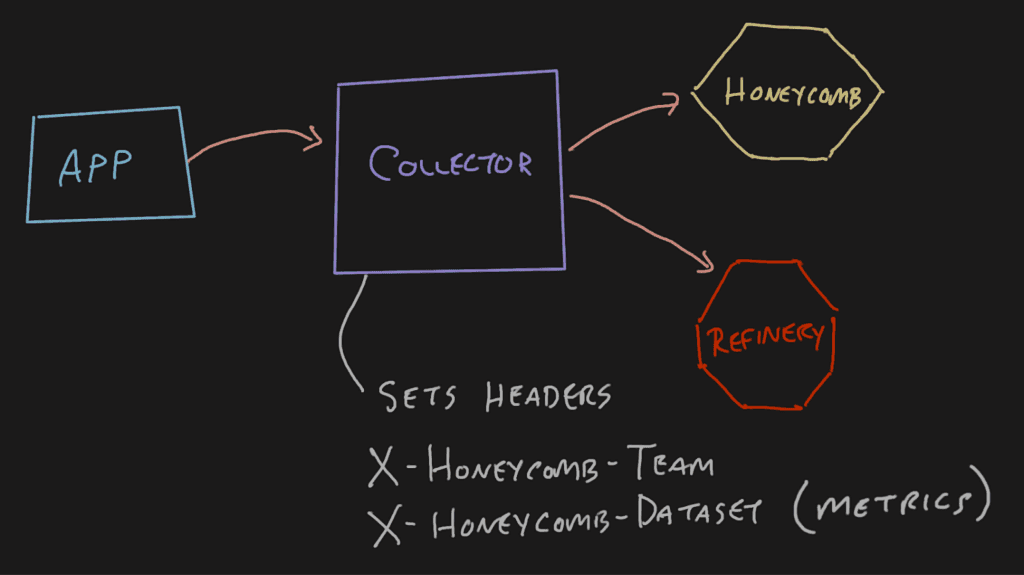
In a regularly configured telemetry pipeline, an application will send data to a Collector, which will pass it off to either Refinery or Honeycomb. When emitting OpenTelemetry signals from an application this way, the application doesn’t need to have any special headers because they can be added at the collector. This is nice for span-type data where the service.name translates into the Honeycomb dataset.
With the OpenTelemetry Collector’s default configurations, if you try to set the X-Honeycomb-Team header at the application, it’ll be dropped at the Collector.
This approach can become problematic for metrics signals depending on the topology of your telemetry pipeline. You may have a single Collector in the pipeline receiving metrics signals from infrastructure components like Kubernetes and application components like Java virtual machines (JVMs). These distinct metrics will end up in the same dataset because the X-Honeycomb-Dataset header is set at the last Collector on its way out.
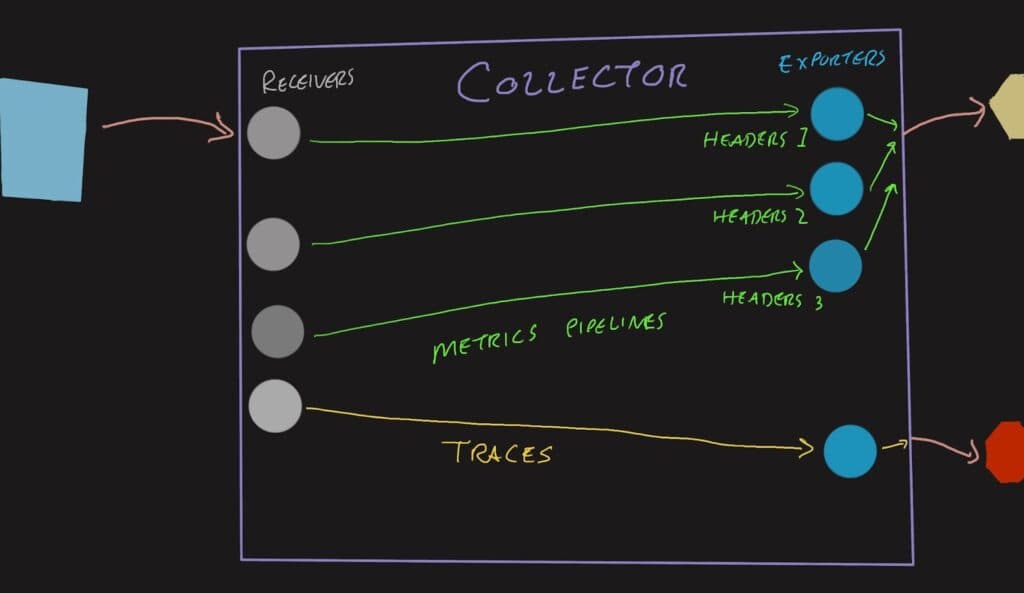
The workaround that folks have been using is to create multiple exporters (and receivers) for these metrics signals, so you’ll have an OTLP (OpenTelemetry Protocol) receiver on port 4317 that leads to the K8s header exporter, and another OTLP receiver on port 4319 that leads to the JVM header exporter.
exporters:
  otlphttp/sampled:
    endpoint: http://refinery.honeycomb.svc.cluster.local:80
    headers:
      x-honeycomb-team: MY_API_KEY
    tls:
      insecure: true
otlp/metricsk8s:
    endpoint: api.honeycomb.io:443
    headers:
      x-honeycomb-team: MY_API_KEY
      x-honeycomb-dataset: kubernetes-metrics
otlp/metricsjvm:
    endpoint: api.honeycomb.io:443
    headers:
      x-honeycomb-team: MY_API_KEY
      x-honeycomb-dataset: jvm-metrics

receivers:
  otlp:
    protocols:
      grpc:
        endpoint: 0.0.0.0:4317
  otlp/metricsjvm:
    protocols:
      grpc:
        endpoint: 0.0.0.0:4319

service:
  pipelines:
    traces:
      receivers:
        - otlp
      exporters:
        - otlphttp/sampled
    metrics:
      receivers:
        - otlp
      exporters:
        - otlp/metricsk8s
    metrics/jvm:
      receivers:
        - otlp/metricsjvm
      exporters:
- otlp/metricsjvmThis configuration snippet shows the proliferation of receivers and exporters needed by adding a second metrics destination. If your Collector also services multiple environments, there’s a multiplicative effect—with three environments having three exporters, you end up with nine pipelines. The configurations are also very terse and easy to mix up. Using YAML anchors can DRY (don’t repeat yourself) the configuration a bit, but then it’s even more magical and terse.
Headers Setter extension
The best way to work through this is to use the Headers Setter extension to pass headers through in certain situations. It was designed to pass authentication headers, so some of the terminology isn’t perfectly analogous to this example, but it can be used to pass the X-Honeycomb-Team header, which is authentication-related.
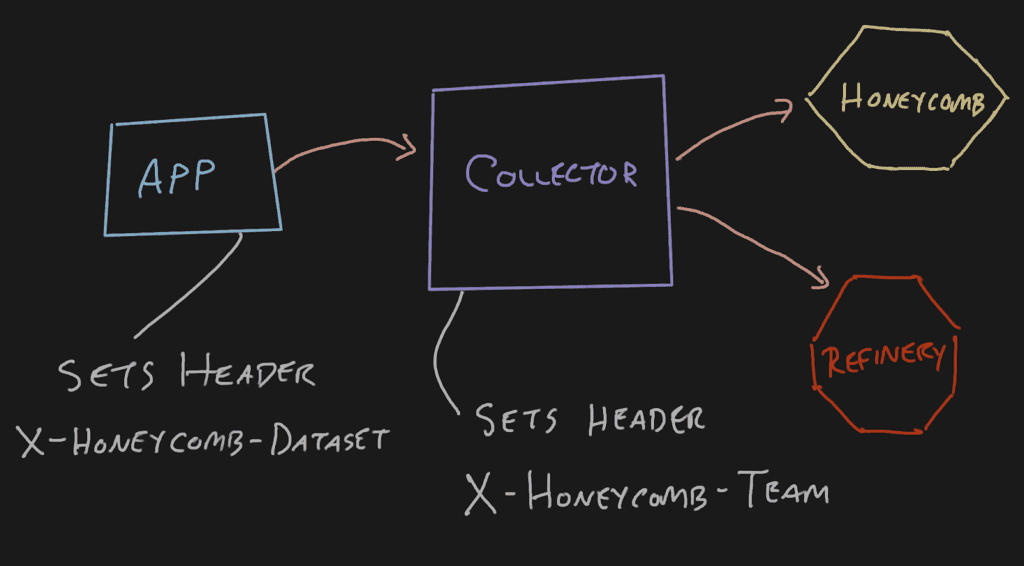
How does it work?
When data arrives at a receiver, such as OTLP, it can have all sorts of headers and other metadata attached to it. Typically, they are unpacked and stripped away, leaving behind only the OpenTelemetry signals (batches of spans and metrics). Each is then processed through the defined processors. Once all that is done, the data is delivered to the exporters and sent according to the exporter configuration.
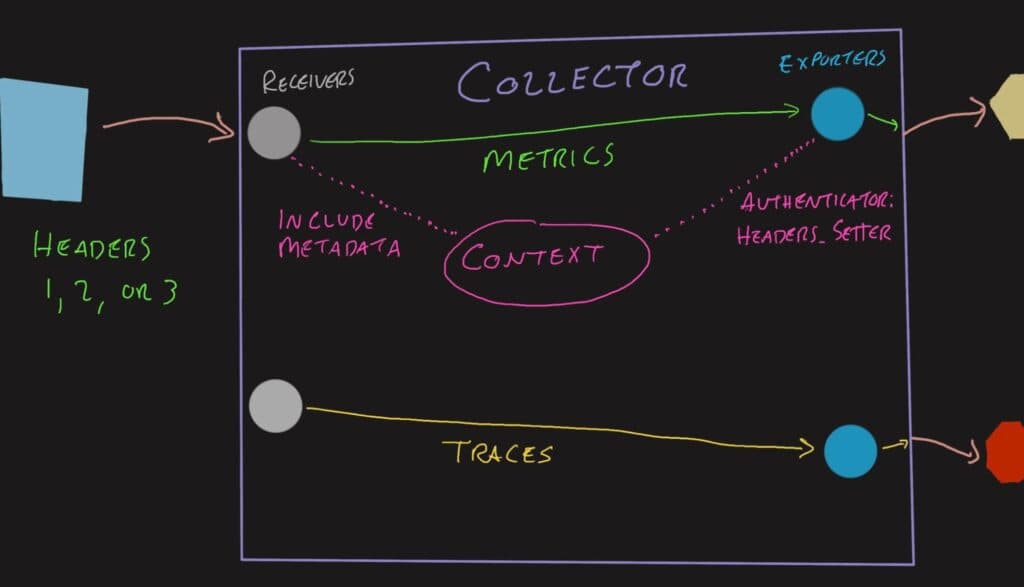
When using the Headers Setter extension, a few things change:
- The headers on the receiver are added to a Context object that accompanies the signal data
- The Headers Setter configuration rules are applied to the inbound headers to create outbound headers
- The exporter adds the outbound headers to the connections
Different protocols and batching typically shuffle all of this information around, requiring this extension to be quite powerful. It is able to retain these links between the data and the metadata throughout the processing stage—and even through assembling new batches!
How to configure the Headers Setter extension
The configuration for this extension is a bit weird since it impacts the operations of both the receiver and exporter, so it has to do a bit of work in the middle.
Configure the receivers
The first thing we have to do is include the headers in the data that is managed by the OpenTelemetry Collector. Since this Headers Setter extension is not a processor, it doesn’t interact with the span data—just the connections on either end.
Add include_metadata: true to any receivers that will accept traffic that has valuable headers. The receiver configuration looks like this if you have OTLP enabled and want to allow traffic using both HTTP and GRPC:
receivers:
  otlp:
    protocols:
      http:
        endpoint: 0.0.0.0:4318
        include_metadata: true
      grpc:
        endpoint: 0.0.0.0:4317
include_metadata: trueConfigure the exporters
Next, we must ask the Headers Setter extension to imbue the outbound connection with the headers that it’s required to add. To do this, we add authenticator: headers_setter to the exporters that may have metrics traversing them.
It’s okay to add the X-Honeycomb-Dataset header, indicating a metrics dataset on the same exporter that’s sending trace data. That header is ignored for the spans included in the batch, but will be honored for any metrics included. On the other hand, if Refinery is in the way, you’ll need a separate exporter to send spans to Refinery and metrics directly to Honeycomb.
Here’s an exporter snippet that shows how the auth block fits into the exporter configuration:
exporters:
  otlp/metric:
    endpoint: api.honeycomb.io:443
    headers:
      x-honeycomb-team: MY_API_KEY
    auth:
authenticator: headers_setterConfigure the batch processor
In the OpenTelemetry Collector configuration, there’s a block called processors where configurations for processors live. Typically there’s a blank batch processor in here. We need to allow the batch processor to track the metadata with the following configuration:
processors:
  batch:
    metadata_keys:
      - x-honeycomb-dataset
metadata_cardinality_limit: 30If you want to add multiple keys such as x-honeycomb-team, it’ll need to be added to the array here.
The cardinality limit is there to protect the processor if invalid information starts showing up. The suggestion here of 30 gives it plenty of room to have lots of dataset names. If your environment has even more, that number can be safely increased.
Configure the service
In the OpenTelemetry Collector configuration, there’s a block called service where extensions and pipelines are set. Under the extensions array, add the headers_setter:
service:
  extensions:
- headers_setterAdd the extension and configure the rules
Lastly, add the headers_setter extension. If you want to take a value from the inbound connection, use from_context and reference the inbound header by name. If you want to make a hard-coded value for a specific header, you can use value instead.
extensions:
  headers_setter:
    headers:
      - action: upsert
        key: x-honeycomb-dataset
from_context: x-honeycomb-datasetIf you want to pass both the X-Honeycomb-Dataset and X-Honeycomb-Team headers, maybe from a downstream or gateway Collector beyond this one, you can do that easily:
extensions:
  headers_setter:
    headers:
      - action: upsert
        key: x-honeycomb-dataset
        from_context: x-honeycomb-dataset
      - action: upsert
        key: x-honeycomb-team
from_context: x-honeycomb-teamPutting it all together
There’s nothing more comforting than a full example configuration file to scrutinize when using a new technology.
extensions:
  health_check: {}
  memory_ballast:
    size_in_percentage: 10
  headers_setter:
    headers:
      - action: upsert
        key: x-honeycomb-dataset
        from_context: x-honeycomb-dataset

processors:
  batch:
    metadata_keys:
      - x-honeycomb-dataset
    metadata_cardinality_limit: 30
  memory_limiter:
    check_interval: 5s
    limit_percentage: 80
    spike_limit_percentage: 25

receivers:
  otlp:
    protocols:
      http:
        endpoint: 0.0.0.0:4317
        include_metadata: true
      grpc:
        endpoint: 0.0.0.0:4319
        include_metadata: true

exporters:
  otlphttp/metric:
    endpoint: https://api.honeycomb.io:443
    headers:
      x-honeycomb-team: MY_API_KEY
    auth:
      authenticator: headers_setter
  otlphttp/sampled:
    endpoint: http://refinery.honeycomb.svc.cluster.local:80
    headers:
      x-honeycomb-team: MY_API_KEY
    tls:
      insecure: true

service:
  extensions:
    - headers_setter
    - health_check
  pipelines:
    traces:
      receivers:
        - otlp
      exporters:
        - otlphttp/sampled
    metrics:
      receivers:
        - otlp
      exporters:
- otlphttp/metricWith this configuration, you can send data to as many datasets as makes sense. I would keep most of the metrics datasets by type of metric. For example, all JVM metrics from the Java hosts should go to a single jvm-metrics dataset in each environment. Same with all the Kubernetes metrics. Don’t make different datasets for different clusters since the cluster name can be used as a filter.
Sending headers for the new configuration
Now that we have the Collector configured to send these things where they need to go, we need to make sure the application or upstream Collectors include the necessary headers.

The easiest way to set this for a Java application is by using environment variables defined by the OpenTelemetry OTLP exporter configuration page. It’s set so the value is broken out like key1=value1,key2=value2 so if you want to set only the X-Honeycomb-Dataset header, it’d look like this:
export OTEL_EXPORTER_OTLP_METRICS_HEADERS=x-honeycomb-dataset=jvm-metricsIf you have an OpenTelemetry Collector configured to pull metrics from your Kubernetes clusters, you can add the X-Honeycomb-Dataset header to the exporter on that and either send it directly to Honeycomb or through the Header Setter-configured gateway Collector. Either will work now. Your Kubernetes cluster doesn’t have to communicate directly with the internet anymore!
Conclusion
I hope this blog gave you a quick workaround for header setting issues.
Did you know we just launched Honeycomb for Kubernetes? If you’re interested in observability into your Kubernetes clusters, this one’s for you.
Want to know more?
Talk to our team to arrange a custom demo or for help finding the right plan.