Send a Test Span Through an OpenTelemetry Collector
The scenario: you want to see distributed traces, maybe for your web app. You’ve set up an OpenTelemetry collector to receive OTLP traces in JSON over HTTP, and send those to Honeycomb (how to do that is another post, and we’ll link it here when it’s up). The question: does it work? Let’s test the collector and its connection to Honeycomb by sending a test span.


The scenario: you want to see distributed traces, maybe for your web app. You’ve set up an OpenTelemetry collector to receive OTLP traces in JSON over HTTP, and send those to Honeycomb (how to do that is another post, and we’ll link it here when it’s up).
The question: does it work?
Let’s test the collector and its connection to Honeycomb by sending a test span. To do this, we’ll need to:
- Put a test span in a file
- Send that data to the collector (using curl or Postman)
- Find the span in Honeycomb
Here we go!
Sample OTLP JSON Trace Span
Here’s a minimal example trace in JSON, with all the fields required by the OTLP/HTTP protocol schema (as of August 2022).
{
 "resourceSpans": [
   {
     "resource": {
       "attributes": [
         {
           "key": "service.name",
           "value": {
             "stringValue": "test-with-curl"
           }
         }
       ]
     },
     "scopeSpans": [
       {
         "scope": {
           "name": "manual-test"
         },
         "spans": [
           {
             "traceId": "71699b6fe85982c7c8995ea3d9c95df2",
             "spanId": "3c191d03fa8be065",
             "name": "spanitron",
             "kind": 2,
             "droppedAttributesCount": 0,
             "events": [],
             "droppedEventsCount": 0,
             "status": {
               "code": 1
             }
           }
         ]
       }
     ]
   }
 ]
}If you’re going to send the span with curl, put this into a file called `span.json`.
If you’re going to send it with Postman, put this into the request body.
Here are the values you might want to replace:
- Service name: “test-with-curl” in this JSON is going to show up in the `service.name` field in your trace span. In Honeycomb, you’ll look for the span in that service dataset. You might want a different service name for this test.
- Library name: “manual-test” in this JSON is going to show up in the `library.name` field in your trace span. That describes what instrumentation code created this.
- Name: “spanitron” in this JSON is going to show up in the `name` field in your trace span. You might want to make this more descriptive.
- Span kind: the value of “kind” in this JSON is 2, which corresponds to a `span.kind` of `server`. That’s usually the first kind of span any app creates when it receives a request. The other options are 1 for `client` or 3 for `internal` instead. (For reference: the schema.)
Send a span to the collector
Here’s the command. Check the URL and then run this at the command line, or paste it into Postman.
curl -i http://localhost:4318/v1/traces -X POST -H "Content-Type: application/json" -d @span.jsonHere,
- `-i` means “show me what happens”
- `http://localhost` is the URL to the collector—yours might be different
- `4318` is the port standard port for OTLP/HTTP
- `/v1/traces` is the standard endpoint for OTLP traces
- `-X POST` sends an HTTP POST request
- `-H "Content-Type: application/json"` says “here comes some JSON”
- `-d @span.json` says “read the body of the request from a file called span.json”
If you’re using Postman, you’ll probably paste in the body separately, so you won’t need the `-d span.json`.
The collector should respond happily, and say very little:
HTTP/1.1 200 OK
Content-Type: application/json
Vary: Origin
Date: Tue, 12 Jul 2022 18:44:50 GMT
Content-Length: 2
{}
The collector logs also say nothing. It doesn’t log about normal functioning.
See your span in Honeycomb
Finding a particular test span in Honeycomb might look different depending on your setup. This should take about ten seconds (after you’re logged in). The video below includes troubleshooting for other cases. If you don’t want a video, skip ahead.
New to Honeycomb? Try it today!
Roughly:
Click New Query (the magnifying glass).
Check your dataset: usually it’s the same as service.name in the span. The example uses “test-with-curl.” Change the dropdown selection if it shows something different.
Click Run Query.
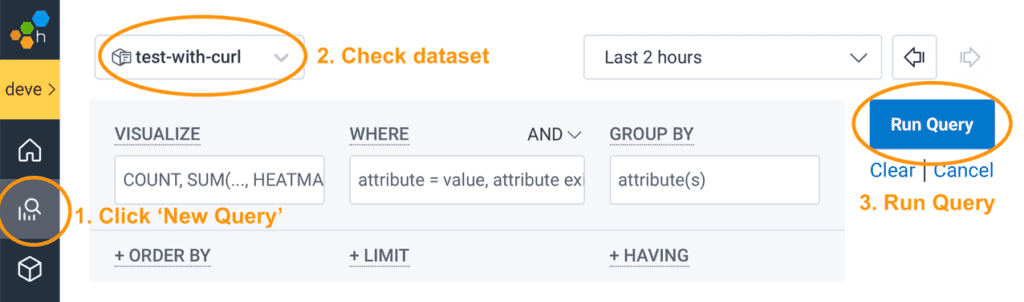
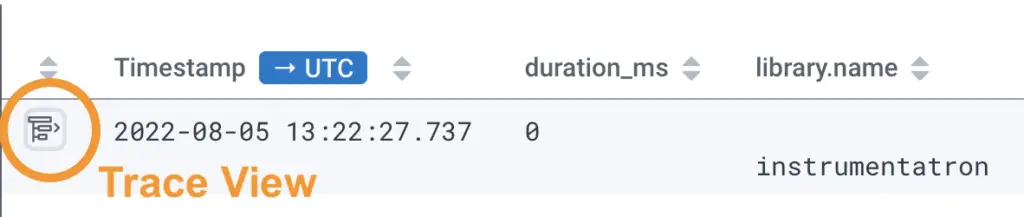
See a grid of Raw Data. The most recent spans are at the top. Is yours there?
Yes! Success!
When you find it, click the tiny Trace View button at the left.
You’ll see a rather boring trace with just one span.
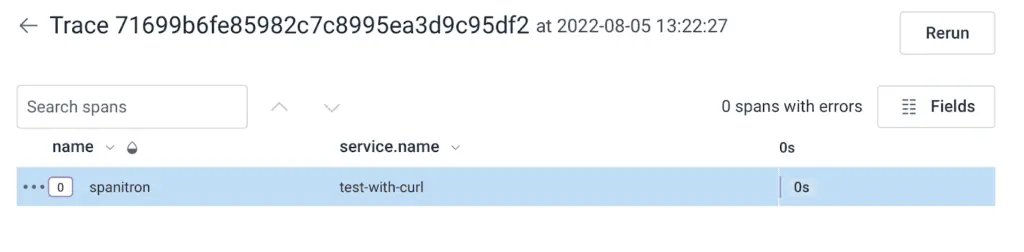
Proceed with sending real traces to your collector.
No! Failure!
Something not working?
The video above includes some troubleshooting tips. Here are more:
I can’t find my event in Honeycomb.
Check the collector logs for clues. For instance, with a bad API key, mine says `2022-07-08T16:33:35.114Z error exporterhelper/queued_retry.go:183 Exporting failed. The error is not retryable. Dropping data.{"kind": "exporter", "name": "otlp/honeycomb", "error": "Permanent error: rpc error: code = Unauthenticated desc = missing 'x-honeycomb-team' header", "dropped_items": 1}`
Check that you’re looking in the environment that matches your API key. The environment selector is at the top left, just under the Honeycomb logo. Click it and choose “Manage Environments” to get a list of environments and the option to view their API keys.
I don’t remember what Honeycomb team this API key sends to.
I made an app for that: https://util.jessitron.honeydemo.io/
This calls the Honeycomb API to find out what team and environment that API key points to.
For a collector in Kubernetes: I don’t remember what API key I put in my secret.
Here’s a spell for you:
kubectl get secret honeycomb-api-key-for-frontend-collector -o jsonpath="{.data.api-key}" | base64 -d
My kubernetes secret is called `honeycomb-api-key-for-frontend-collector`. Yours may have a different name. I found the name of the secret by looking at the values.yaml that I passed to Helm.
Want to know more?
Talk to our team to arrange a custom demo or for help finding the right plan.