Ask Miss O11y: Tracing Is for Async, Too
I have a good sense of how to use traces to understand my system’s behavior within request/response cycles. What about multi-request processes? What about async tasks spawned within a request? Is there a higher-level…

I have a good sense of how to use traces to understand my system’s behavior within request/response cycles. What about multi-request processes? What about async tasks spawned within a request? Is there a higher-level or more holistic approach?
It sounds like you know what you’re doing for tracing synchronous requests. Distributed tracing was made for this: the root span is the request coming from outside, everything that we do before responding is a child span, and the root span ends when we send the response.

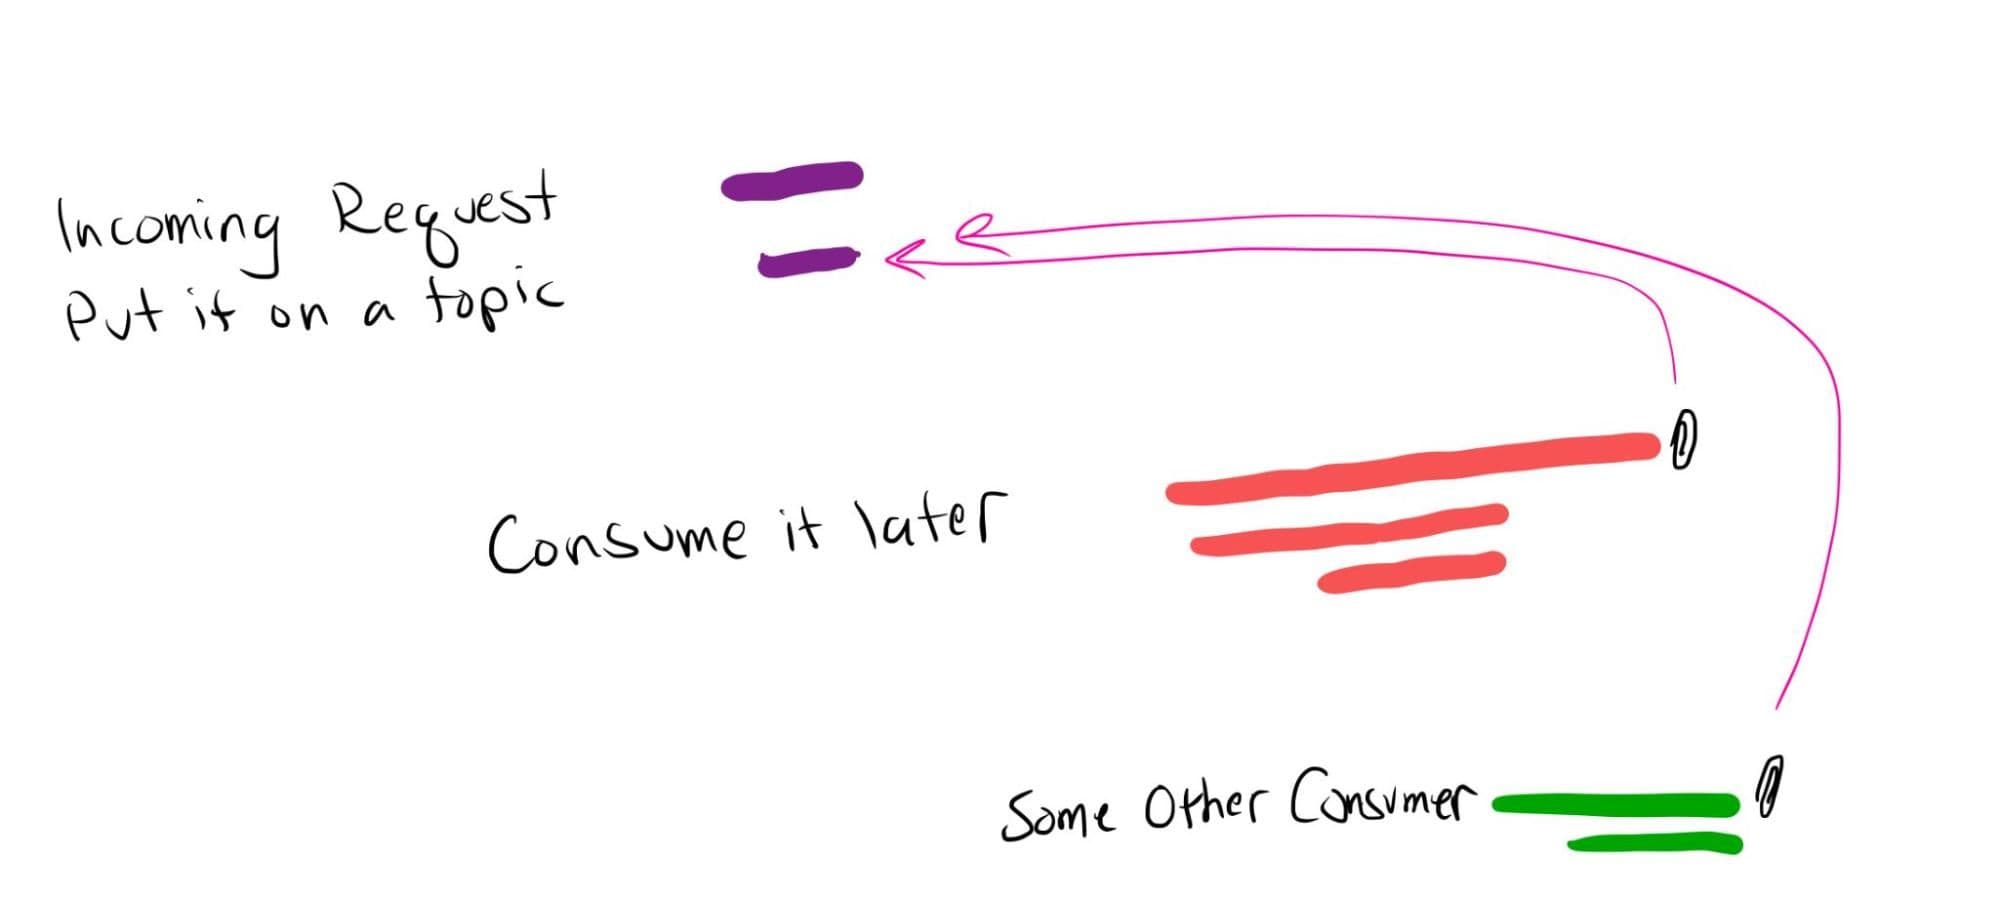
Not everything is a synchronous response! Sometimes we receive a message from outside, acknowledge it, and then do work later. Maybe we put the message on a Kafka topic and a consumer picks it up from there. How do we tie the consumer’s work to the external request that triggered it?
We can do this two ways. If we have a service-level objective (SLO) around the full processing time, then maybe we want it all to be one trace. We can propagate the context along to the consumer and continue the trace asynchronously. In Honeycomb, the root span shows up with a short duration but a long tail, where the tail incorporates all child spans.

This asynchronous context propagation has the advantage of drawing the whole picture of the request processing, just like the synchronous-request tracing. There’s one pitfall: If some of the spans fall outside of the time window of your query, you won’t see them. Every query in Honeycomb starts with a timespan, and requests that arrive in that timespan but are processed outside of it will look like they were never processed. This isn’t a problem as long as you’re aware of it, and as long as you know how long you need to extend the timespan to see the whole thing.
What if you don’t know when the request will be processed? What if it could be hours? What if there are many consumers, and you don’t want all of them included in the trace? Too many child spans can make a trace less meaningful.
In this case, use span links instead. Pass the context along with the message like before, but each consumer create its own root span, its own trace. Then link that back to the originating trace using a span link. In Honeycomb, click the span link to jump to the related trace.
Linking spans lets you connect traces while keeping them independent. This also works for the multi-request process you mentioned: have one top-level trace, plus separate traces for each request that link back to their initiator.
Either way: when you create the first span in the asynchronous consumer, be sure to calculate how long the request has been waiting and put that as an attribute on the span. That way you can graph the delay and watch it for changes.
I wish I could tell you that all of this is easy, but OpenTelemetry tooling is still maturing. I can only tell you that it’s possible, and Honeycomb will help you navigate the links you add to your spans.
Every process, like the multi-request process and the asynchronous process, has its own story. As a developer, you get to teach the code to tell you that story. Make it one that speaks to you.
Do you have a question for Miss O11y? Send an email to misso11y@honeycomb.io or tweet us at @honeycombio.
Want to know more?
Talk to our team to arrange a custom demo or for help finding the right plan.
