Achieving Great Dynamic Sampling with Refinery
Refinery, Honeycomb’s tail-based dynamic sampling proxy, often makes sampling feel like magic. This applies especially to dynamic sampling, because it ensures that interesting and unique traffic is kept, while tossing out nearly-identical “boring” traffic. But like any sufficiently advanced technology, it can feel a bit counterintuitive to wield correctly, at first.

Refinery, Honeycomb's tail-based dynamic sampling proxy, often makes sampling feel like magic. This applies especially to dynamic sampling because it ensures that interesting and unique traffic is kept while tossing out nearly identical "boring" traffic. But like any sufficiently advanced technology, it can feel a bit counterintuitive to wield correctly at first.
On Honeycomb's Customer Architect team, we're often asked to assist customers with their Refinery clusters. The most common question we get is, "Why isn't Refinery hitting the goal sample rates I've set? It's not even coming close." Sometimes, they just want Refinery to sample harder and don't know how to make that happen.
This blog post details the techniques we use to get Refinery sampling far more effectively, as well as troubleshooting common pitfalls. We assume you're already running the latest version of Refinery (3.0.1 at the time of writing) and sending all your traffic through it. If not, check out this guide first.
If you're unfamiliar with Refinery and its sampling techniques, check out the amazing video series in the Honeycomb Academy here!
Start here
Life-saving diagnostic fields
Before you do anything else, ensure that you have the following diagnostic config options set in your Refinery config file (config.yaml). These will add some fields to all new spans, but don't sweat it! They won't impact performance or cost you a penny:
RefineryTelemetry:
  # Adds meta.refinery.reason to traces showing which rule matched
  AddRuleReasonToTrace: true
  # Adds detailed counts (spans, events, links) to root spans for analysis
  AddCountsToRoot: true

Debugging:
  # Token for accessing /query endpoint to debug sampling decisions
  QueryAuthToken: "SomeRandomValue"
  # Additional fields to include in error logs for troubleshooting
  AdditionalErrorFields:
    - trace.trace_id
    - trace.parent_id
    - service.name
    - name
    - host.name

Traces:
  # Trigger sampling decisions on traces exceeding this span count
  SpanLimit: 10_000

SampleCache:
  # Number of kept trace records to retain for late-arriving spans
KeptSize: 100_000Note that AddSpanCountToRoot and AddHostMetadataToTrace are now enabled by default in Refinery 3.0, so you don't need to set them explicitly anymore. However, AddCountsToRoot gives you even more granular metadata including span events, span links, and honeycomb events—invaluable for debugging sampling decisions.
While you're in that config file, let's ensure Refinery is reporting back to Honeycomb so that you can leverage the Refinery 3 Operations board template. More on this later.
If you're a Honeycomb Enterprise customer, you're entitled to complimentary events for Refinery metrics and logs. Talk to your account team about this. If not, feel free to crank up the SamplerThroughput and ReportingInterval values to fit your events budget.
Logger:
  # Send Refinery's own logs to Honeycomb
  Type: honeycomb
  Level: info

HoneycombLogger:
  APIHost: "https://api.honeycomb.io"
  APIKey: "${HONEYCOMB_API_KEY}"
  Dataset: "Refinery Logs"
  # Enable sampling of Refinery's logs to control volume
  SamplerEnabled: true
  SamplerThroughput: 10

OTelMetrics:
  # Send Refinery's operational metrics to Honeycomb
  Enabled: true
  APIHost: "https://api.honeycomb.io"
  APIKey: "${HONEYCOMB_API_KEY}"
  Dataset: "Refinery Metrics"
  # How often to report metrics (balance freshness vs overhead)
ReportingInterval: 60sA side quest into Usage Mode
Let’s run some queries in Usage Mode. If you’re not familiar with it, Usage Mode disables Honeycomb’s automatic adjustments for sample rate and provides you with a Sample Rate field you can visualize. There are two ways to get into it:
Usage Mode, the clicky way
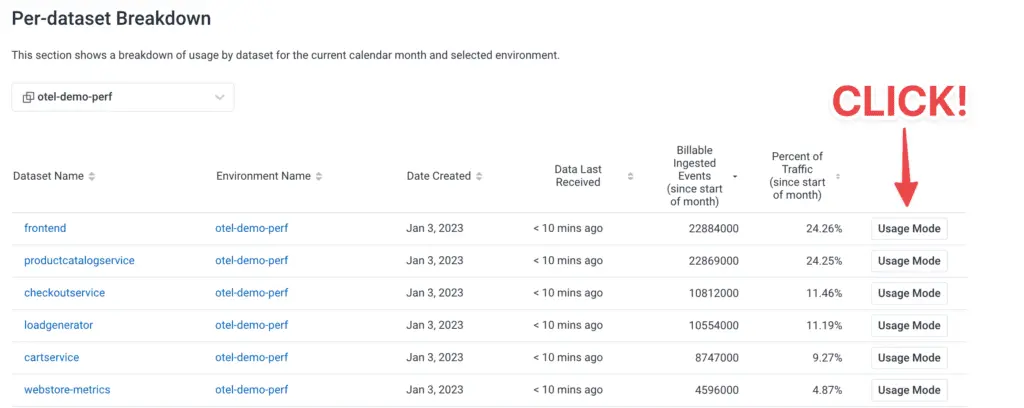
First, head on over to your Usage page, via the “mood ring” in the bottom-left corner of the Honeycomb UI.

Scroll to the bottom of the Usage page, where you’ll find the Per-dataset Breakdown section. Sort this by either Billable Ingested Events or Percent of Traffic, and click the Usage Mode button for the top one. Now, you’re querying that dataset in Usage Mode (note: if this is a non-Classic environment, you can switch to “All datasets in environment” and remain in Usage Mode).
Usage Mode, the hacker way
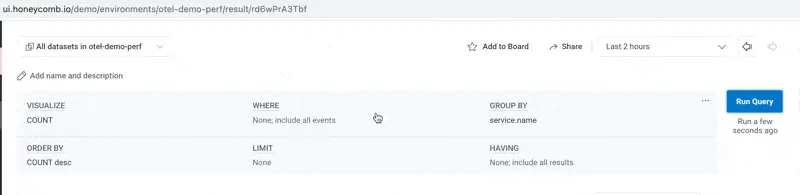
The astute will notice that the query builder URL is slightly different—there’s now /usage/ in the path. That’s the whole trick, right there.
You can take any empty query builder screen and throw /usage/ at the end:

You can even take any existing query and ✨transform✨ it into Usage Mode! Make sure to hit “Run Query” again to get the right results.
How’s my sampler doing now?
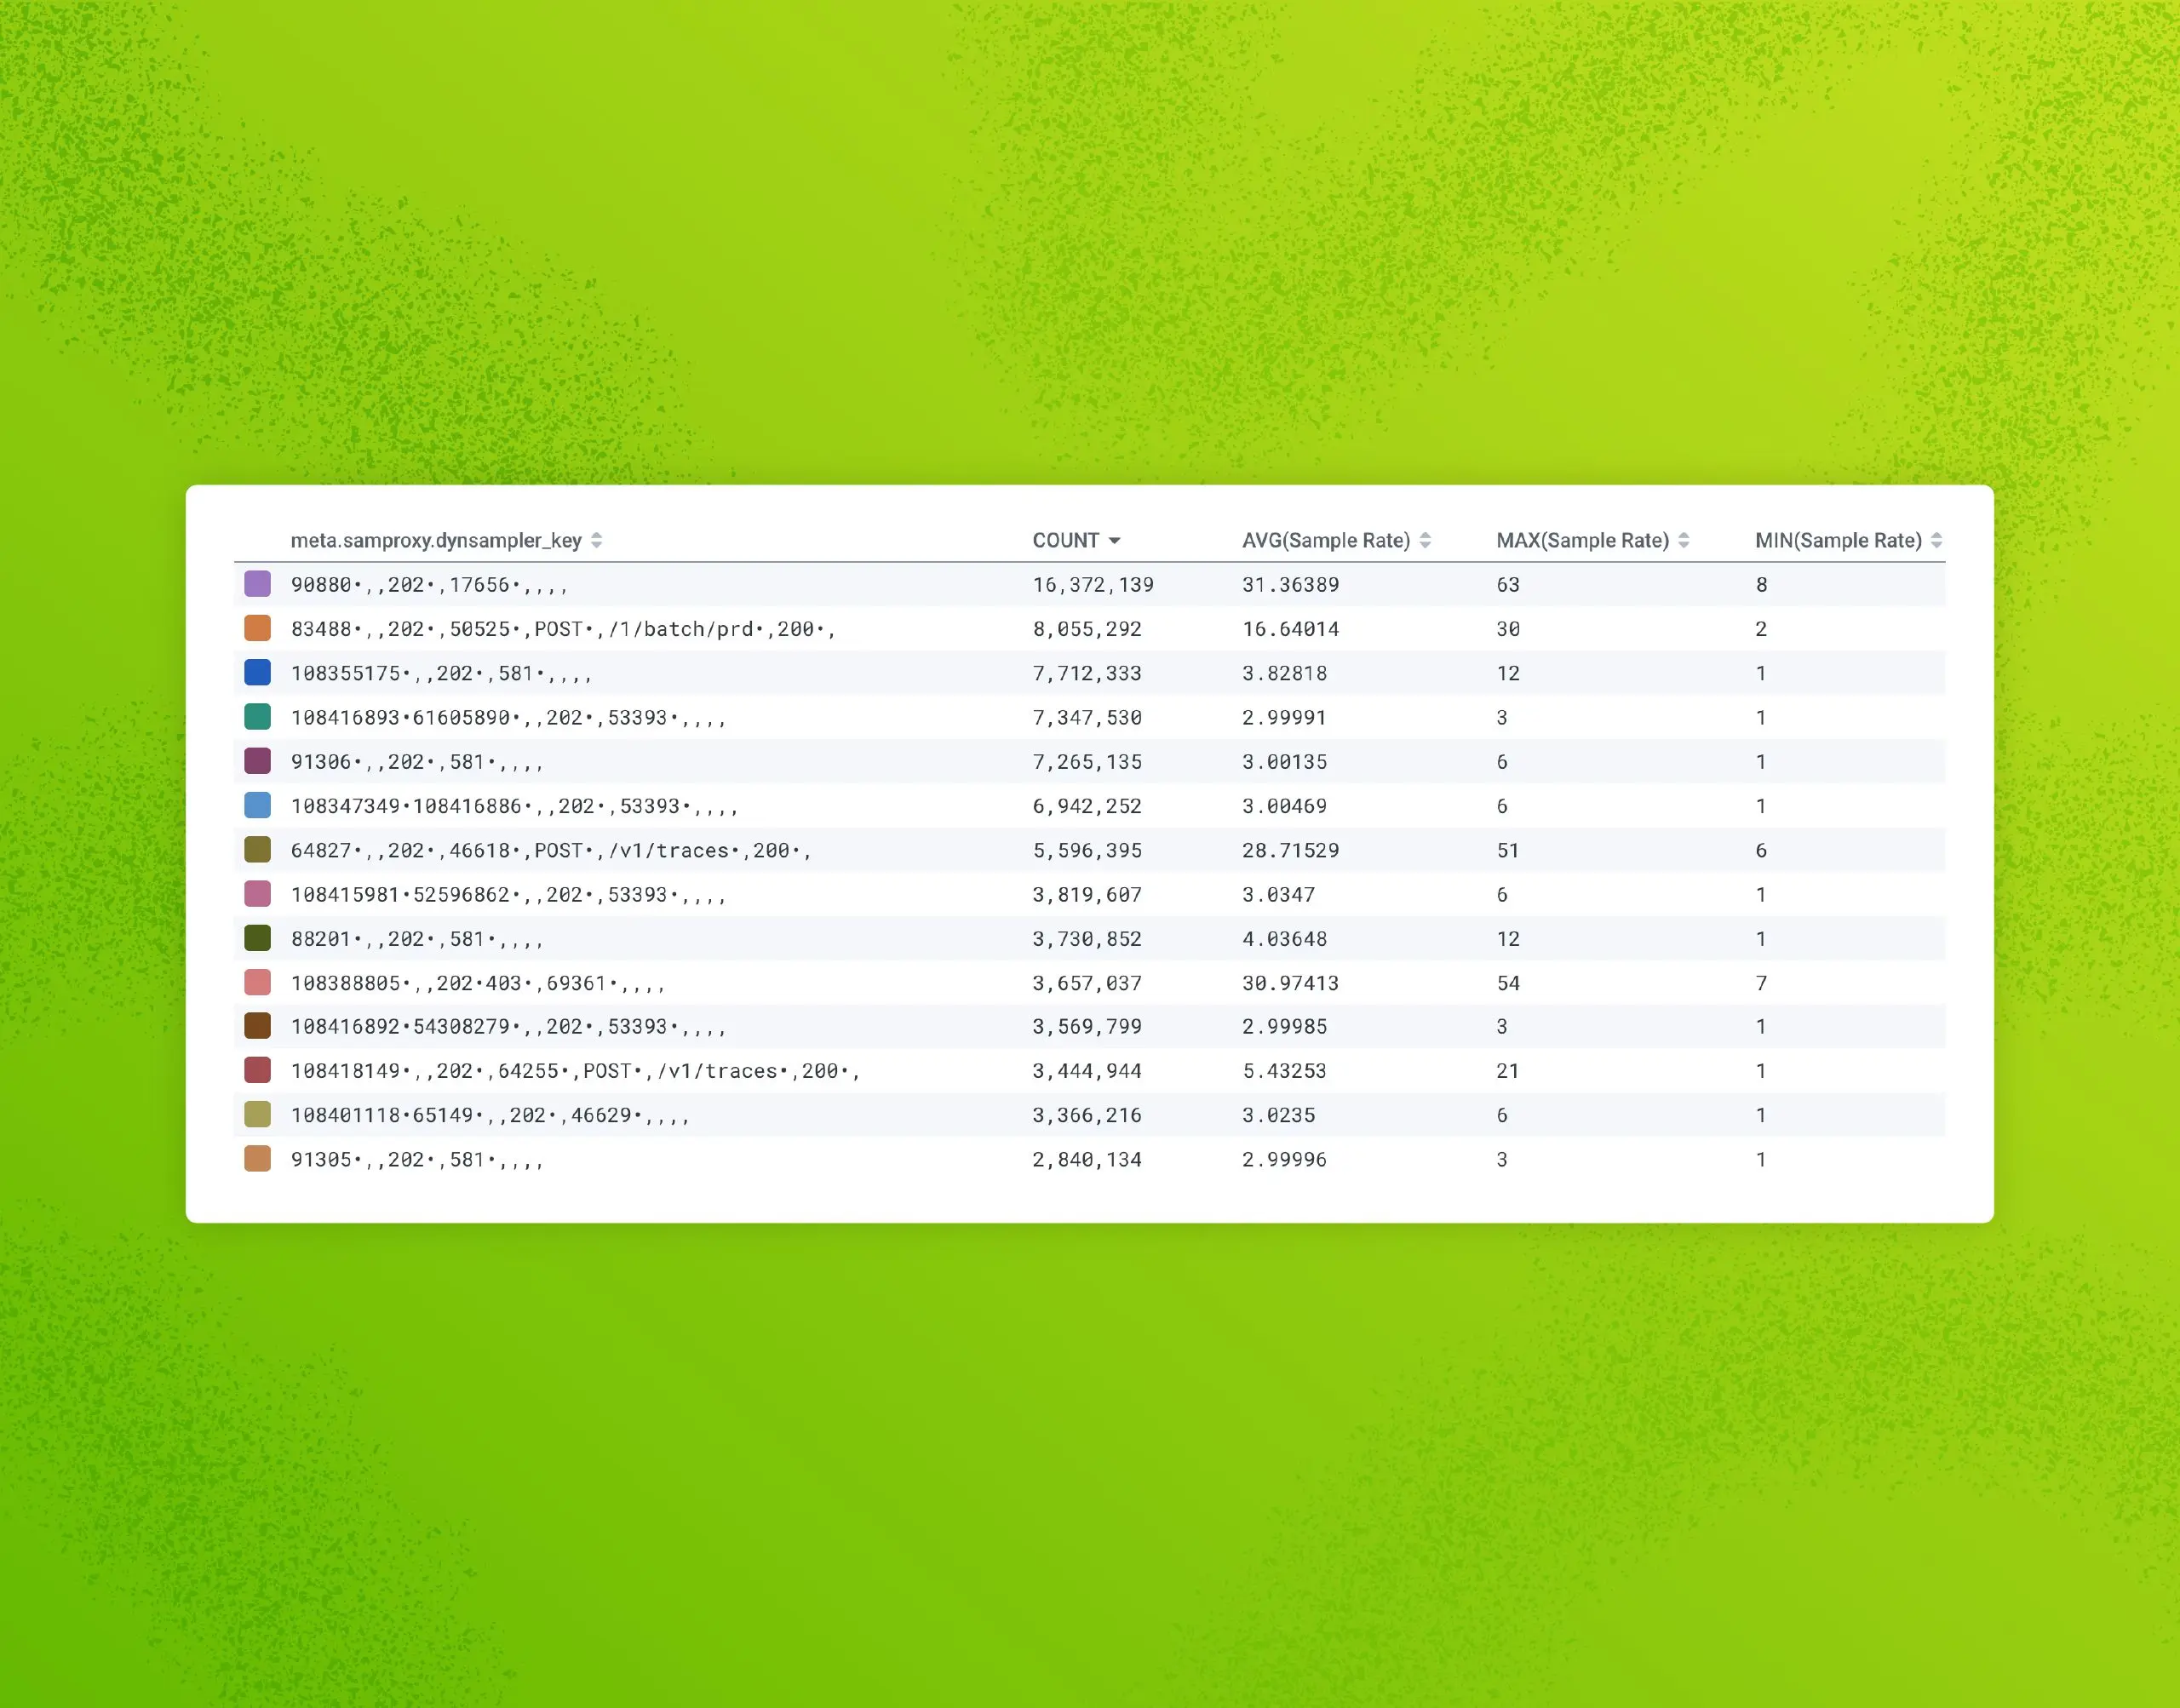
Now that you’ve identified your biggest (by event volume) datasets and environments and know how to query them in Usage Mode, let’s start with a simple visualize of COUNT, AVG(Sample Rate), MAX(Sample Rate), and MIN(Sample Rate) over the past 24 hours. Later on, you can optionally replace those three Sample Rate vizzes with a heatmap—but for now we want to see are straight numbers reported in the results table below.
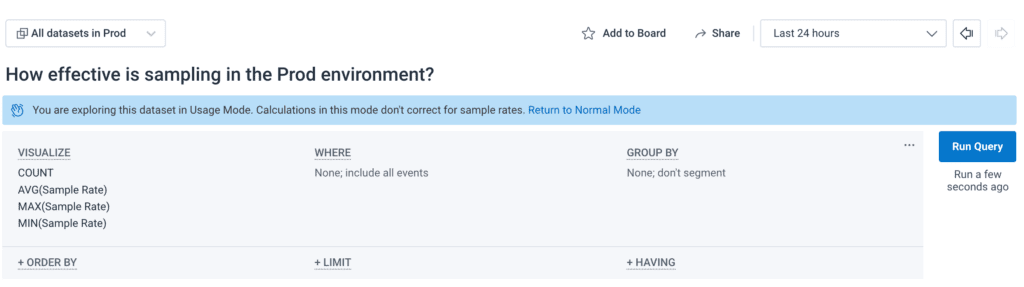
This results in the following:
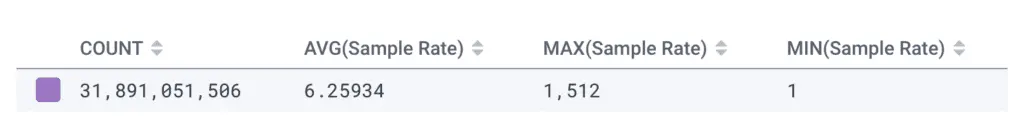
In this environment, some things are heavily sampled (one out of every 1512 events), but our overall sample rate is relatively poor—just one out of every six events. We could probably do better.
Breaking down the data to find what went wrong
Let’s iterate through a few different GROUP BY sets to figure out where the poor (and great) sampling is. Let’s start with some well-known low-cardinality identifiers. I always start with service.name, but this may vary in your data.
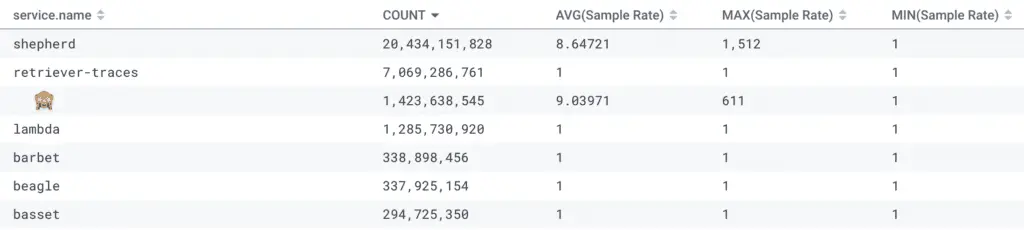
We can see right away that the shepherd service is where we should spend our time and energy. It has sent more post-sampled events than all of the other services combined.
Another example of what can go wrong right out of the box:
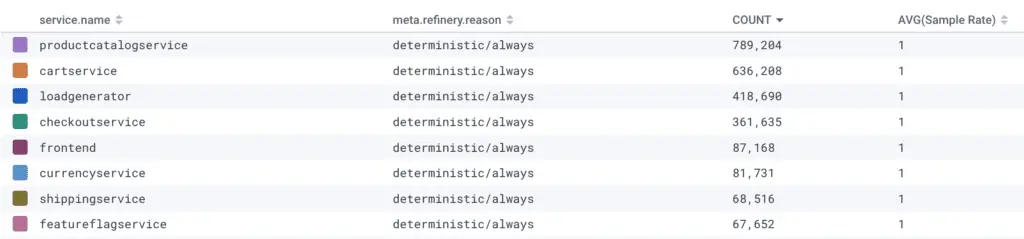
Oops! The environment name was typoed in the rules.yaml, so none of the events matched and were passed through with the reason deterministic/always.
High cardinality is awesome and we love it, except as a dynamic sampler key
The meta.refinery.sample_key field is your best friend when diagnosing dynamic sampler misbehavior. Combined with the meta.refinery.reason field showing which rule was evaluated, you can quickly see which dynamic sampler rules need tuning.
The dynsampler key is comprised of all of the fields in the EMADynamicSampler FieldList, separated by a comma. Inside that, you'll see a list of all detected values in a trace separated by a bullet (•).
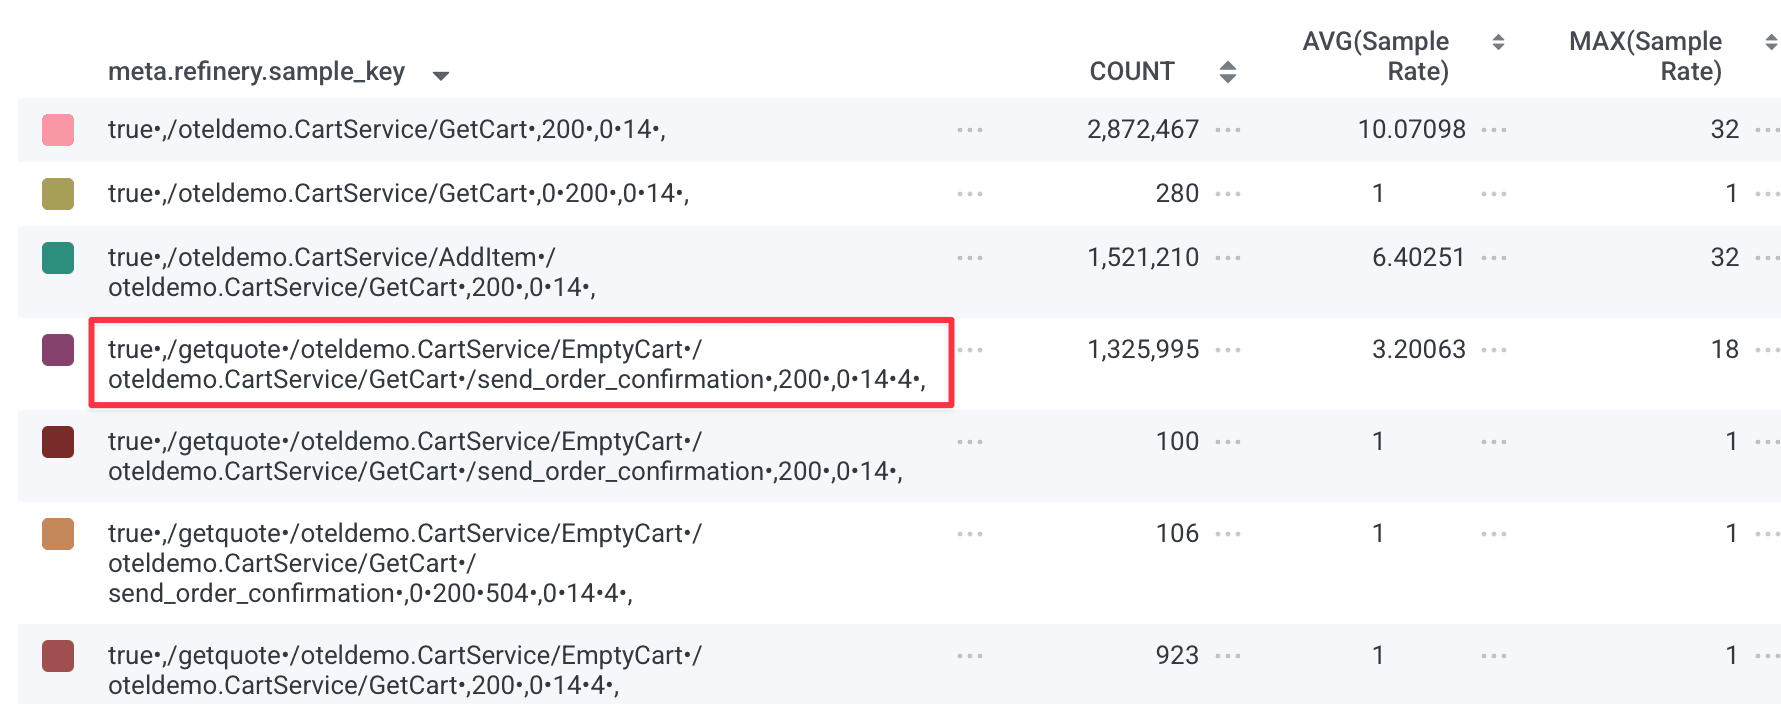
This is quite a big gotcha with Refinery's dynamic sampler. Because it's making a trace-level sampling decision, it must consider all of the unique values of every field in the field list, and every unique combination is a new sampler key. This means that Refinery will consider it to be unique and interesting, and worth applying a very low sample rate to.
In the most extreme examples, you can have dozens of different values for a given field in a trace, because each span emits a different value for that field. This results in thousands of unique sampler keys, and very little chance that dynsampler will hit the goal sample rate. Ideally, you want no more than a few dozen (certainly <100) unique dynsampler keys if you want Refinery to hit the goal sample rate and behave in a predictable fashion.
If you're seeing high cardinality in your keys and your EMA sampler is struggling, go back and:
- Review your
FieldList—can you remove high-cardinality fields? - Check your
AdjustmentInterval—is it long enough for your key cardinality? - Consider using the
root.prefix on field names to reduce cardinality (e.g.,root.http.routeinstead ofhttp.route)
Tuning the EMADynamicSampler for stability
If you're using EMADynamicSampler (and you should be—it's generally the best dynamic sampler for most use cases), then there's a critical tuning parameter that can make or break its effectiveness: the AdjustmentInterval.
My colleague Kent Quirk wrote an excellent blog post about EMA sampling that I highly recommend reading. He uses a great analogy: think of the EMA sampler as a boat on the ocean. If your adjustment interval is too short relative to the natural variations in your traffic, the sampler will bob up and down with every wave, constantly changing sample rates and never achieving stability. But if the interval is long enough, the sampler can average out those variations and maintain steady, predictable sample rates.
The key insight is this: your AdjustmentInterval needs to be long enough that you see most of your keys in each interval. If the keys are significantly different between intervals, the sampler can't make accurate predictions and will oscillate unpredictably.
Measuring key cardinality over time
To tune your AdjustmentInterval properly, you need to understand how your key cardinality changes over time. Set up your Refinery to send metrics to Honeycomb (see the config section above), and then execute this query in your Refinery Metrics dataset: COUNT_DISTINCT(meta.refinery.sample_key).
Now here's the important part: look at this query over different time ranges using the Granularity setting in the time range dropdown. Compare the cardinality at:
- 15 seconds
- 30 seconds
- 60 seconds
- 5 minutes
If you see something like this:
- 15 seconds: 100 unique keys
- 30 seconds: 150 unique keys
- 60 seconds: 200 unique keys
- 5 minutes: 200 unique keys
Then you know your AdjustmentInterval should be at least 60 seconds. After that point, cardinality flattens out, meaning you're seeing the full set of keys that actually exist in your traffic patterns.
If you set your interval to 15 seconds in this example, you'd only see 100 keys per interval, but 200 keys actually exist over a minute. This means consecutive intervals would have different key sets, making it impossible for the EMA to stabilize and predict accurately.
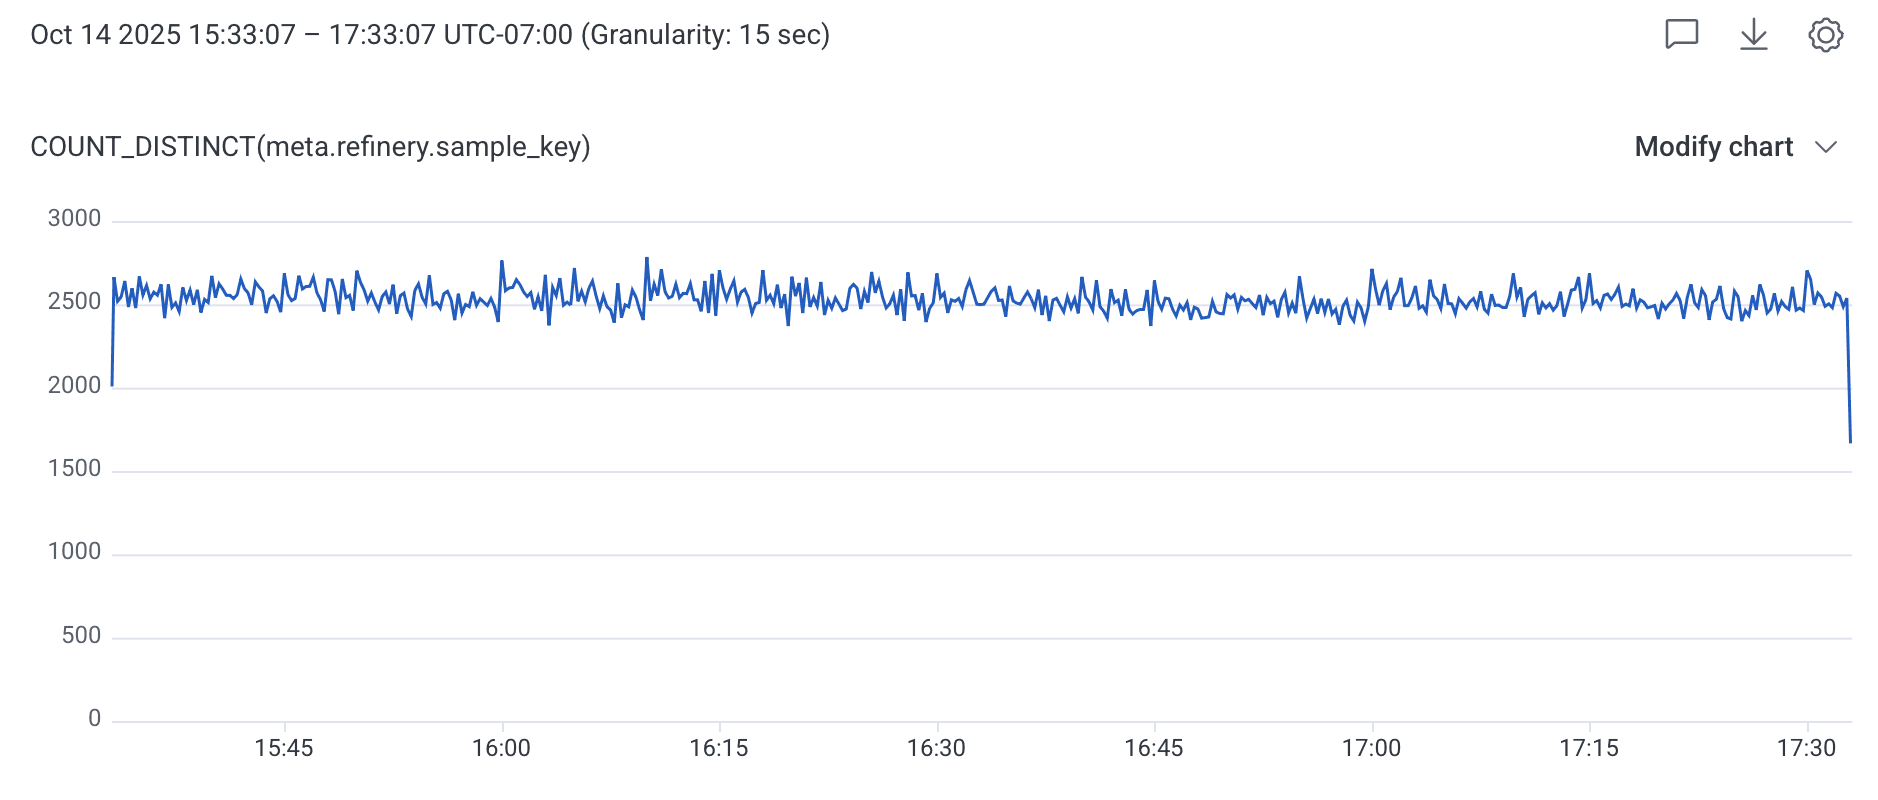
When cardinality never levels off
But what if your cardinality looks like this instead?
- 15 seconds: 2500 unique keys
- 1 minute: 3750 unique keys
- 5 minutes: 4700 unique keys
- 15 minutes: 5100 unique keys
- 30 minutes: 5300 unique keys
This is a fundamentally different problem: your FieldList has too much cardinality. No amount of AdjustmentInterval tuning will fix this. EMADynamicSampler has a default MaxKeys of 500, and even if you increase it, dynamic samplers struggle beyond 1000 keys. With 5000+ keys that keep growing, you're asking the sampler to do something it fundamentally cannot do.
Configuring EMA samplers properly
Here's what a well-tuned EMA sampler configuration looks like in Refinery 3.0:
Samplers:
  production:
    EMADynamicSampler:
      # Target average sample rate across all keys
      GoalSampleRate: 20
      # How often to recalculate sample rates (tune based on cardinality analysis)
      AdjustmentInterval: 60s
      # Fields used to distinguish interesting vs boring traffic
      FieldList:
        - root.request.method
        - root.http.route  # Use http.route (templated) not http.target (raw URL)
- root.response.status_codeWhy the root. prefix matters: Without the root. prefix, Refinery collects all unique values for each field across every span in the trace and concatenates them together with bullets (•) to form the sampler key. If your trace has 50 spans with different http.target values, you get all 50 concatenated together, resulting in an unnecessarily unique key that won't match anything else. By using root., you limit the evaluation to just the root span's value, dramatically reducing cardinality and allowing the sampler to group similar traces together effectively.
Also note that http.route is preferable to http.target because the OpenTelemetry semantic conventions require that http.route be templated (e.g., /users/:id instead of /users/12345), which keeps cardinality low and makes your sampler keys meaningful.
Key points for EMA configuration:
AdjustmentInterval: Set this long enough to see most keys (use the cardinality query above)FieldList: Keep your key space small—fewer than 100 unique combinations is ideal, and you should almost never exceed 500. Use root. prefix to reduce cardinality.GoalSampleRate: This is what you're aiming for on average across all your keys
For greater predictability, consider RulesBasedSampler
One of the most difficult aspects of dynamic samplers is that they're not deterministic, meaning you won't know in advance what they'll do. While that's fine in some cases, users have found themselves wanting greater predictability and control. For these cases, we'll ask you to consider the following: What if what you really wanted all along was deterministic tail-based sampling?
Consider the following Refinery rules, which are often good enough for most cases, yet are far more easy to reason about:
Samplers:
  MyEnvironment:
    RulesBasedSampler:
      Rules:
        # Keep all errors for complete observability
        - Name: never sample errors
          SampleRate: 1
          Conditions:
            - Field: http.status_code
              Operator: ">="
              Value: 400
              Datatype: int
            - Field: http.status_code
              Operator: "<="
              Value: 511
              Datatype: int

        # Keep all slow traces to debug performance issues
        - Name: Keep all traces with any slow spans
          SampleRate: 1
          Conditions:
            - Field: duration_ms
              Operator: ">="
              Value: 1000
              Datatype: float

        # Drop noisy healthcheck traffic entirely
        - Name: drop healthy healthchecks
          Drop: true
          Conditions:
            - Field: http.route
              Operator: "="
              Value: "/healthz"

        # Sample high-value customers at a lower rate
        - Name: Keep more information about Enterprise customers
          SampleRate: 10
          Conditions:
            - Field: app.pricing_plan_name
              Operator: "="
              Value: "Enterprise"

        # Default deterministic sampling for everything else
        - Name: Default Rule
SampleRate: 100In this example, we do the following:
- Never sample traces that contain errors or exceed our threshold for duration, because we don't want our Honeycomb triggers and SLOs unduly impacted by sample rate amplification
- Drop all health checks (unless they were errored or slow)
- Apply custom sampling based on our business logic, reducing the sample rate (or perhaps boosting it) for specific customers
- Deterministically sample everything else. Although you could replace this with an
EMADynamicSamplerrule, there are predictability advantages to not doing so. And sometimes, predictability matters more when you're planning—or in the middle of an incident.
Sampling is powerful, but it’s not magic 🪄
Tail sampling gives you the ability to sample traces while retaining the context for interesting transactions. This hinges on some assumptions about the shape of the data coming to Honeycomb. To get the right balance of meaningful content while reducing lower-quality volume, it takes some review and refinement.
Keep in mind that what is important to your teams will change over time. And as the software changes, the sampling rules will need to change their shape to match. This process of refinement is important to revisit occasionally and share with developer stakeholders so we can all improve our shared understanding of the system.
In case you got here from Google and aren’t a Honeycomb user yet, I’ll leave you with an invitation to try our very useful and generous free tier today.
See you soon,
Irving

Want to know more?
Talk to our team to arrange a custom demo or for help finding the right plan.