Understanding Distributed Tracing with a Message Bus
So you’re used to debugging systems using a distributed trace, but your system is about to introduce a message queue—and that will work the same… right? Unfortunately, in a lot of implementations, this isn’t the case. In this post, we’ll talk about trace propagation (manual and OpenTelemetry), W3C tracing, and also where a trace might start and finish.

By: Martin Thwaites
So you’re used to debugging systems using a distributed trace, but your system is about to introduce a message queue—and that will work the same… right? Unfortunately, in a lot of implementations, this isn’t the case. In this post, we’ll talk about trace propagation (manual and OpenTelemetry), W3C tracing, and also where a trace might start and finish.
How is a queue different?
In the context of a system that takes a web request, we have a well-defined context of a user “action.” This is normally analogous to a trace. If I hit an API endpoint, everything that happens between I hit the endpoint and when it returns my result is part of that trace. However, in a system that does asynchronous queues, that might not be the case.
Mapping a user action to a specific scope in an event-driven system that uses messaging as a communication could be both complex and lengthy.
Some things to consider:
- Does the processing of the message have a bearing on the user’s response?
- Is the processing of the message what the user requested, or is it a side effect?
- Was the action that created the message within a context that makes sense as the trace?
Some examples:
- Sending an email. When the user hits the API, you add a message to the queue. Another process then processes the queue to send the email.
- At the end of every day, you need to do reconciliation on all customer accounts. When the process runs every night, a single message is added to the queue per customer. A process picks up each message.
- After every customer purchase, you need to update the loyalty system. Once all transactions are complete and the user has been notified, a message is sent to the publish/subscribe queue. The loyalty system picks up the message and updates the system.
In each of the above scenarios, we could architect our trace in multiple ways to allow viewing the information in different ways.
Span Link vs. Ancestry
OpenTelemetry provides two separate ways to associate spans together. We’ll consider each to understand where they might be useful.
What is a child span?
The default operation when creating a new span in OpenTelemetry is to attach the new span to the currently active span as a child.
This shows that the new span was created within the previous span’s context of operation.
What is a span link?
OpenTelemetry defines another relationship of spans called links. When a span is created, you’re able to provide a list of other spans that are linked to the new one you’ve created. This doesn’t replace the parent/child relationship, as it can be done in addition to that relation.
Links can also have attributes associated with them in the same way as a span can, which allows your backend tooling to treat them in different ways. As of the writing of this post, there are no conventions defined for well-known attributes.
Propagation
Propagation is the concept of taking the trace and span information from one system and attaching it to the trace and span information in a consuming (or child) system.
In the context of our messaging use case, it’s the idea of how we can get our consuming system to know the TraceId and SpanId of the process that generated the messages we’re consuming.
There are two parts to a trace context that need to be propagated:
- TraceId: Correlation or group that the span is related to
- SpanId: Unique identifier for the active span for process sending the message
With these bits of information we can attach, or link, our new span to an existing one.
Example with Azure Service Bus
Most messaging systems have the concept of metadata that can be passed or stamped on the message. For this example, we’ll be using Azure Service Bus, and specifically, the .NET SDK provided by the Azure team.
Let’s set this up. We’ll need a client, and then we’ll need to create our sender service.
ServiceBusClient client = new ServiceBusClient(
configuration["ServiceBus:ConnectionString"],
new ServiceBusClientOptions()
{
TransportType = ServiceBusTransportType.AmqpWebSockets
});
var sender = client.CreateSender("main");This will create a connection to Service Bus, and create a sender for the main queue.
Now that we have a sender, we can send a batch of messages to the queue.
using ServiceBusMessageBatch messageBatch = await _sender.CreateMessageBatchAsync();
var message = new ServiceBusMessage($"Traced Message");
messageBatch.TryAddMessage(message);
await sender.SendMessagesAsync(messageBatch);Then, we can create a processor that receives the messages and prints the text to the console.
var processor = client.CreateProcessor("main");
processor.ProcessMessageAsync += async (args) => {
   Console.WriteLine($"Message: {args.Message.Body}");
};
await processor.StartProcessingAsync();These are the basics of sending a message. Unfortunately, it doesn’t add any tracing information to our messages automatically, so our processor cannot use this to associate the spans and traces together.
However, we can inject the properties using headers like this:
message.ApplicationProperties.TryAdd("trace-id", Activity.Current?.TraceId.ToString());
message.ApplicationProperties.TryAdd("span-id", Activity.Current?.SpanId.ToString());This then allows us to build an ActivityContext within the processor. The ActivityContext object is what we can use to create the new Activity “within” or “linked” to the original context.
args.Message.ApplicationProperties.TryGetValue("trace-id", out var traceId);
args.Message.ApplicationProperties.TryGetValue("span-id", out var spanId);
var senderActivityContext = new ActivityContext(
ActivityTraceId.CreateFromString(traceId?.ToString()),
ActivitySpanId.CreateFromString(spanId?.ToString()),
ActivityTraceFlags.None
);
using var currentActivity = ActivityConfig.Source.StartActivity(
"Consume Message", ActivityKind.Consumer,
senderActivityContext
);What we’ve done here is extract the values from the headers and use those to create the ActivityContext which we then added to our method for starting a new activity. We also provided an ActivityTraceFlags setting. This is a value that can be passed between systems that lets the child system know that the parent trace/span was recorded and not sampled.
Although this doesn’t map exactly to the W3C TraceContext spec, the concept is the same.
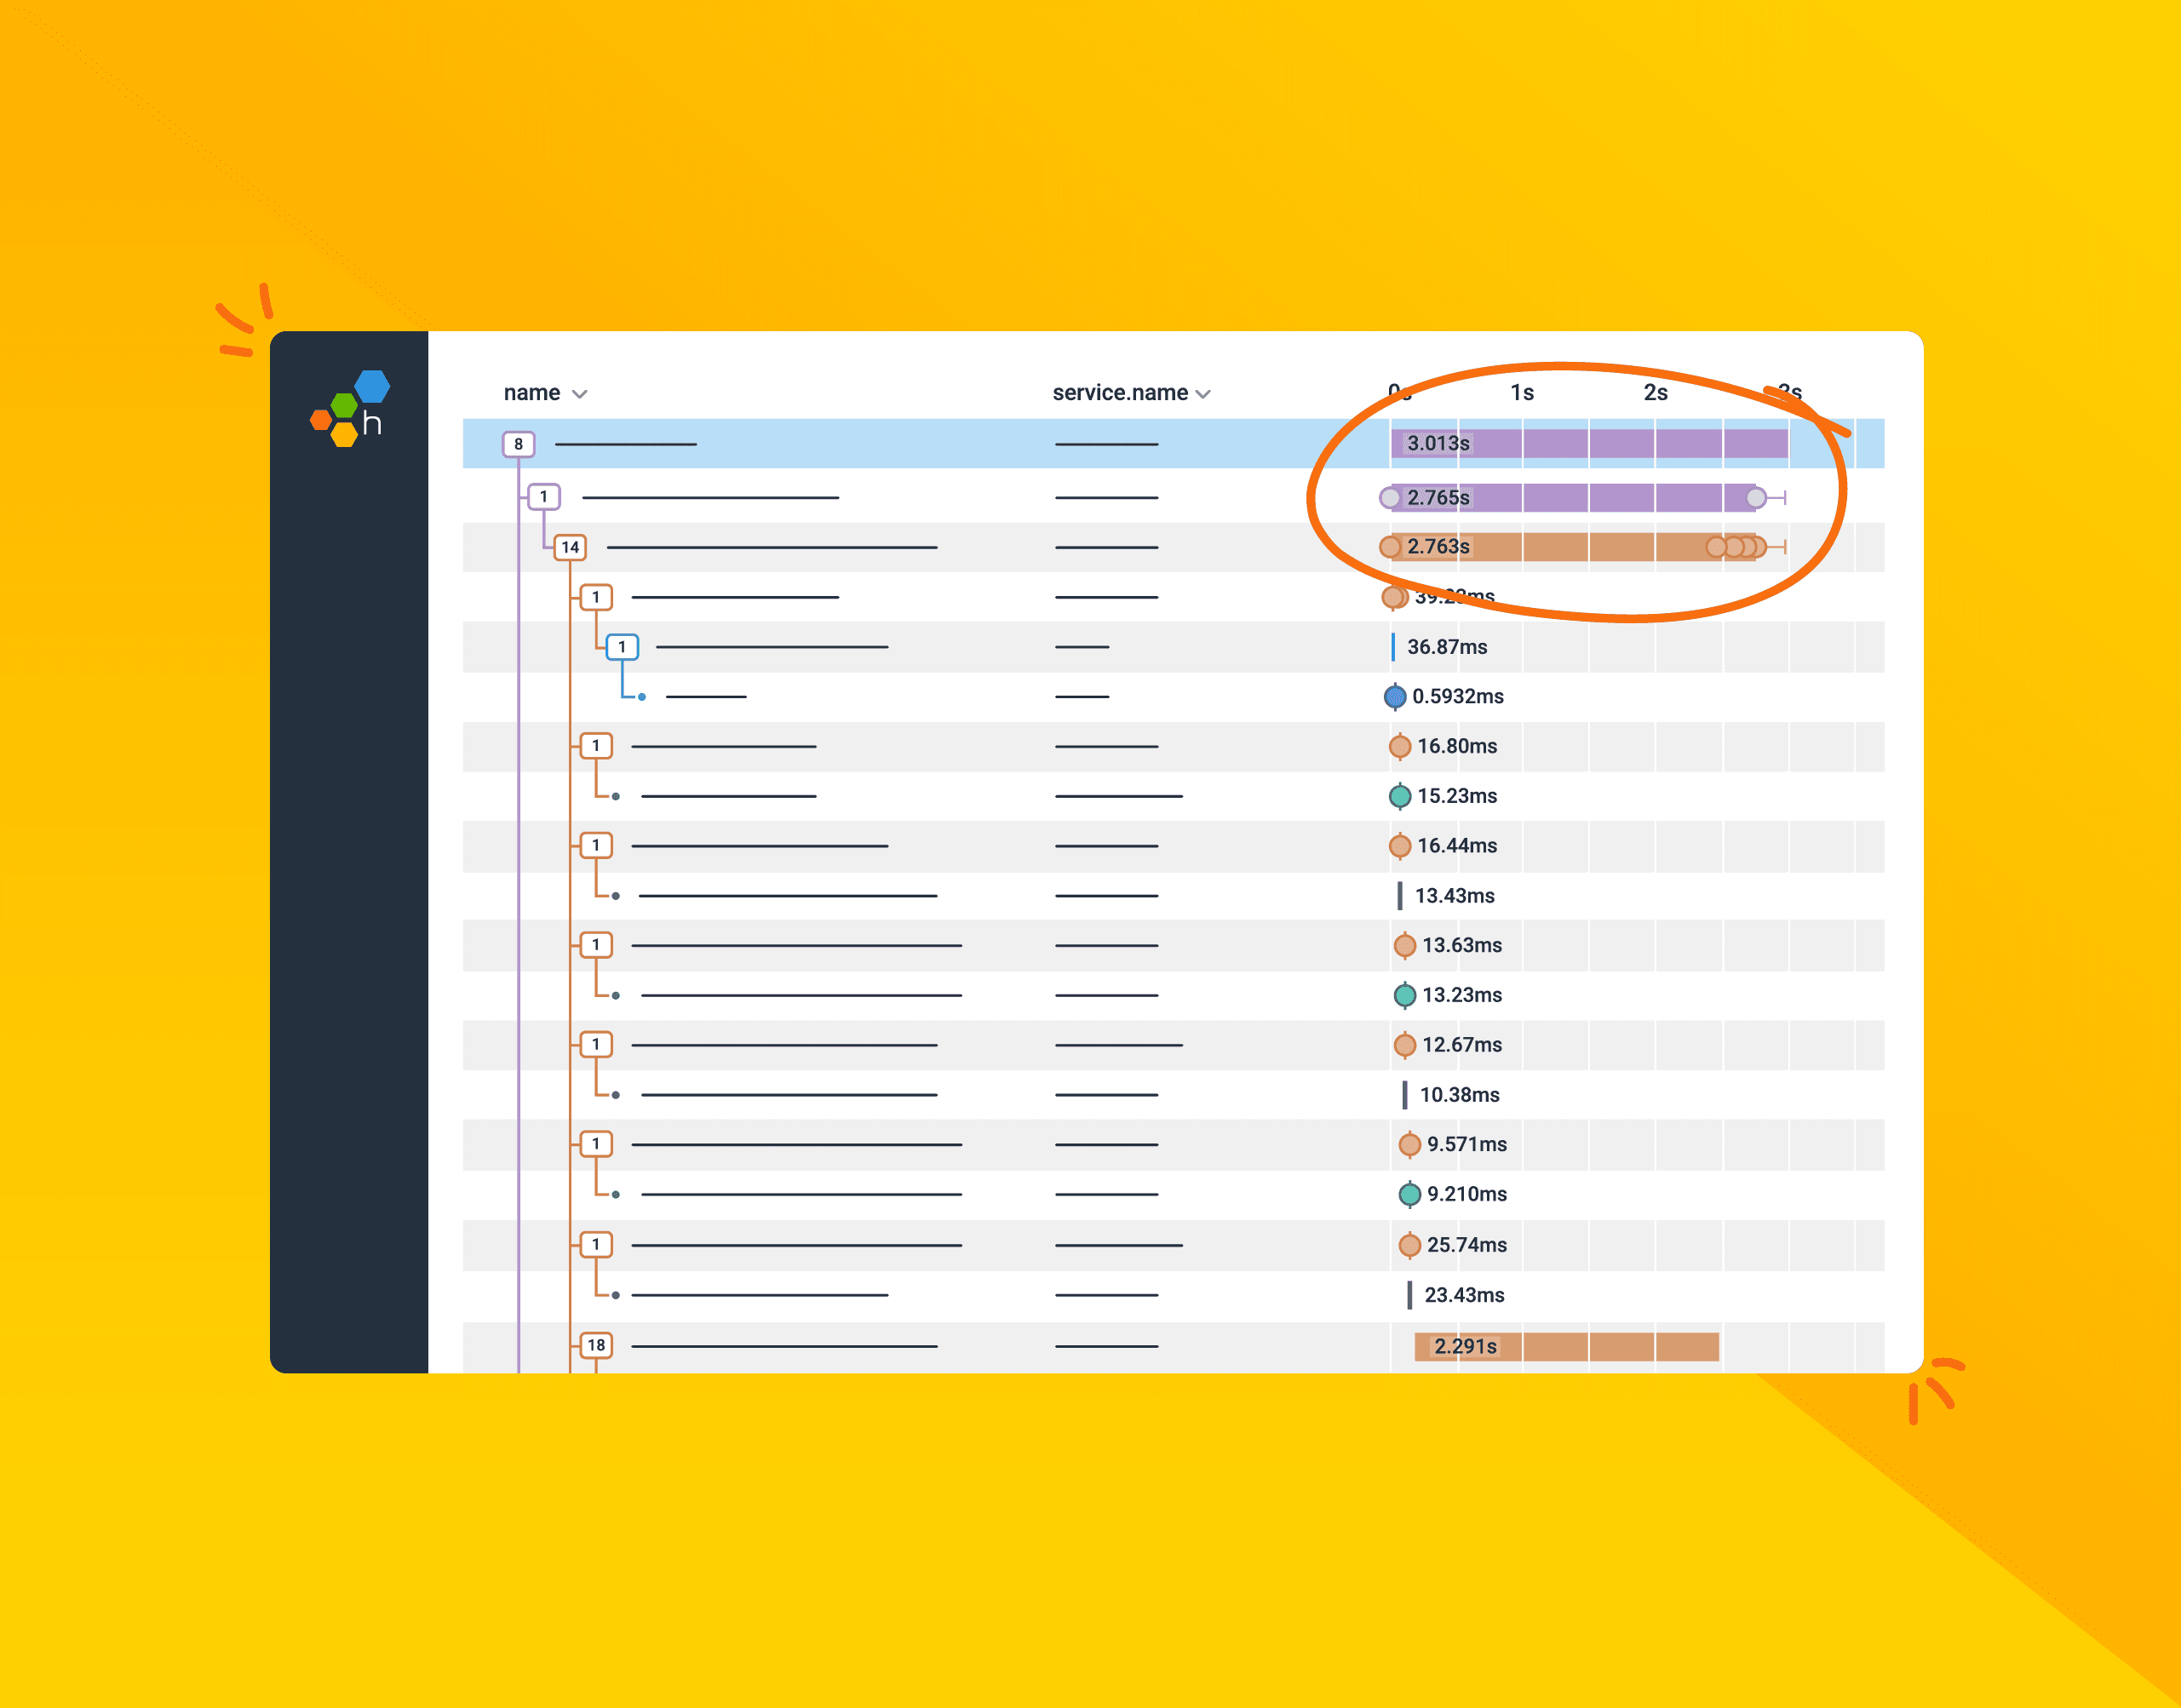
This code will create the new Activity as a child of the Activity that was created in our sender code. The resulting trace looks something like this:
This is a useful analysis as we can see all actions that happened due to our sender creating messages. However, sometimes this isn’t a great visual and it can make debugging the live system hard, which is the reason we create traces in the first place.
If we have a system where there are hundreds of services listening to that message in order to perform an action, that might not prove to be a useful visualization. This is where linking could be more useful.
A SpanLink will help maintain a relationship between those two actions. It allows a new root span to be created, and for there to be a new trace.
OpenTelemetry propagation APIs
Now that you’ve seen how easy it is to do propagation, you may think about what names to use, and how to make this work against multiple SDKs—and more interestingly, across different applications and languages.
This is where the OpenTelemetry propagation APIs come in handy. They provide a standard means to parse lists of attributes (e.g., HTTP headers or message properties) and provide a context to our libraries that create spans.
In our example above, we’re using Azure Service Bus, which gives us a dictionary of attributes called ApplicationProperties. We can pass these to the propagators.
Propagators.DefaultTextMapPropagator.Inject(
   new PropagationContext(Activity.Current?.Context ?? default, Baggage.Current),
   message,
  (message, key, value) => {
       message.ApplicationProperties[key] = value;
  }
);In this code, we’re passing the current ActivityContext that contains the TraceId and SpanId, the baggage contents, and a delegate that allows us to tell the propagator how to set properties on the message. Internally, this is going to set various properties with known names. Conversely, as these properties have known names, extract them in our consumer too.
var context = Propagators.DefaultTextMapPropagator.Extract(
new PropagationContext(new ActivityContext(), Baggage.Current),
message.ApplicationProperties,
(properties, key) => {
var valueFromProps = properties.TryGetValue(key, out var propertyValue)
? propertyValue?.ToString() ?? ""
: "";
return new List<string> { valueFromProps };
});In this code, we’re doing something very similar. We’re providing a PropagationContext to the propagator for it to set the values on. This includes a new ActivityContext and the current baggage object. Similar to the way we inject the properties, we pass a delegate that takes our list of properties on the message, and also the key name to extract.
We can then use the ActivityContext property of the PropagationContext to create our Activity in the same way as we did in the parentage example.
var parentSpanLink = new List<ActivityLink> {
new ActivityLink(context.ActivityContext)
};
using var activity = ActivityConfig.Source
.StartActivity("Consume Message",
ActivityKind.Consumer, default(ActivityContext),
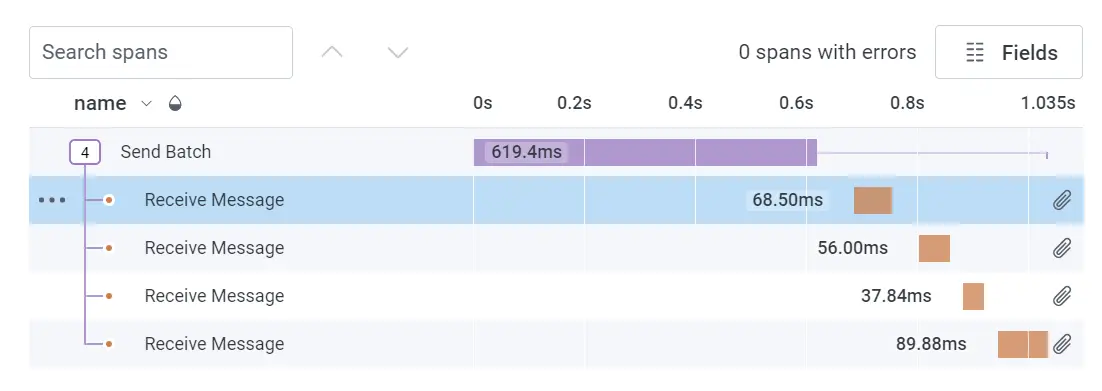
Links: parentSpanLink);With this code, we now get a new root span that has a SpanLink to the sender span and trace.

Conclusion
Designing your debug experience is more art than science. There are many ways that you can design the experience when it comes to messaging, specifically as there are different dynamics at play (like synchronous vs. asynchronous) and the different relationships involved.
Spend time thinking about how your users (developers who debug the system) will want to navigate the information and design for that.
SpanLinks are available in Honeycomb now, and you can try them out on our free tier.
Want to know more?
Talk to our team to arrange a custom demo or for help finding the right plan.