Visualizing Session Flow With Honeycomb
I want to know what users are doing in my application. A distributed trace is the best way to show the data flow of one user interaction through my application, but it isn’t sufficient to show the overall user experience.

By: Ken Rimple

It’s 2025, The Frontend Deserves Observability Too
Learn MoreI want to know what users are doing in my application. A distributed trace is the best way to show the data flow of one user interaction through my application, but it isn’t sufficient to show the overall user experience.
Traces don’t tell the whole story on their own
As helpful as traces are, they detail an isolated series of moments related to a specific activity. But they don’t link to related activities, unless you instrument with span links, and navigating between them can become complex.
Some interactions are hard to visualize this way; they are just spread out across too many traces. Consider frontend applications: it’s usually impossible to find a trace that includes everything from a click, all the way back to a backend response, because user events only live for the period of time of the click itself.
By the time the click is over, that top-level span ends. The trace context is lost in the haze of “Reactium” before the browser issues the fetch, which starts a new trace.
You can consider frontend interactions as a timeline of traces. Each trace has a specific set of spans attached to the initiating event. Some can be quick, such as a click to show a preloaded view from the React Router. Even shorter traces are single events, such as readings generated by Honeycomb’s Core Web Vitals instrumentation. But longer ones, such as a checkout POST, may trigger a cascade of calls from service to service, propagating the tracecontext.
Here’s a crude example:
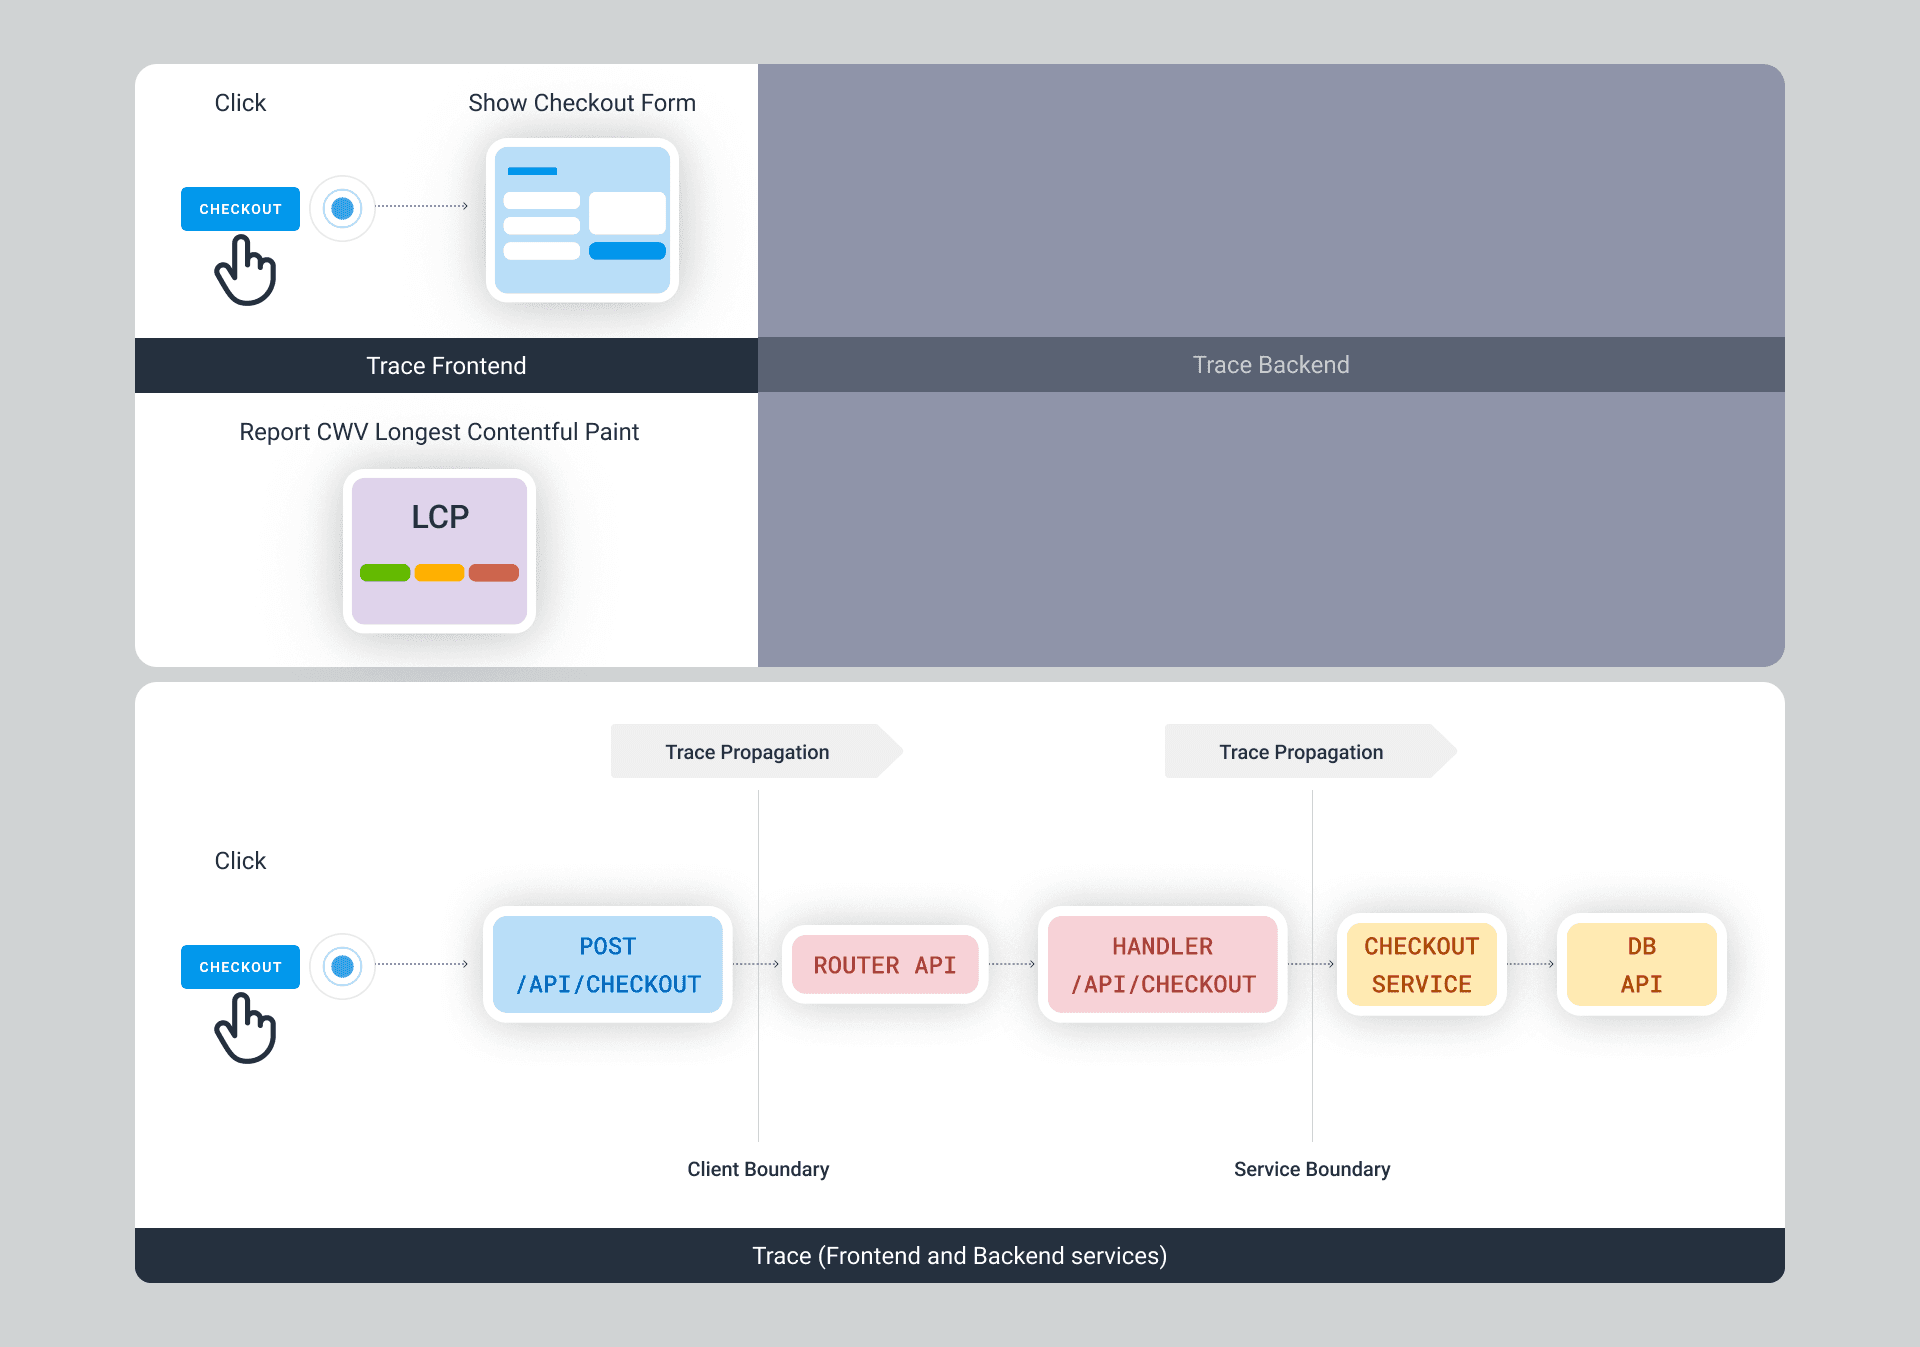
Where:
- In the first trace, the click event is attached to a navigational link. If we instrument our routing API, such as in this React Router span processor example, we’ll see routes identified in the trace as well.
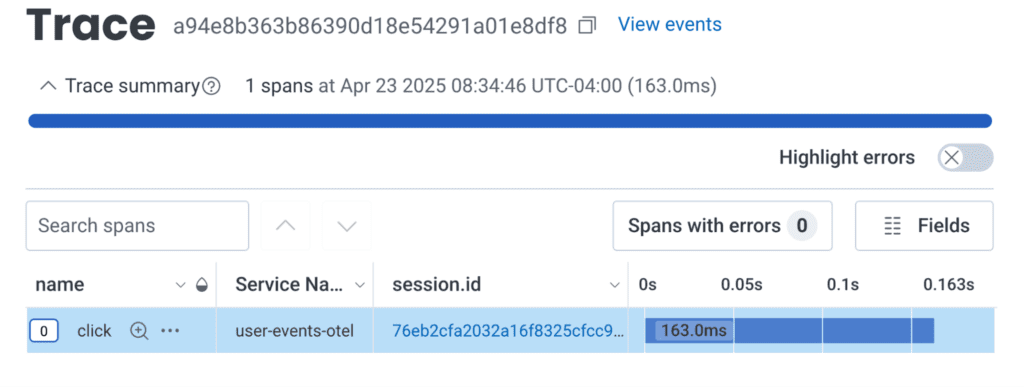
- The second trace is even shorter. Honeycomb’s Core Web Vitals instrumentation relies on the Google Chrome Web Vitals library and emits single-span traces for each browser session.
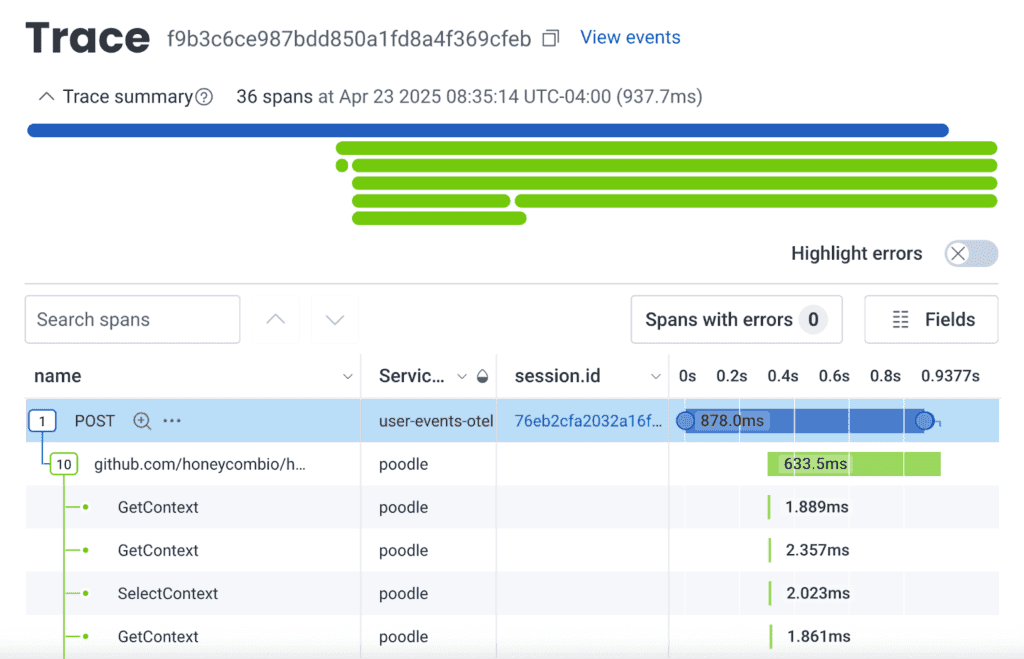
- The third trace is a full-stack example. A click on a form (in this case, part of the same trace) generates a fetch call to POST the checkout form data, and because of trace propagation, the receiving server gets the traceparent header with the relevant trace.trace_id, caller’s trace.span_id, and flags.
Each individual event results in a trace, but it’s the big picture of many traces over time that tells the tale. We need a way to tie a collection of these individual users’ traces together to visualize the journey.
How do we relate traces together like this in OpenTelemetry?
The concept of a “session” is essential when looking at longer-running interactions, like user interface interactions from a given user, which is defined in the OpenTelemetry Semantic Conventions specification. It states:
[…]a Session is represented as a collection of Logs, Events, and Spans emitted by the Client Application throughout the Session’s duration. Each Session is assigned a unique identifier, which is included as an attribute in the Logs, Events, and Spans generated during the Session’s lifecycle.
OpenTelemetry Semantic Conventions on Session.ID
Last year, we released our web observability OpenTelemetry Wrapper SDK, which makes it easy to configure your web applications to send telemetry and participate in full-stack traces. We’ve been including an automatically generated session.id attribute, which is defined by a UUID we generated when starting the SDK. We’ve also recently added support for generating your own session.id attribute.
You can find out about your user sessions by filtering or grouping by them in our query tool. For example, how many mobile browser sessions do we have, and with what browser type?
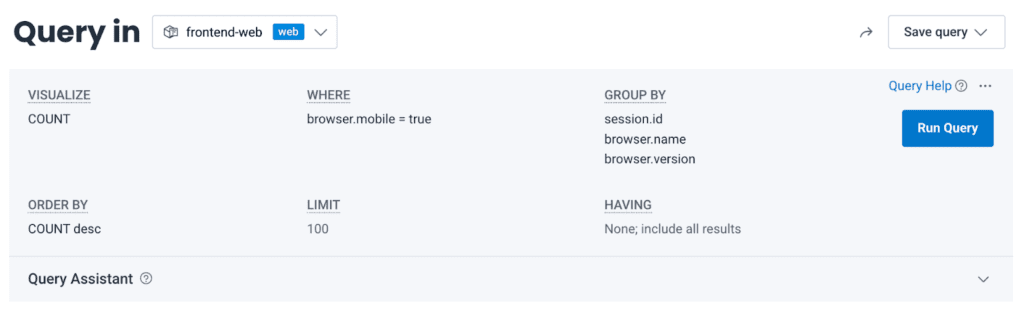
Here is recent traffic, on mobile safari, for my phone:
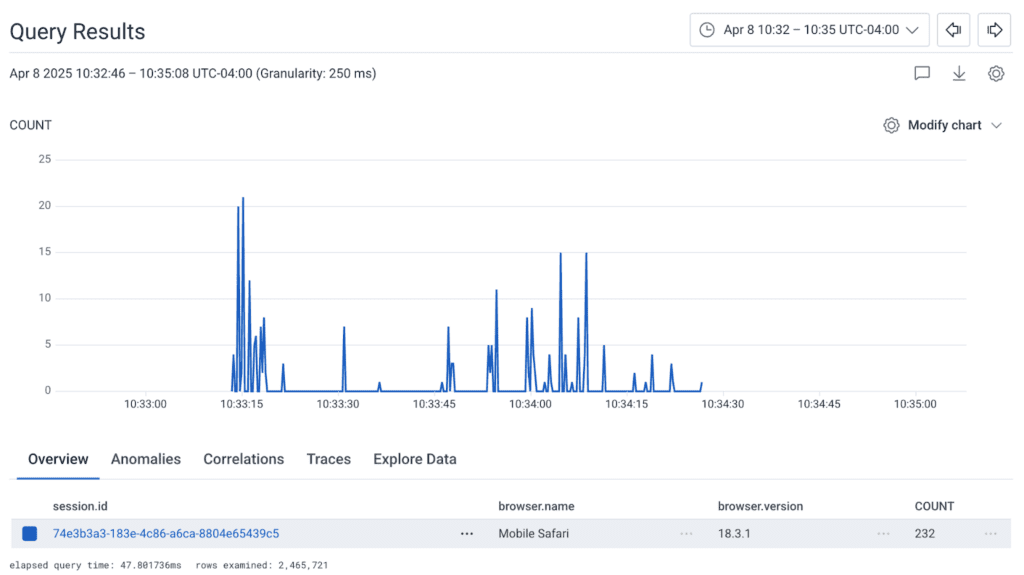
I can take that session.id field and use it in another query:
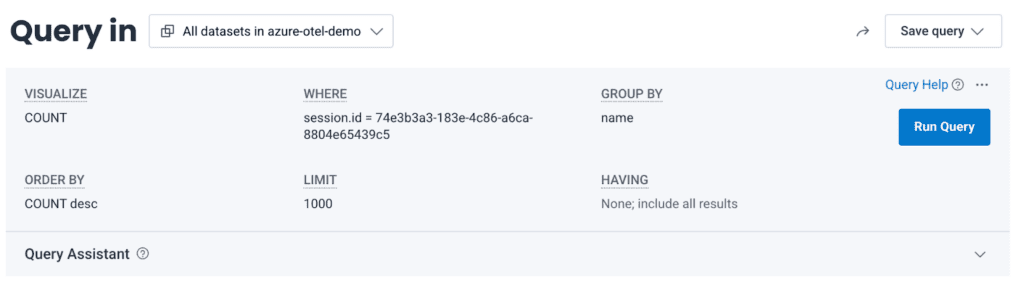
This will give me a breakdown of my spans for the session:
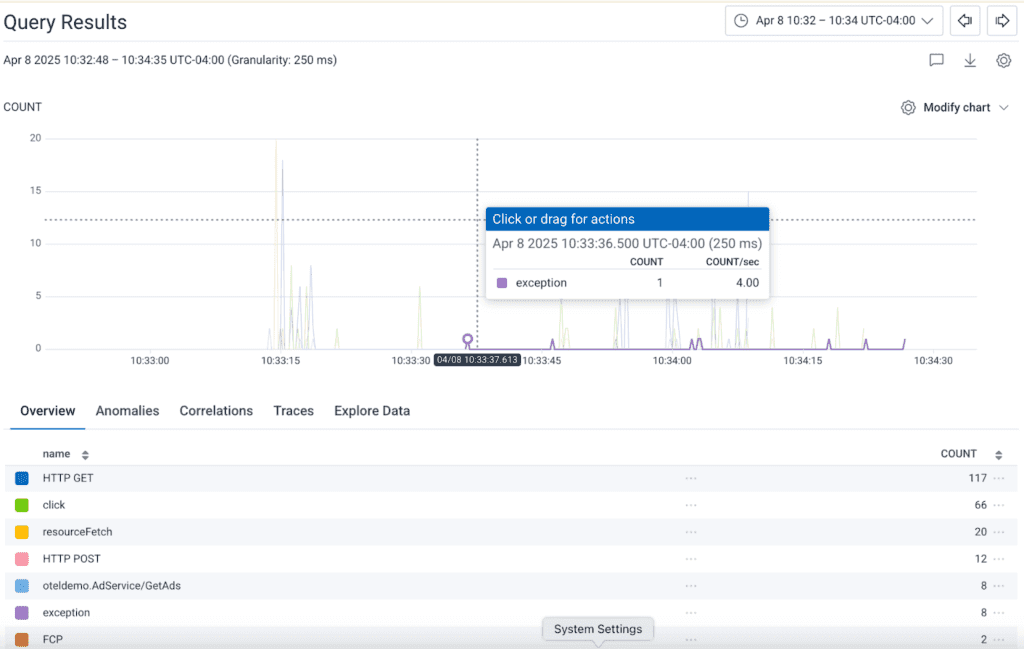
But that’s a lot of graphing, and though I can see the number of spans (or filter down to specific types, visualize durations, etc.), I don’t see the user interactions in terms of traces for each event.
In fact, if I pick the Traces tab, I only see the slowest traces:
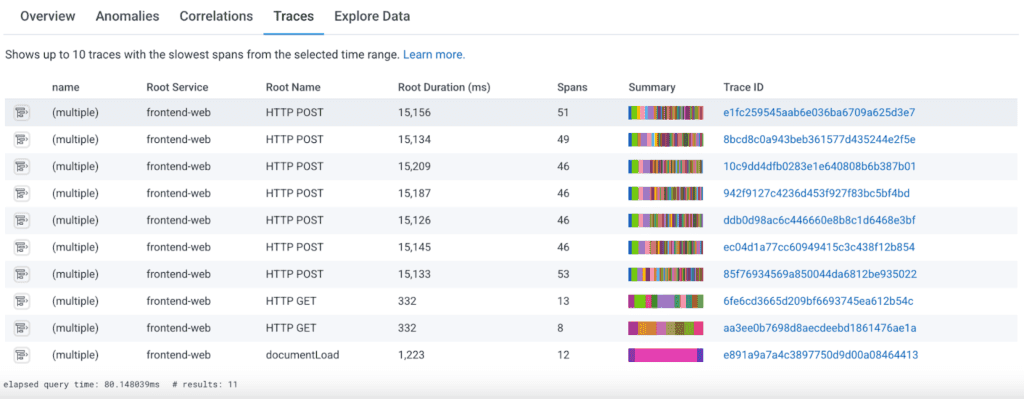
So, what can I do?
Explore your data by time to see an event timeline
To visualize the actual stream of events in order, you can use the Explore Data tab, ordering it by Timestamp from oldest to newest. Be aware that you are limited to displaying a maximum of 250 rows at a time, and can export a maximum of 1,000 rows at a time. However, with this table—and using tweaks to the WHERE clause—you can get down to everything you need:
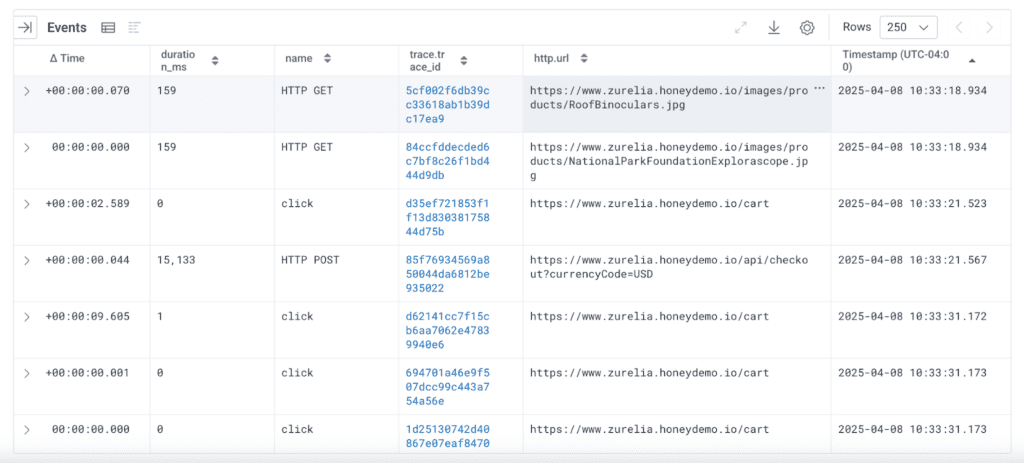
I’ve included the trace.id field in my explore data fields, as well as “∆ Time,” which is the elapsed time between each displayed event. To get this to work, I’ve sorted the table by the Timestamp field (you can’t sort by ∆ Time) in ascending order. This will give us a rough idea of the time sequence for visualizing the data.
Useful things to skip in your query
As always, you can just add conditions to your WHERE clause to filter out data you don’t want to include:
- Skip Core Web Vitals information with library.name != @honeycombio/core-web-vitals if it isn’t important to your investigation.
- Skip page and resource fetch operations with name does-not-contain document if you’re focusing on post-pageload interactions.
You can also filter out items you don’t want interactively, clicking on the field of interest and choosing to focus on or exclude it. Here’s a demo:
Using session flow in investigations
Using our demonstration “telescope shop” application, here’s an example investigation:
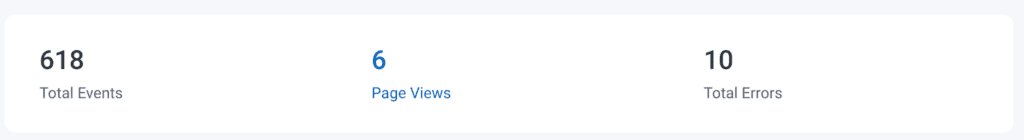
We pay close attention to our purchasing flow, looking for issues so we can correct them before our users start reporting errors. I checked the frontend dataset’s Web Launchpad and found that it reports some errors.
I explored the error events and grabbed the session ID of one of those errors. Switching to Explore Data, I observed the sequence of events: a click on the /cart page led to an HTTP POST to api/checkout, which caused the exception span.
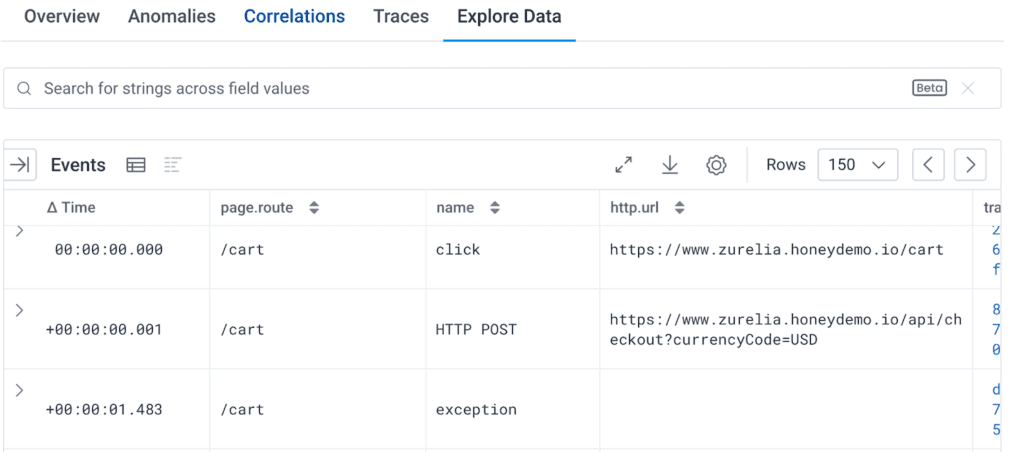
Adding target_element and target_xpath to the event fields shows that we’ve clicked on a button, located in the checkout form (our Place Order button):

To go deeper, I added the trace.trace_id field, then clicked the trace.trace_id of the HTTP POST to view the request. This request results in eight spans marked as errors. Here is the top of that trace:
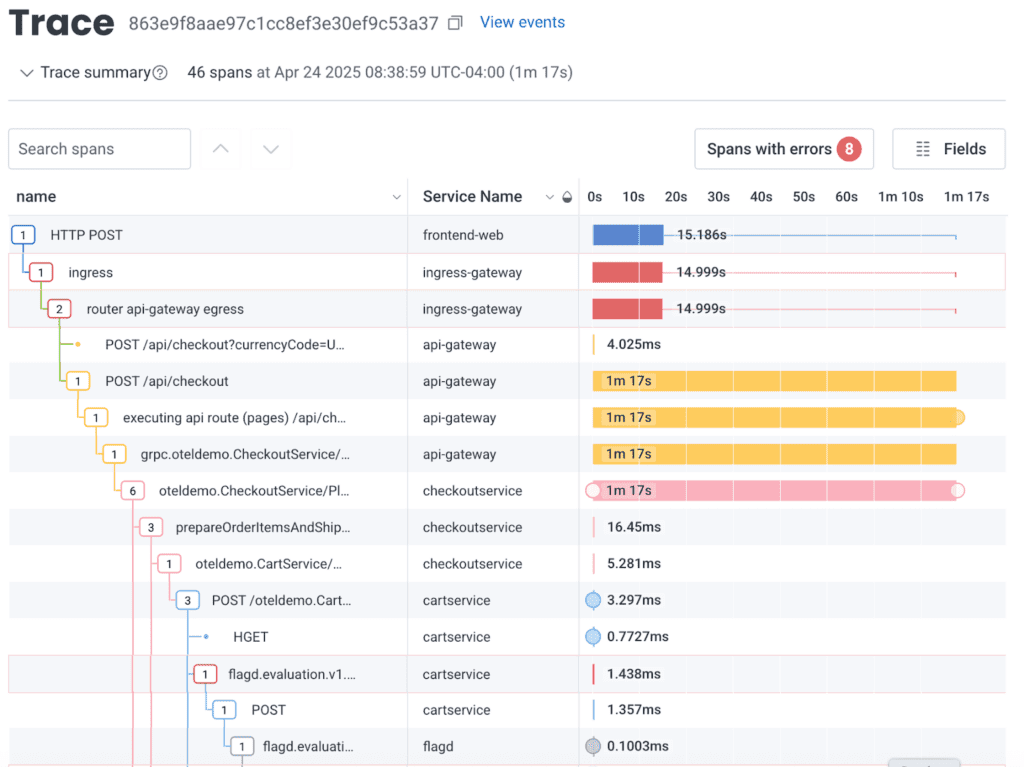
Further down, we see the error: a problem in a Ruby Sinatra script in emailservice. Here’s how we query it:
Now we have the backend service and the line of code that is the root cause of these errors in the client.
The value of a session
Sessions help us understand a user’s flow through a system. We’ve learned how to define a session.id value in our application code, query for sessions, and explore the events in order.
Honeycomb enables session support not only for web frontends but also for our Mobile SDKs, because you should always be able to know what your users are doing with your applications.
Want to know more?
Talk to our team to arrange a custom demo or for help finding the right plan.