Geckoboard Gets the Context They Need to Keep Customers Happy Without Breaking the Bank

By: Varsha Patel

About
Use Geckoboard to build clear, effective data dashboards for your business that keep teams informed, motivated and aligned around your KPIs
Environment
- 60+ third-party API integrations
- Services written in Go
- Classic log management and standalone tracing toolset, Librato
Goals
The team at Geckoboard relies on the performance of over 60 third-party APIs to deliver their custom dashboard service to customers. They built their own system health dashboards using Librato to display high-level throughput, latency, and error rate-type data, and have been using standard log search tools since the time when log search was new and shiny. But as their business has scaled up, so has their need to understand specifically who is affected by a given issue—and although the log search bill was growing, Geckoboard’s growing requirement for breaking down by things like customer ID still wasn’t being met.
When a single customer’s bad experience can skew the entire metric, you need to be able to tell which endpoint or which customer is affected.”
Matt Button
Infrastructure Engineer at Geckoboard
What They Needed
- The ability to dig into exactly who is affected by an issue and how, while continuing to maintain and use their carefully-built system metrics dashboards as a jumping-off point
- Support for iteratively improving their observability practice without having to redefine existing dashboards, metrics, and alerts all at once
Honeycomb @ Geckoboard
Once the team at Geckoboard started using Beelines to send events and traces to Honeycomb, they were hooked. They got immediate value from the automatic instrumentation of context-rich events. Heatmaps in particular were an eye-opener; combined with the automatic outlier detection of BubbleUp, many issues they could never track down before became easy to identify and resolve.
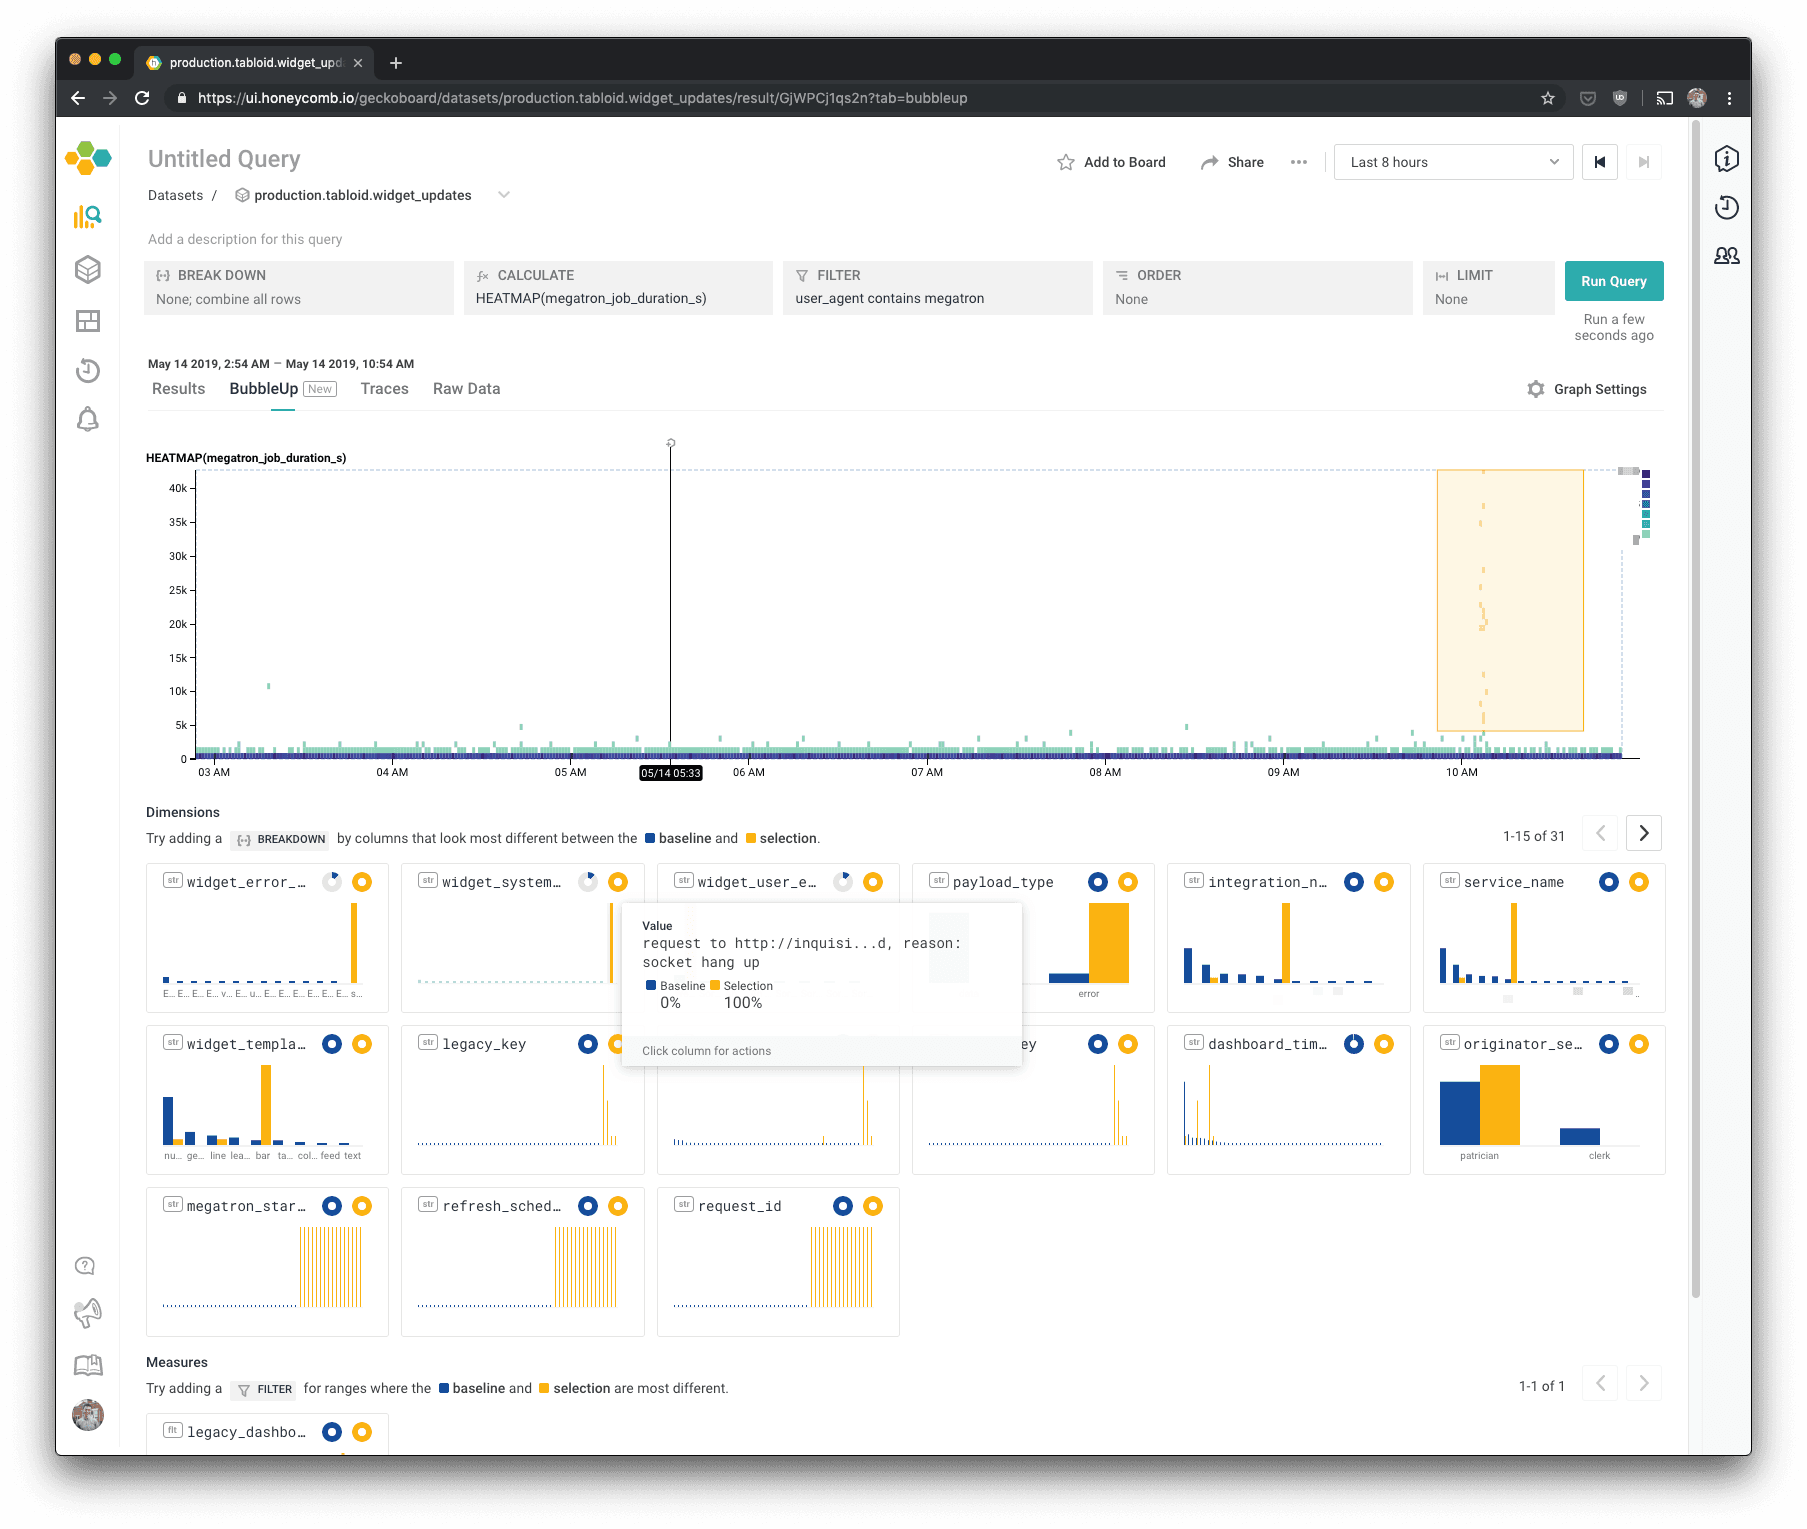
BubbleUp outlier analysis of a heatmap of job durations.
How did we ever work before Honeycomb?
Matt Button
Infrastructure Engineer at Geckoboard
Geckoboard’s engineers were using another vendor to visualize OpenTracing data, but had been frustrated by both the performance and the user experience of finding and clicking on the desired trace. They found Honeycomb’s tracing much easier to navigate and much faster to return results, much like the rest of the Honeycomb UI in comparison to their existing tools.
With old-school log search tools you have a search box to find a needle in a haystack of log lines which is very difficult to make sense of. In contrast Honeycomb gives you neat piles of the right data that’s useful to solving the problem at that moment.
Matt Button
Infrastructure Engineer at Geckoboard
As Geckoboard’s business grows, they are adapting their usage of Honeycomb to continue to keep up. As their engineering team builds new services, those services include instrumentation to send events and traces to Honeycomb. In doing so, they’re able to continue to use their legacy tools to monitor and troubleshoot while they upgrade their overall systems to the next-gen APM experience of Honeycomb.
It’s amazing going from other tools to Honeycomb—the whole process to visualize something is so complex, Honeycomb just shows me the information that is relevant to me immediately. Ridiculously powerful.
Matt Button
Infrastructure Engineer at Geckoboard