Ask Miss O11y: Observability Without Manual Tracing
I think my biggest question is: How do I introduce observability without manually weaving tracing-related code throughout my codebase since that adds a lot of noise? TL;DR: Use auto-instrumentation from OpenTelemetry. Traces will happen….


I think my biggest question is: How do I introduce observability without manually weaving tracing-related code throughout my codebase since that adds a lot of noise?
TL;DR: Use auto-instrumentation from OpenTelemetry. Traces will happen. Then your code can use global library functions to customize those traces with your specific important data.
Manual tracing
Not so long ago, getting traces meant explicitly writing the code to emit spans with context fields attached. That meant passing the trace context down, down, down through all functions that might want to make a span or add data to a span. And you had to explicitly create all the spans you wanted to see. That can look like a lot of clutter.
Here are three functions that produce two manual spans (in JavaScript on Node.js; some abstractions not included). The tracing code is highlighted in orange. Please don’t read this mess! Just notice how much code is orange.
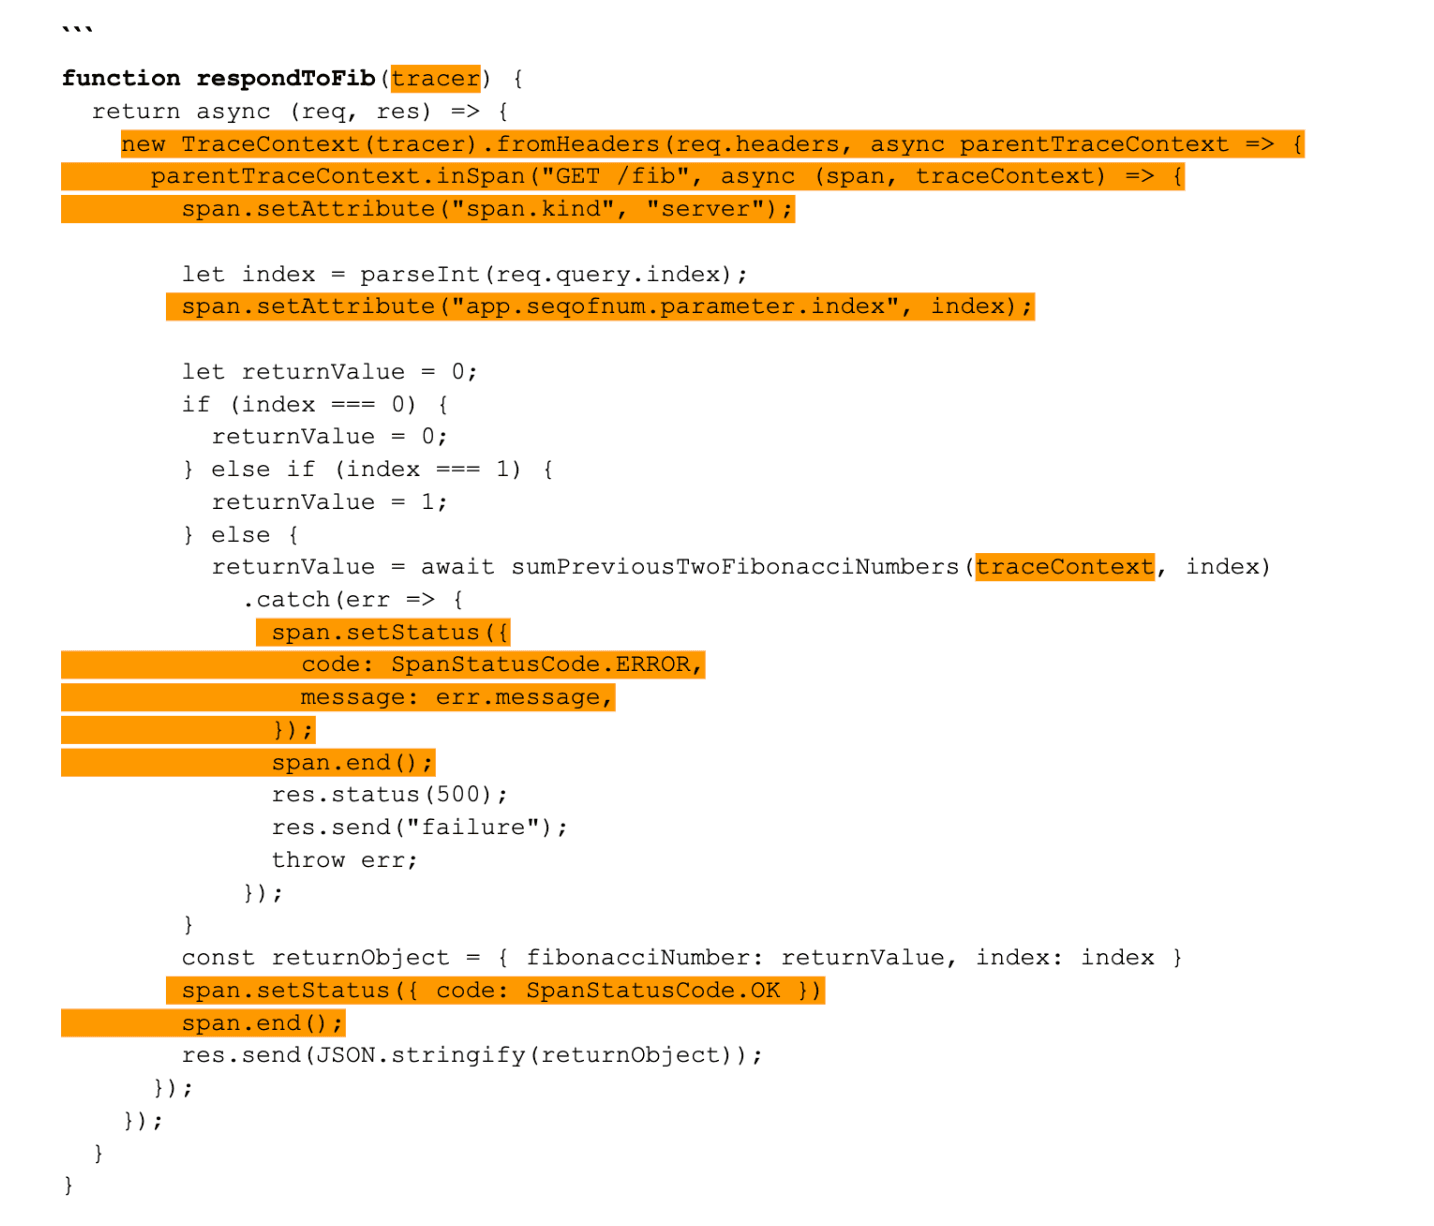
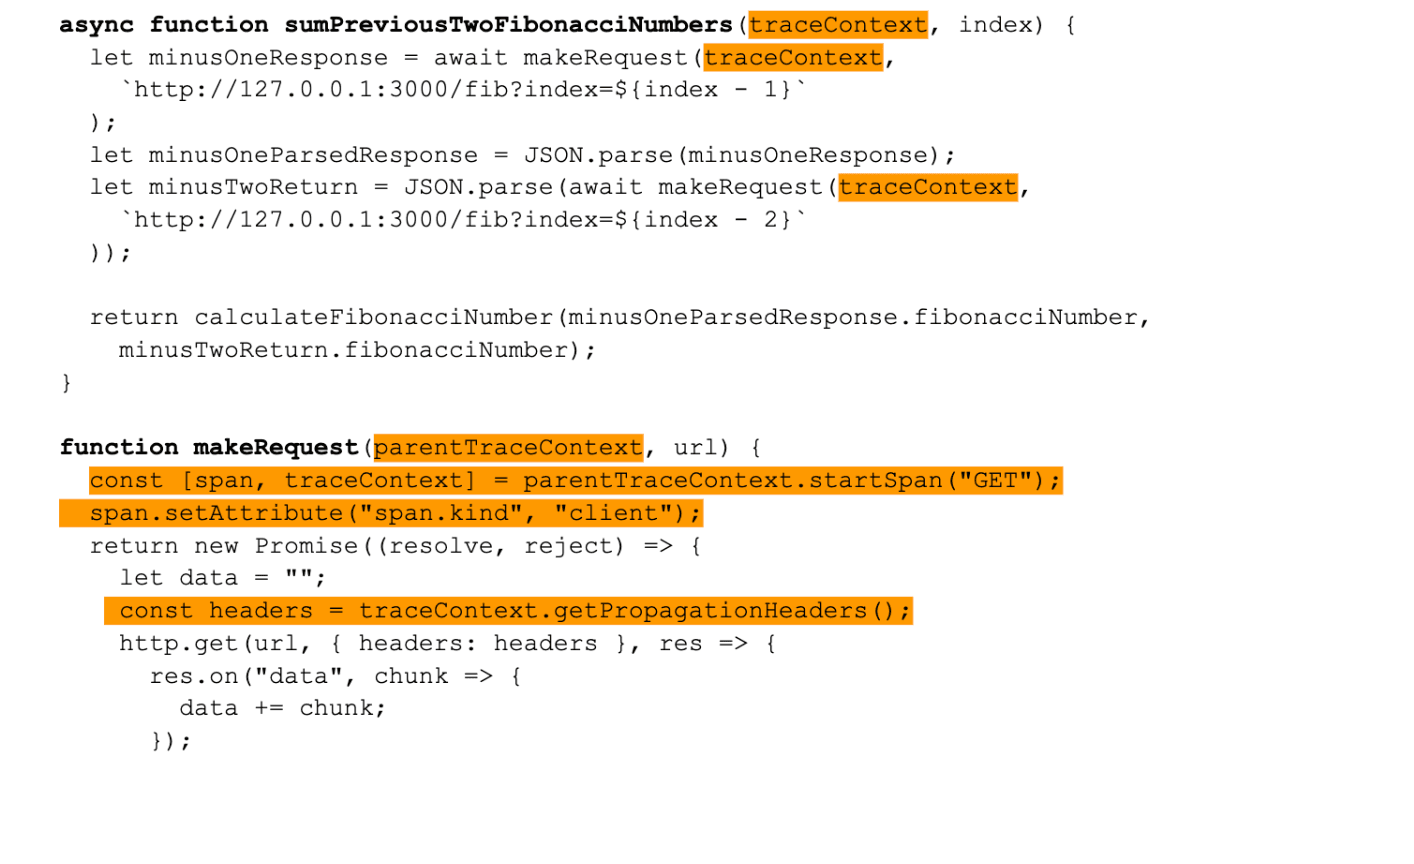
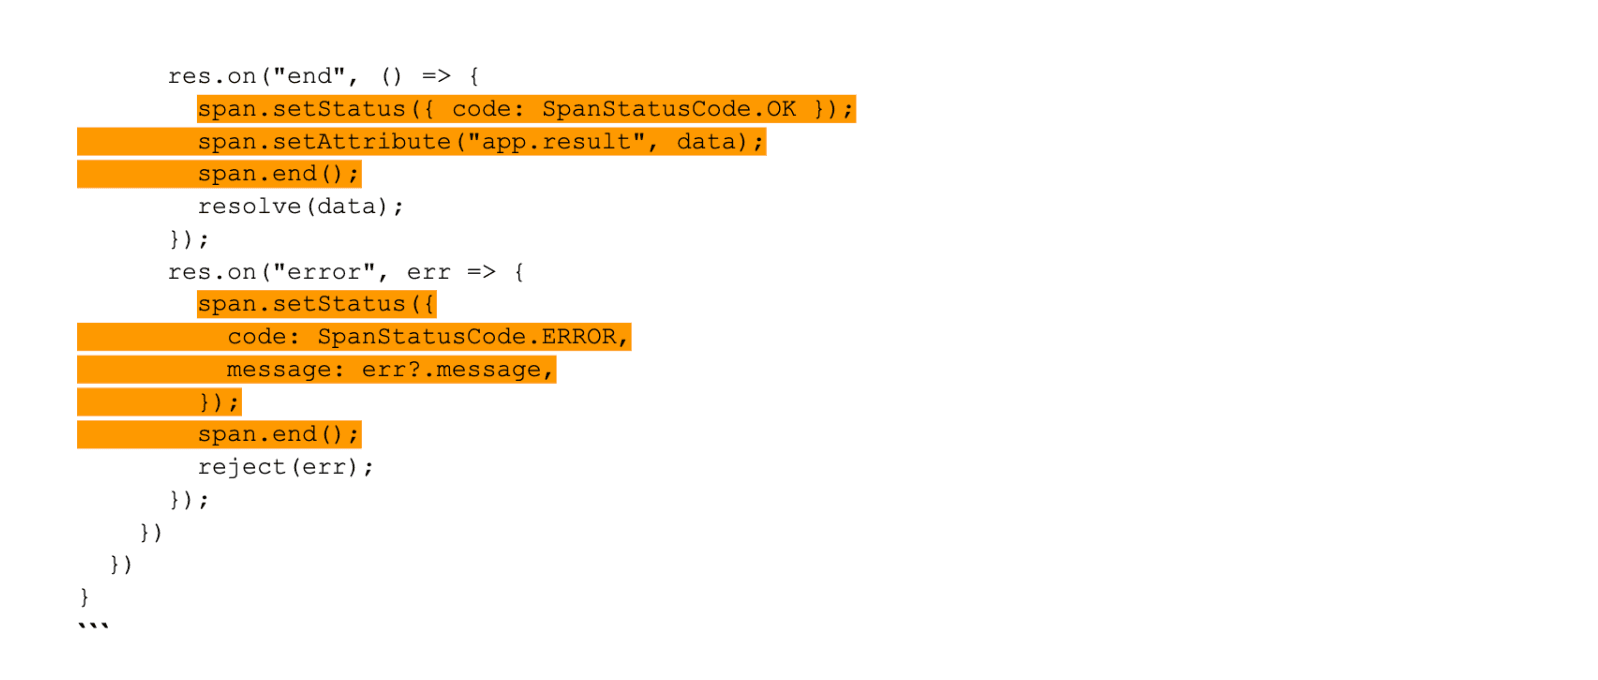
The orange tracing code is scattered all over the place. Parameters passed, spans started, statuses set, spans ended. Even functions that don’t do any tracing (like the middle one) have to pass the context along.
This obscures the real work of the functions. Observability is supposed to make it easier to see what’s happening in our code, but this makes it harder!
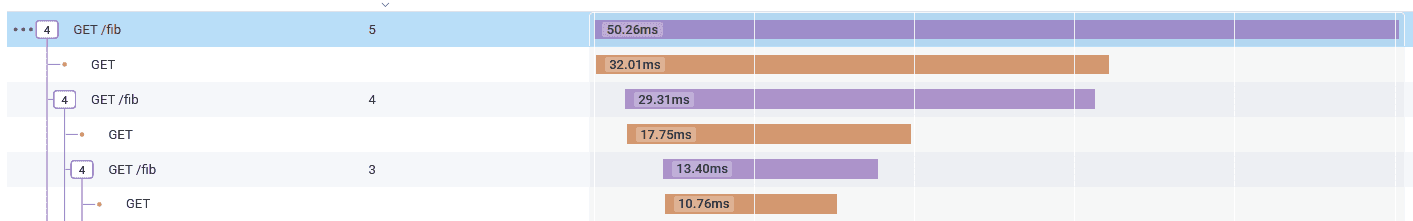
This code creates distributed tracing that looks like this. Each incoming and outgoing request gets a span.
Auto-instrumentation
Fortunately, the days of light are upon us. For applications that use standard web frameworks, all this instrumentation can be magicked in with OpenTelemetry auto-instrumentation.
Here’s what that same code looks like using auto-instrumentation for `http` and Express:
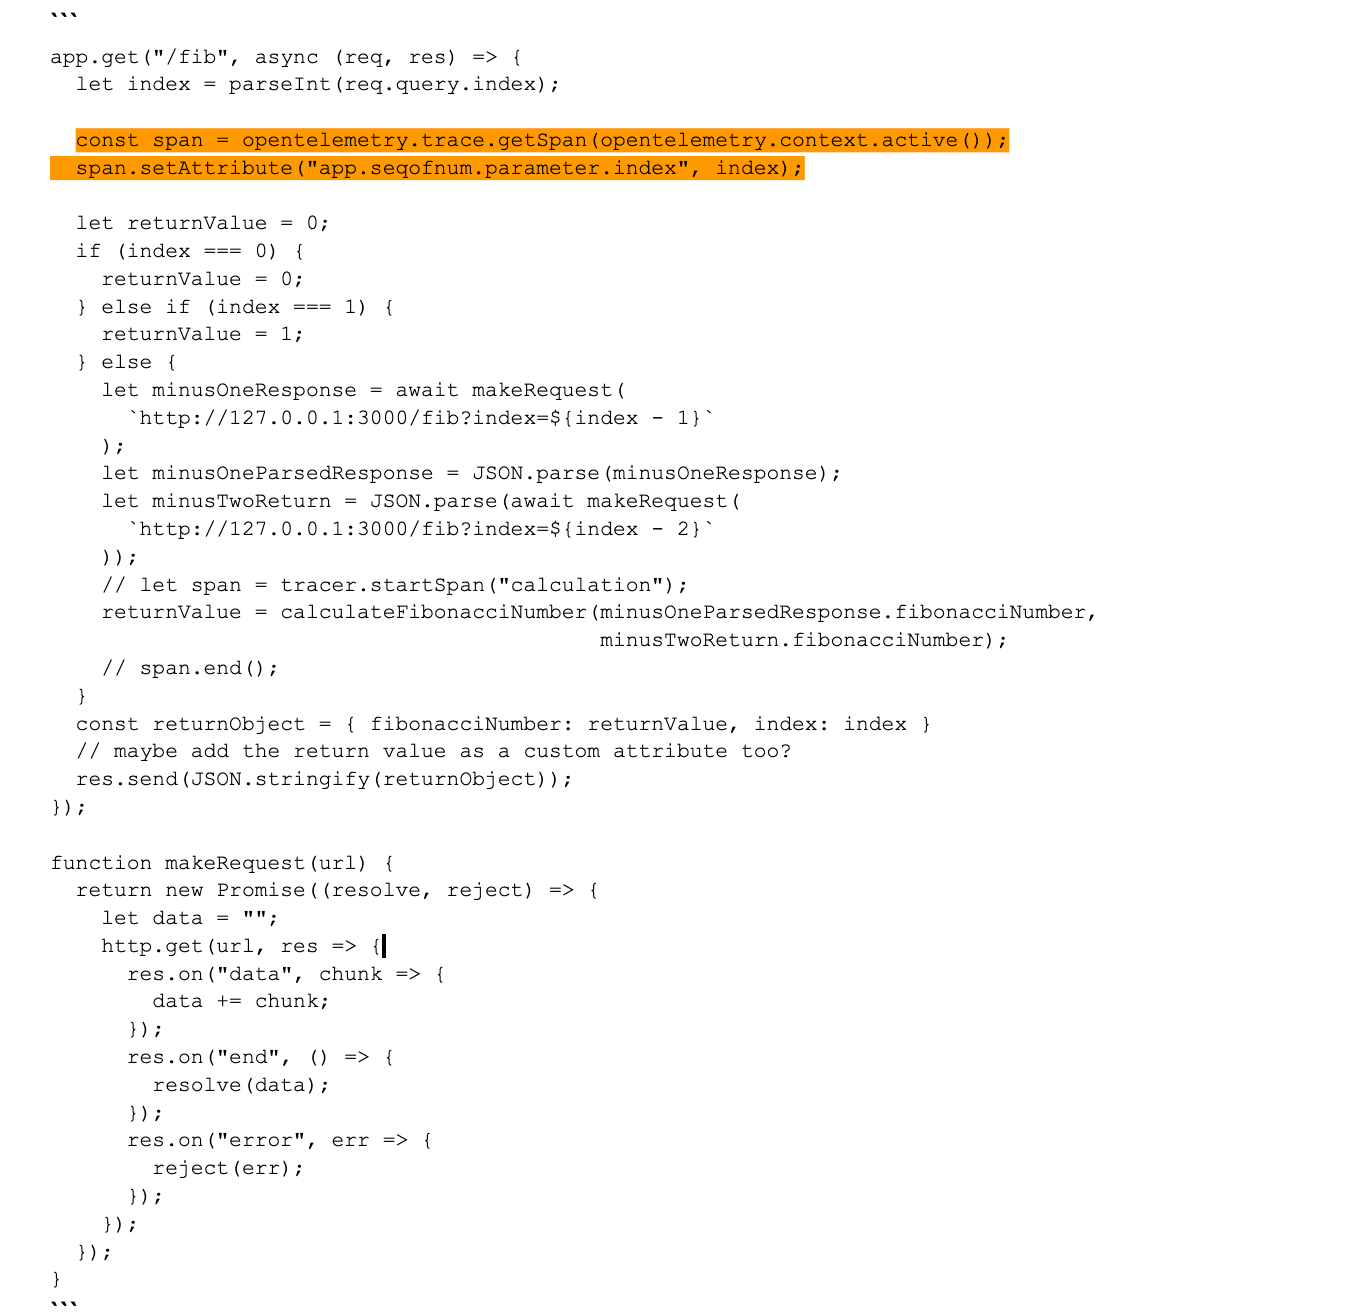
The only tracing code here pulls a span out of global space and adds an attribute particularly relevant to this application. This is not clutter! I think it adds valuable information to the code—it expresses the significance of this variable.
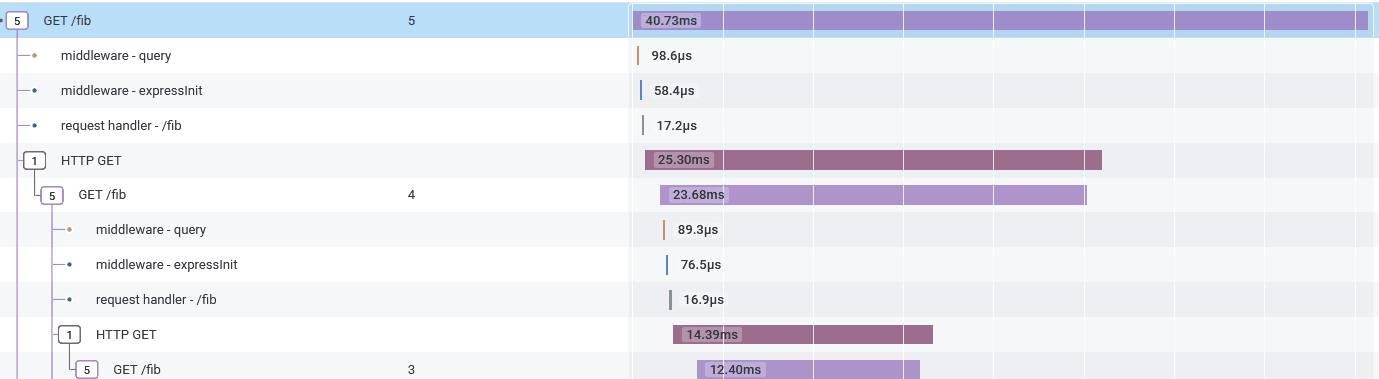
The trace contains even more information! There are spans from some middleware that I didn’t know was running. Bonus: Learn about your libraries from the traces they supply.
OpenTelemetry is legit
OpenTelemetry is an open-source project with hundreds of contributors, including companies like Honeycomb. The libraries are built to an industry standard so that any telemetry you add is portable between tracing and observability products.
Tracing is a cross-cutting concern, so it’s fair to use global variables, bytecode manipulation, and other language-runtime hooks to track context and make tracing functions available throughout your code.
- In Node.js, autotelemetry intercepts module load to monkeypatch functions.
- Ruby’s module-prepend and open classes lets libraries enhance each other..
- In Go, no such shenanigans are supported, so wrap library calls explicitly. The standard Context parameter holds tracing context.
- In Java, change no code at all! A runtime parameter can do it.
- In .NET, the standard ActivitySource API works for autotelemetry.
- Python has auto-instrumentation for lots of frameworks. I’m guessing they monkeypatch them.
I’d call some of these “hacks” if I implemented them myself. However, in a well-supported, carefully vetted library like the OpenTelemetry ones, I call them foundations.
Get traces for network requests, database calls, and more. Check what’s available for your language and framework of choice at the OpenTelemetry registry.
With auto-instrumentation doing most of the work, tracing code can make our domain logic more clear instead of less, by emphasizing what’s important. Then, in production, those same lines give us the data that shines through with insight in a product like Honeycomb.
Check out our OpenTelemetry documentation and sample apps for auto-instrumentation, and sign up for a free Honeycomb account today to try it out for yourself!
Want to know more?
Talk to our team to arrange a custom demo or for help finding the right plan.