How Do I Do Availability Checks in Honeycomb?
Let’s dig into what we mean by an Availability Check and how that maps to observability, tracing, and supporting production systems.

By: Martin Thwaites

Dear Miss O11y,
We’re adopting Honeycomb with our teams, however, we’re trying to set up Availability Checks for our services like we’ve done with previous providers. How do we do that in Honeycomb?
Andrew Kuipers – Staff Developer @ iQmetrix
That’s a great question Andrew, and something that I think requires stepping back a bit to understand. Let’s dig into what we mean by Availability Checks and how that maps to observability, tracing, and supporting production systems.
What do we mean when we say Availability Check?
For me, that’s always meant a third party service that pings an IP, or does a simple web request to an endpoint and checks for a response. The idea behind it is being able to test that point A can communicate with point B, where point A represents your application, and point B is a representation of where your customer might be. Subsequently, we get an alert if a number of these fail within a set timeframe. This is what I’m going to tackle in this answer, and how we see that mapping to what you do with Honeycomb and modern observability systems.
Why do we have Availability Checks?
This has been a contentious point since people have moved to the cloud.
With the cloud, we work in a shared responsibility model where a lot of our “stack” is managed by a third party like Amazon, Microsoft, or Google. It’s their responsibility to manage uptime, and we (as tenants on their platform) don’t get to see the inner workings of a lot of that stack. We deploy applications, and configure some networks that are internal to us, then connect those to the internet using the cloud provider’s gateways. This presents an interesting debate about how we monitor elements of our stack, like the internet connectivity of our cloud provider, that we aren’t responsible for.
In “ye olde times” where we had our own data centers and managed our own rented upstreams, this was vitally important for us to know, so we could switch them at the routing layers to maintain uptime. This, thankfully, is no longer the case.
What do Availability Checks tell us about our system?
The answer here is that it’s really an “if all else fails, maybe this will alert us” measure. The majority of things that would cause this to fire are better monitored via specific localized metrics (number of healthy instances in a load balancer) or SLOs to measure real user experience.
The “unique” failure mode that you see from an Availability Check is that AWS or Azure isn’t serving traffic to your monitoring node (i.e. the service setup to check the uptime) over its internet networks.
What should we do instead?
I can hear you shouting, “Martin, you’ve told us what we shouldn’t do, but not what we should do.” I hear you.
That’s not a simple question, as context is truly king (or queen) here. The biggest piece of advice I can give you is to start asking open questions of the engineering teams about what they expect to do when alerts are fired, what information they would like to see when an alert is fired, and what they expect to be able to fix.
Let’s use a simplified Azure infrastructure example to understand what we might want to see.
We’ll have an Azure AppService hosting an autoscaled API that’s only accessible by Azure Front Door so we get global CDN and edge capabilities.
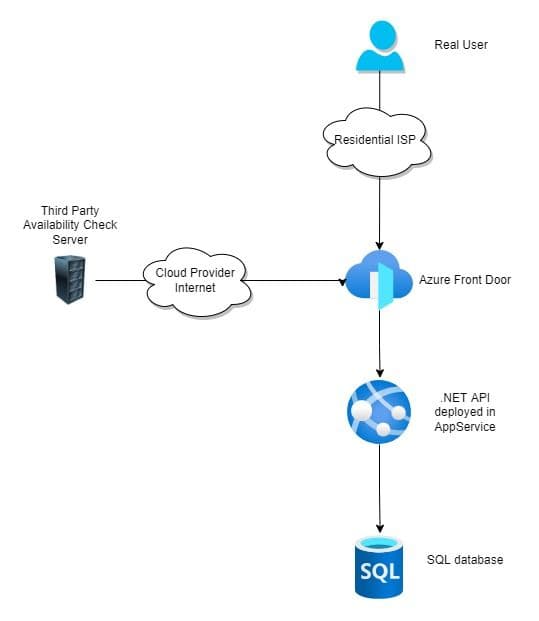
As you can see, we have an external Availability Check from another hosting provider that hits the `/health` endpoint on our API hosted on AppService through Azure Front Door. That’s pretty simple, right? Yes, but it’s a very coarse check.
When this Availability Check fires, what you get is a pass/fail that one of those many components has failed.
- Is it Azure’s internet connectivity?
- Is Front Door having a wobble for everyone?
- Could we have misconfigured something in the Front Door to AppService connection?
- Could it be throttling?
- Could Azure AppService be down?
- Could my third party monitoring service be having internet routing issues?
That Availability Check isn’t really providing actionable information to your on-call engineer, even though it is indicating that there is a problem.
What we could be doing better is thinking about our failure scenarios and monitoring those instead. Thinking about how we ensure that we know what our users (not our third party Availability Check services) are seeing.
What would be better in this scenario?
The idea behind this model is that we want to be told which part of infrastructure is not doing well so the right people can be given the right information. This is a core part of how we make on-call engineers happy and reduce burn out.
- Ingest Azure Front Door metrics and trigger based on whether the backend is healthy.
Your backend (in this case, your service hosted in AppService) will be using a `/health` endpoint exposed to Azure Front Door to show that it’s available, so when this is fired, you know that you can’t hit AppService from Azure Front Door. - Ingest AppService metrics and trigger based on the number of healthy hosts dropping below a particular level. This will point you directly to your individual service that’s down. The deployed service should be using a `/health` or `/init` endpoint to tell the AppService load balancer that it’s ok and healthy, and if not, you’ll see this in your metrics.
- Add SLOs to your service to check for latency and errors. This will tell you that a particular service isn’t performing well, not just that it’s down, and pinpoint you to why using your tracing.
- Use a third party service to check a single endpoint on Azure Front Door for all services. This will tell you if Azure Front Door is not working for your organization, as that’s for all your services, not one. Honeycomb uses Pingdom for this kind of check, and alerts us directly into Slack and PagerDuty.
The first 2 points here are the more traditional Monitoring of known knowns. We know that a lack of backends is a problem, so let’s look at that and alert with a trigger if it’s a problem.
The third point is where we get into the true value of observability by using Service Level Objectives that tell you about what your users are experiencing.
Then finally, we have the coarse check with ensuring that your edge service (in this case Azure Front Door) is accessible to the internet.
Conclusion
Now that you’ve learned the realities of Availability Checks in a modern cloud environment, I hope you’ll be able to take this information and level up your observability game. It’s important to remember that observability isn’t just about reacting when something fails, but creating and curating a big picture overview of everything in your environment so you can proactively tune your systems for the best user experience, both internally and externally.
If you need further advice, feel free to book 1:1 time with the DevRel team by using our office hours page. We’re always happy to help!
Want to know more?
Talk to our team to arrange a custom demo or for help finding the right plan.