Webinar Recap: How to Avoid Being On Call With Under-Instrumented Tools
“It’s expensive. It’s difficult. Our APM works just fine.” The three myths of observability can lead to being on call with under-instrumented tools. That’s exactly what happened to Paige Bernier, retired SRE. Let’s learn about her experience and see how we can avoid being in the same situation.


“It’s too expensive!”
“Do we really need another tool?”
“Our APM works just fine.”
With strapped tech budgets and an abundance of tooling, it can be hard to justify a new expense—or something new for engineers to learn. Especially when they feel their current tool does the job adequately. But, does it?
All it takes is one bad on-call experience, one floundering around to find out what’s really the problem, to feel how under-instrumented your tooling might be. That’s what happened to retired SRE Paige Cruz. An on-call event made her clearly see how much more context she needed behind alerts when her service goes down. In a recent discussion, we learned more about her observability journey and debunked some common myths. Let’s dive in.
Story time—and it’s one many of us know all too well
It was a typical Thursday morning. Paige was checking things off her to-do list when the incident channel in Slack lit up. As an SRE, her natural instinct was to jump in—but she wasn’t on call. Her team was in the throes of a high priority migration, so she stayed focused on the task at hand—even as the number of messages continued to climb.
Finally, her Team Lead messaged her directly and asked if a change she made went through. He followed up by confirming that the entire system was down. A bunch of thoughts started running through her mind: But a bunch of people reviewed my PR. What the heck? Surely it’s not my one-line change? She said she didn’t know how it could be related, but she would roll the change back. After all, now was the time for mitigation, not investigation—even though her mind was begging to investigate.
Before we disclose what happened, here’s a little quiz. What do you think caused the outage?
- A bug
- A botched config rollout
- A random zonal failure
- An accidental Terraform apply in the wrong environment
If you guessed answer B, you are correct. 🥺
Paige’s one-line chain lay in a nested layer of YAML. In the prod environment—and only in that environment—there lived a security scanner that served as the front door to their Kubernetes cluster. Without it, no requests from the external CDN could come into the cluster. That one-line change shifted the merging of YAML, and removed that scanner. No requests got in. Devs saw a drop in throughput and scary HTTP status codes. But with their current APM tool, they couldn’t surface the problem. The team saw views specific to their app, not the full system. (*sad face)
From this incident, Paige learned that even if you do things by the book—like getting PRs reviewed—mistakes can still happen. Perhaps more jarring, she began to see how APMs have some hefty limitations when it comes to understanding all things that can go awry—specifically in today’s modern distributed systems. To round it back to our original question, are your current APM tools doing the job they need to do? In Paige’s case, and most likely many teams running software in cloud environments, no. Let’s explore why.
After this incident (about six years ago), Paige turned to a shiny new concept known as observability. In theory, observability brought promises of full visibility into systems, of faster debugging. As she implemented observability in her organization, she encountered three myths/objections/misconceptions folks often have about observability in practice—and noticed how to overcome them.
Myth One: Observability is too expensive.
“We just don’t have the budget.” — the boss.
Teams are conditioned by the bills they receive from their current APM tools. Especially if they are seeking budget approval for a new observability tool to replace their current APM tool. Many of us have heard the answer, “our bill is already high enough, why do we need another tool?” Let’s debunk Myth One.
Perhaps you’re using your tool to monitor requests with HTTP status in the 500 range, per service. Then you add the particular HTTP status code.
http.request.status_5xx service:$X code:500
5 http status metrics
x 15 total services
x 75 http status codes
x 100000 users
= 5,625 potential unique metrics
The more detailed the metrics, the more expensive they are.
Next, it is useful to know which users are sending those requests:
http.request.status_5xx service:$X code:500 user_id:123456
5 http status metrics
x 15 total services
x 75 http status codes
x 100000 users
562,500,000 potential unique metrics 💥⚠️⚠️
That looks like $$$.
With traditional APM dashboards, you’re charged for every data series you want to ingest and track beyond the automatically included fields. Dimensions with many values—important stuff like container ID, customer, full URL—get extremely expensive. Observability tools don’t have this restriction. Add hundreds of fields, each with millions of values, for no additional cost. Throw in region, User-Agent, result, and even IP address. Include everything relevant to decisions your code makes, and also what the code decided. Include identifying information so that you can find this particular event when you want to study it.

You’d never send these wide events, with their high-cardinality (many-valued) fields, to an APM tool. That would be too expensive! Instead, send them to your observability tool. Then query by any field in seconds, group by as many dimensions as you need, surface correlations between events across all fields, and you’re only charged on events per month.
Myth Two: Observability is too difficult.
“Another tool? Who’s gonna own that?” says the SRE team.
Tools aren’t magic. I’m not going to tell you that observability is easy. There’s work in instrumenting applications, and there’s effort in learning a new interface.
Paige points out that all of that work fades in comparison to the difficulty of working without observability.
On-call teams that use observability to monitor their systems often say things like, “I don’t know how we did this before, I’d never go back.” Especially after the first time they log in to work in the morning and Slack shows them a Service Level Objective burn alert. That alert tells them something is wrong, by the standards of our reliability commitment to the business—but not super duper urgently wrong. Someone just got a free night’s sleep! Monitoring alone can’t do that.
Observability enables even the newest on-call engineers to investigate what’s happening. It gives them fast feedback loops, so they can get answers quickly. At a click, everyone can drill down into a detailed distributed trace. When they can see what’s going on, incidents are less frightening. Debug and resolve in minutes, and then leave work on time. Or close the laptop, however we conclude work these days.
Observability takes the fear out of being on call. Then more people on the team can participate—not only the top experts.
The work of observability pays off quickly. Also! That instrumentation work is portable, thanks to OpenTelemetry. It’ll continue to make your application easier to support, whatever tools you use in the future.
Myth Three: My APM tool works just fine.
“Most of our devs know XYZ tool really well,” says the engineer that set it up.
That’s great! Maybe they can use the current monitoring tool to its full potential. But Paige considers: how far does that potential go?
Say a page comes in, and the monitoring tool shows you this chart. Blue is HTTP 2xx (success response), green is 4xx, and red is 5xx (both failures).
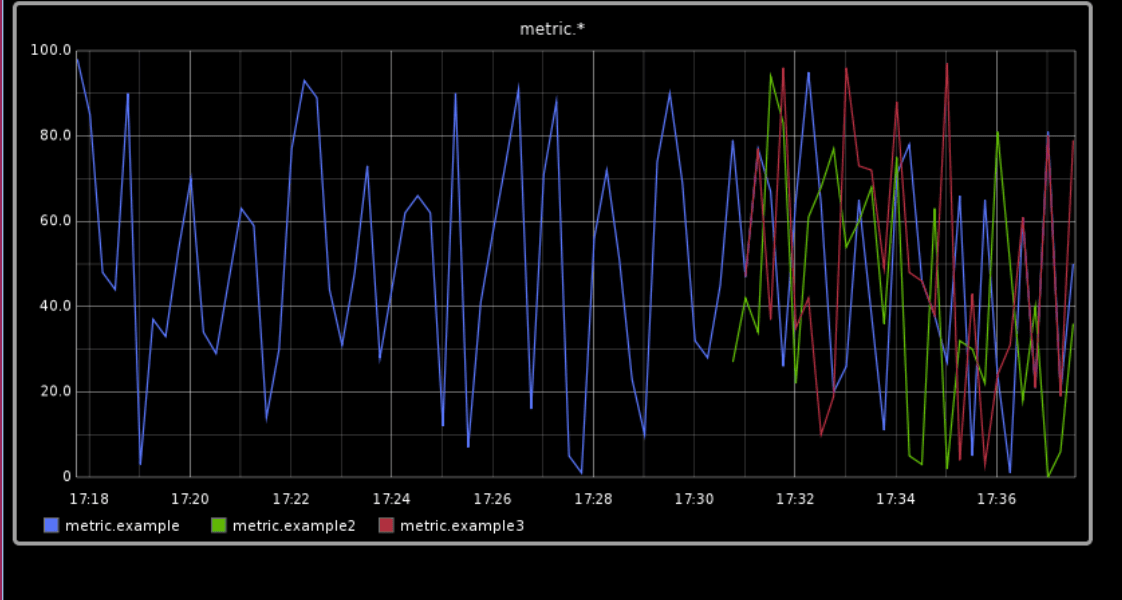
Something is definitely wrong! But what?
This is what timeseries metrics can show us—it’s not that they’re devoid of information; they got us to this point. They can show us when something bad is happening, and how many bad things happened, but not why. With monitoring, you can only get as far as the $$$ custom metrics your organization stores.
It costs something to shift our existing activities from one tool to another. The payout comes with the new activities we can do. For Paige, the “query anything with events” page exemplifies this.
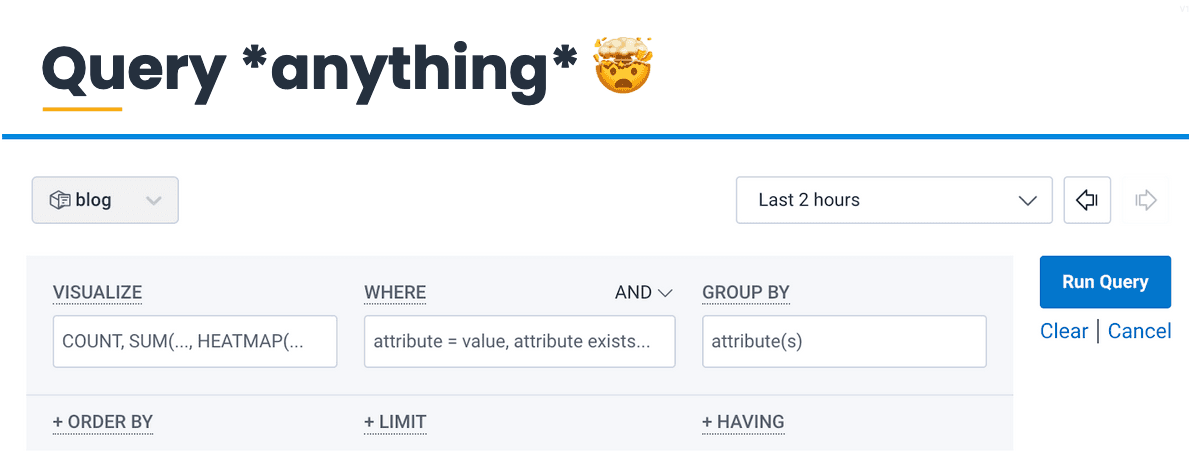
It may seem intimidating at first, but this page is a treasure trove of information to help anyone investigating an issue. Sort the events by HTTP code; see which ones are increasing in frequency and narrow it to those. Check which customers are getting those 4xx responses, and what they’re sending. There’s more to learn, because there’s more power.
To recap
Observability is cost-effective—not expensive. It is a journey; it is necessary to meet the complexity of today’s systems. Learning to use it is also a journey: a journey to new superpowers.
Let’s revisit the incident from earlier, where Paige took everything down by accident, except in a glorious world with all of the capabilities of Honeycomb and observability.
What might have happened? The on-call developers get an alert, and they pop over to Honeycomb. They see some requests failing—external requests. Internal requests are fine. Then they click on a failed request, and see the trace. The first error span in the trace shows that it failed on the security scan. Paige’s team lead says, “Hey, can you roll back that config change? No external requests are making it through because the security scanner isn’t reachable.”
Paige still thinks, “Oh my God, the change that tested? The change that I had you and a bunch of other people review? That I baked for a long time into lower environments?” But she says, “Hey, thanks for that context! Rolling back now.”
She has confidence that the action that she’s taking will resolve the symptoms that they were seeing. And then she will go find out more about the security scanner that only exists in production.
Conclusion
After all she’s learned, Paige will forever refuse to be on call without good observability.
Want to get this better on-call experience yourself? Sign up today for our free tier and see what you can learn. You can also watch this webinar on demand.
Still have questions? Book a 1:1 with Jessitron to learn more.
Want to know more?
Talk to our team to arrange a custom demo or for help finding the right plan.