Datasets, Traces, and Spans—Oh My!
By giving an overview into datasets, traces, and spans, you’ll get a peek behind the curtain into how Honeycomb facilitates observability in the hopes of arriving at a place where identifying the source of errors, finding performance problems, or understanding how data flows through a large system is made easier.

By: David Marchante
If you’ve stumbled (or purposefully landed) on this blog post, chances are you are new to—or diving deeper—into the observability space, o11y for short. Suffice it to say, you’re not in Kansas anymore. Honeycomb in a lot of ways can serve as a yellow brick road into o11y, and this article should serve as an introduction into how Honeycomb facilitates implementing o11y into applications and distributed services.
Stepping into the world of observability can be both a revelation and overwhelming. We here at Honeycomb want this new world to be more of the latter and to aid in making sense of this new world so teams can experience a greater understanding of their services and systems. This is accomplished via distributed tracing, which enables users to trace and visualize interactions between multiple instrumented services or methods within a service by tying together instrumentation from those services or different methods.
By giving an overview into datasets, traces, and spans, you’ll get a peek behind the curtain into how Honeycomb facilitates observability in the hopes of arriving at a place where identifying the source of errors, finding performance problems, or understanding how data flows through a large system is made easier.
Yellow Brick Road
If I only had a… dataset
Datasets are the brain of your data, since they are the way distributed services are organized and bound together as defined by a collection of spans. Datasets are automatically organized by environments based on the associated API keys. There are two types of datasets: service datasets and general datasets.
Service datasets are trace datasets that are defined by trace fields and organized by service name. General datasets are all other datasets, and are usually non-trace datasets, such as deployment data, logs, or metrics. Even though there are no traces in general datasets, it’s still recommended to send the associated events into the appropriate environment.
If I only had a… trace
Traces are the heart of your data, since they tie together the instrumentation from separate services; however, traces cannot determine relationships across different environments. Traces are crucial in understanding how your data flows through your system, and this becomes increasingly important with modern distributed systems.
Since traces are central to understanding how data moves through your system, they are also key to identifying errors and/or performance problems. Traces accomplish this by tying together different events or spans via a trace ID, and they can cross a number of different datasets within the same environment.
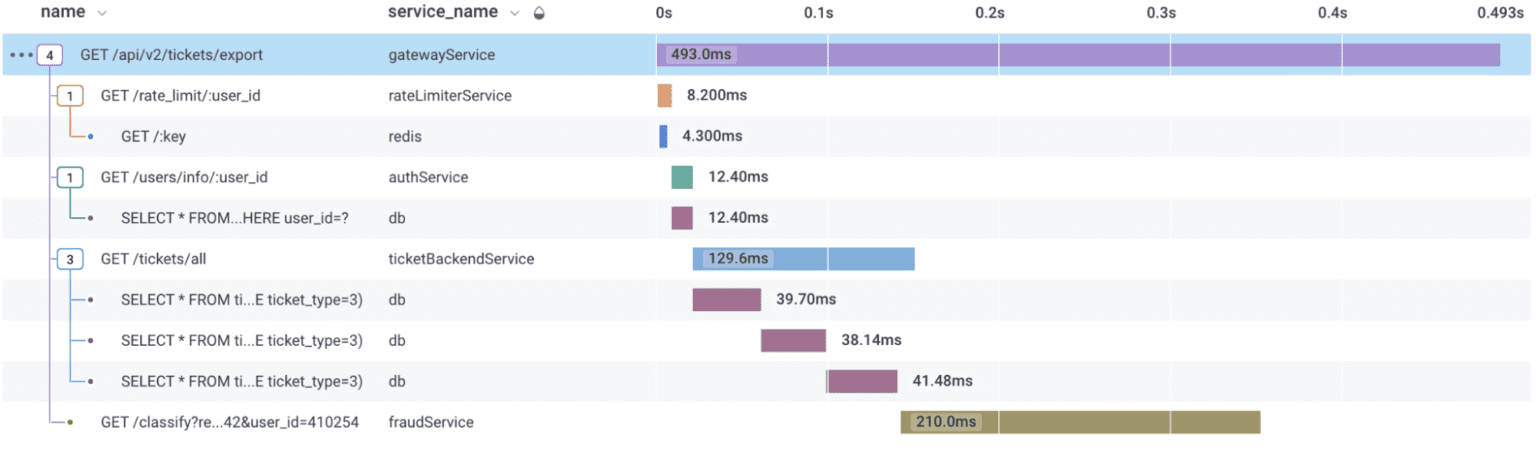
As an example, this ID ties different functions in an associated request together. More explicitly, a request comes in for user information and initially calls a user service. Then, this user service may call an account service, which makes a database query. This request can call a third-party API.
This series of requests is tied to together in one trace via a trace ID, and is comprised of spans or events that were instrumented in each of these services, allowing for effective visualization of issues that may arise with the calls in this distributed service example.
If I only had a… span
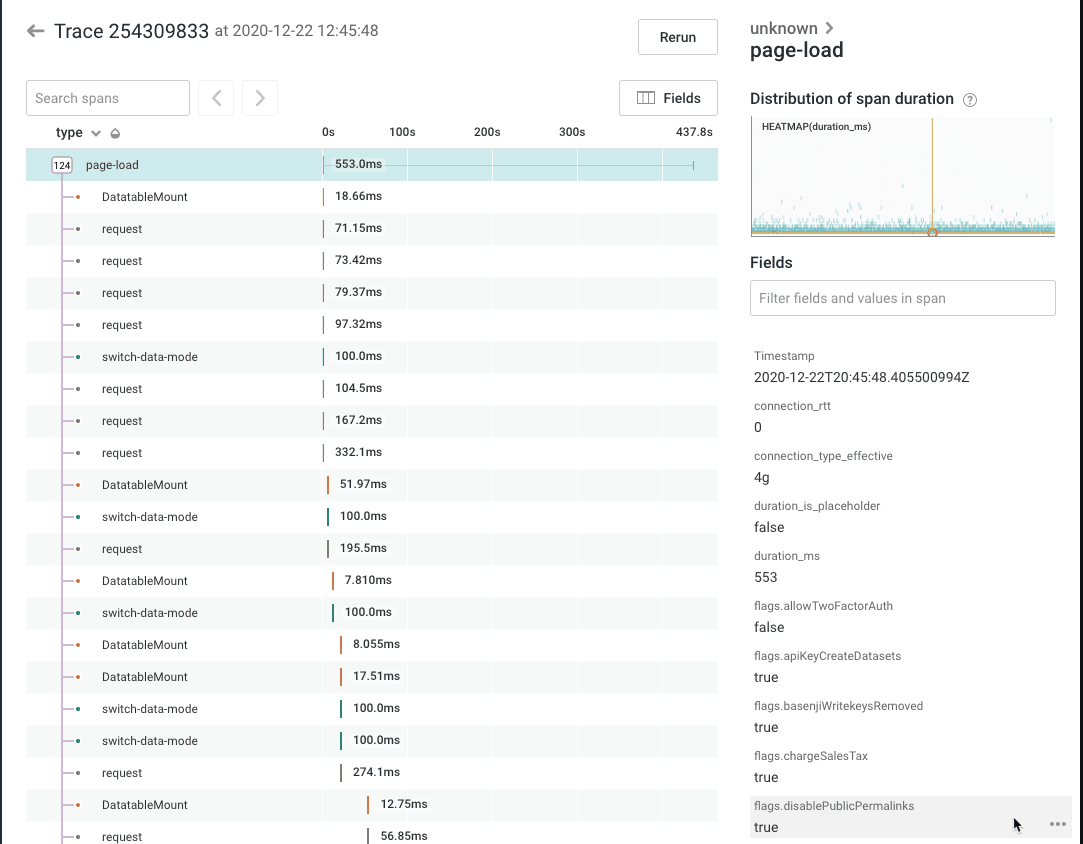
Spans capture the data of events, and their insights give us the confidence to identify what issues may occur in our application. Spans tell part of the trace story (multiple spans make up a single trace) by including information fields such as service names, method names, timestamps, durations, relevant IDs, and trace IDs. The fields can be a string, float, integer, or boolean.
Spans require a timestamp to facilitate the sequential waterfall view seen in Honeycomb traces and are the only field that is required. Spans are also tied together by trace IDs, meaning that all spans within the same trace will have a trace ID field with the same trace ID.
There’s no place like home
Datasets, traces, and spans together provide a full picture of what’s happening within applications. Datasets act as the brain grouping data together, traces act as the heart tying data together, and spans give confidence in your applications by capturing all the data that is instrumented. Together, these allow data to be ingested into Honeycomb and allow applications to become observable.
Want to try it for yourself? We offer a generous free tier that you can sign up for today.
Want to know more?
Talk to our team to arrange a custom demo or for help finding the right plan.