Driving Exceptional Support: Unleashing Support Power with Honeycomb
n technical support, ensuring customer satisfaction and quickly resolving issues are of utmost importance. At Honeycomb, we embrace a comprehensive approach by using our own platform—not only for engineering purposes, but to also empower our support team.

By: Roel Vista
In technical support, ensuring customer satisfaction and quickly resolving issues are of utmost importance. At Honeycomb, we embrace a comprehensive approach by using our own platform—not only for engineering purposes, but to also empower our support team.
By utilizing Honeycomb, our support engineers can monitor, troubleshoot, and investigate customer issues with great efficiency. In this blog post, we will explore how using Honeycomb at Honeycomb supports our customer base, and we’ll highlight how observability equips our team with valuable insights to deliver ✨ exceptional ✨ service and address user concerns promptly.
Enhance troubleshooting for support teams with instrumentation and telemetry
When it comes to troubleshooting and debugging common customer issues, the key lies in instrumenting your code and emitting useful telemetry data.
We recommend involving your support team during the instrumentation process, gathering their insights, requirements, and expertise to ensure that the telemetry data collected aligns with their troubleshooting needs and priorities. Here are some best practices:
- Determine the specific customer issues you want to troubleshoot, and the key metrics and events that will help identify and resolve those issues. This should guide your instrumentation efforts.
- Instrument the important paths and processes within your application. Capture the relevant entry and exit points, key operations, and events that occur during these processes.
- Instrument both success and failure paths to gain visibility into potential issues.
- Enhance your telemetry data with contextual information such as user IDs, request parameters, session IDs, timestamps, and any other relevant data that will help your support engineers understand specific customer scenarios.
- Utilize semantic conventions to standardize the naming and structure of your telemetry data.
- Be consistent in data format and naming conventions as this will improve the usability and searchability of telemetry data in Honeycomb.
- Instrument your code to capture and log errors and exceptions.
By following these practices, your team will gain valuable insights to promptly isolate and resolve issues.
Learn About Auto-Instrumentation
Empower support engineers with Honeycomb’s Service Map
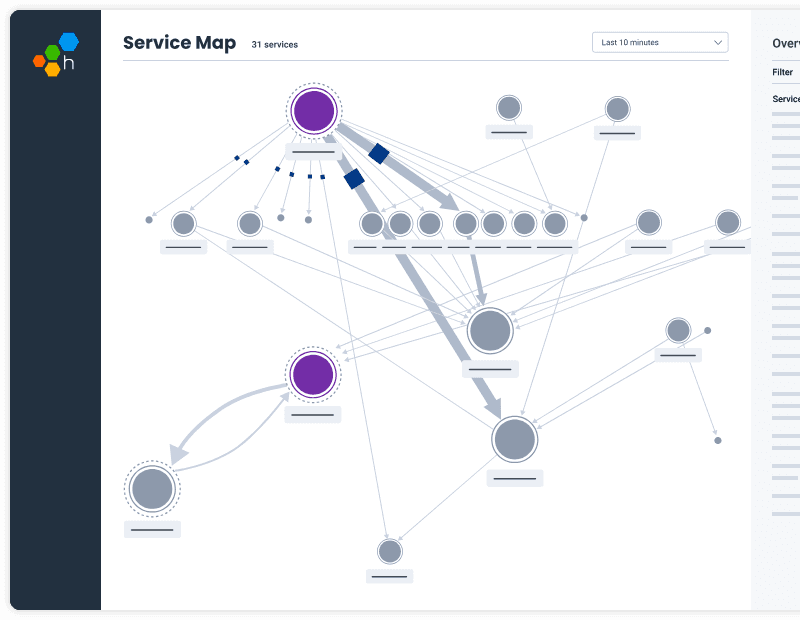
Honeycomb’s Service Map is a powerful tool that helps support teams understand their application architecture. With it, they can efficiently debug, troubleshoot, and diagnose connections within complex and distributed systems.
By transforming telemetry data into visual representations, Service Map provides a quick overview of service interdependencies, event generation, and latency. It simplifies the onboarding process for new support engineers, enables you to ask insightful questions about your applications, and allows for isolating services, searching for dimensions, and drilling down into detailed traces.
With Service Map, support teams gain a better understanding of their applications, allowing them to navigate the complexities of the application architecture and pinpoint the key areas to prioritize when debugging an issue. This valuable insight leads to faster issue resolution and improves the efficiency of the support process.
Help customers get data in
At Honeycomb support, our initial focus is to verify whether the data successfully reached our systems. We begin by examining the Shepherd service, which serves as the primary checkpoint for data ingestion from our users. Here, we can identify potential issues such as rejected malformed data, disconnection or timeout errors, and permission mismatches.
Ideally, these error messages are promptly conveyed to the customer, but sometimes they may not be aware of where to look.
Understanding Service Map architecture proves invaluable in such situations. If the data fails to reach the Shepherd service, our next step is to investigate the ELB load balancer. The knowledge of the application’s Service Map proves crucial in this context, as it provides us with valuable insights into our own architecture. This empowers our team to actively collaborate with engineering and seek guidance through our dedicated Slack channel to address any follow-up inquiries and overcome roadblocks to debug ingestion issues.
If you find yourself in a similar position, you can create query templates for your support engineers, outlining the initial places to investigate different issues. Consider sharing your “drive-by” queries or even creating a collaborative board with these queries, so your support engineers can have these queries handy and use them as needed.
Streamline troubleshooting with Honeycomb collaborative boards
Creating a dedicated Board for support engineers can significantly enhance the efficiency of troubleshooting customer issues. This type of collaborative board serves as a centralized repository of common queries, allowing support engineers to quickly access and execute predefined checks before escalating potential bugs to the engineering team.
Furthermore, by having the ability to view the team’s history and activity on the query builder, the board can be constantly updated with the latest query routines and innovative ideas, ensuring its relevancy and value as a resource for support teams.
Collaborative boards can help support engineers validate common scenarios, examine relevant data, and identify any anomalies or patterns that may indicate a potential issue. This proactive approach not only streamlines the support process, but also reduces unnecessary escalations. This enables the engineering team to focus on critical and complex problems.
Boards can act as a knowledge-sharing platform, promoting collaboration between support and engineering teams. Ultimately, collaborative boards help ensure that customer issues are thoroughly investigated and resolved efficiently, leading to improved customer satisfaction and a more effective support workflow.
There’s a reason we dogfood
Leveraging Honeycomb has significantly empowered our own support team. Through instrumentation and telemetry, support engineers gain valuable insights to quickly resolve issues. The Service Map enhances understanding of application architecture, while collaborative Honeycomb Boards streamline the support workflow. These practices drive exceptional service, customer satisfaction, and continuous improvement within our support and engineering teams.
Are you ready to unleash the power of Honeycomb for your support team? See the transformative impact of Honeycomb’s observability capabilities—sign up for Honeycomb today!
Want to know more?
Talk to our team to arrange a custom demo or for help finding the right plan.