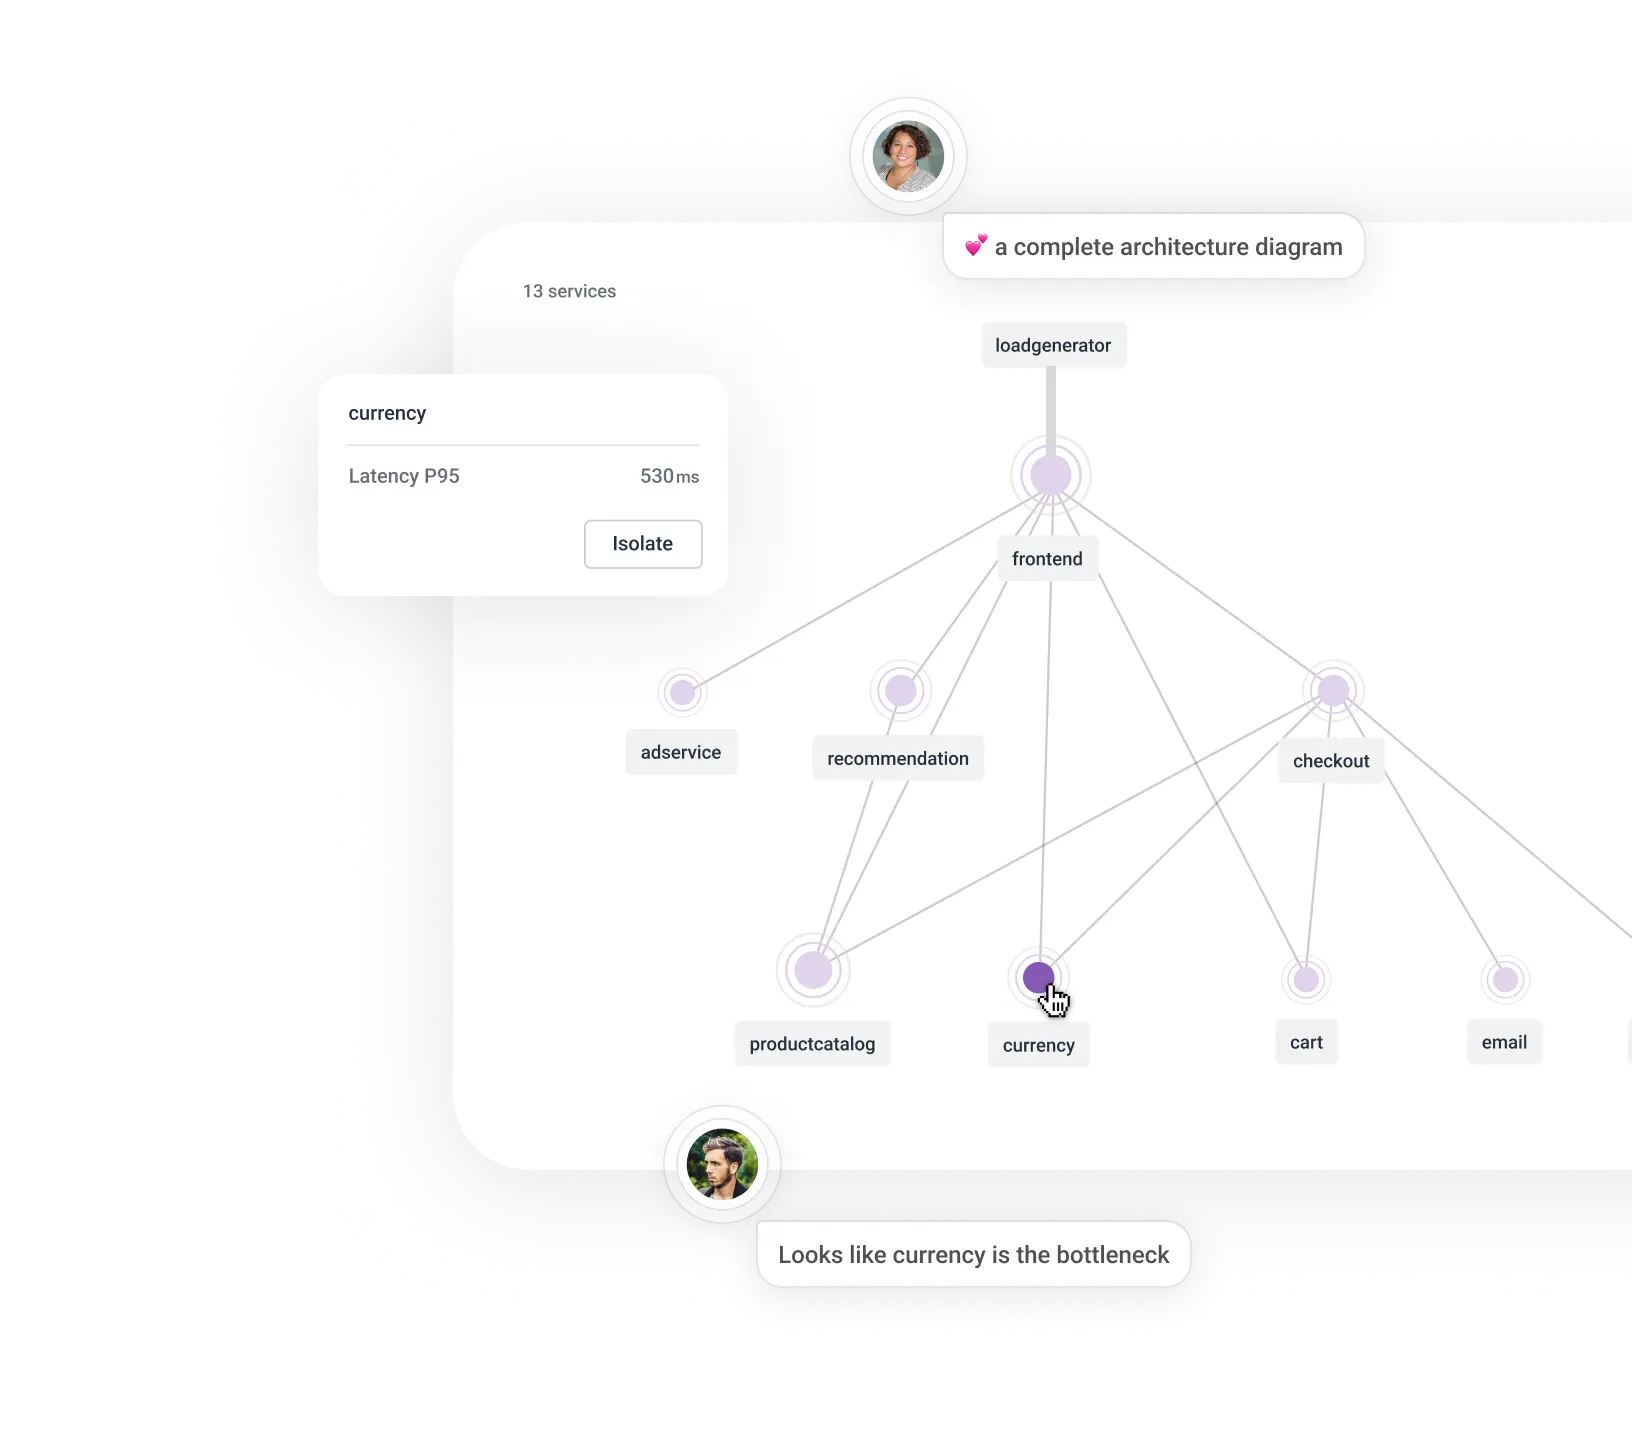
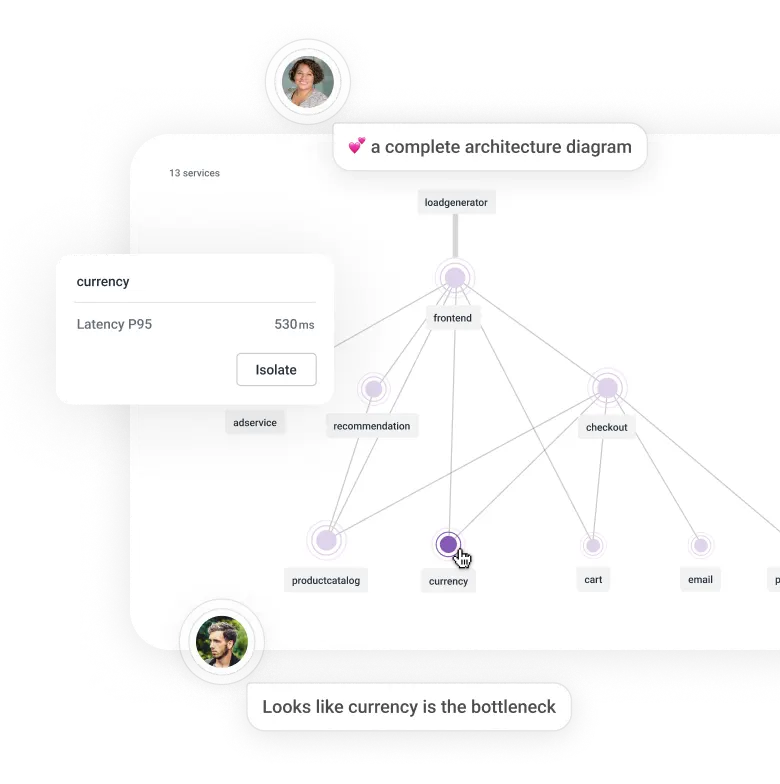
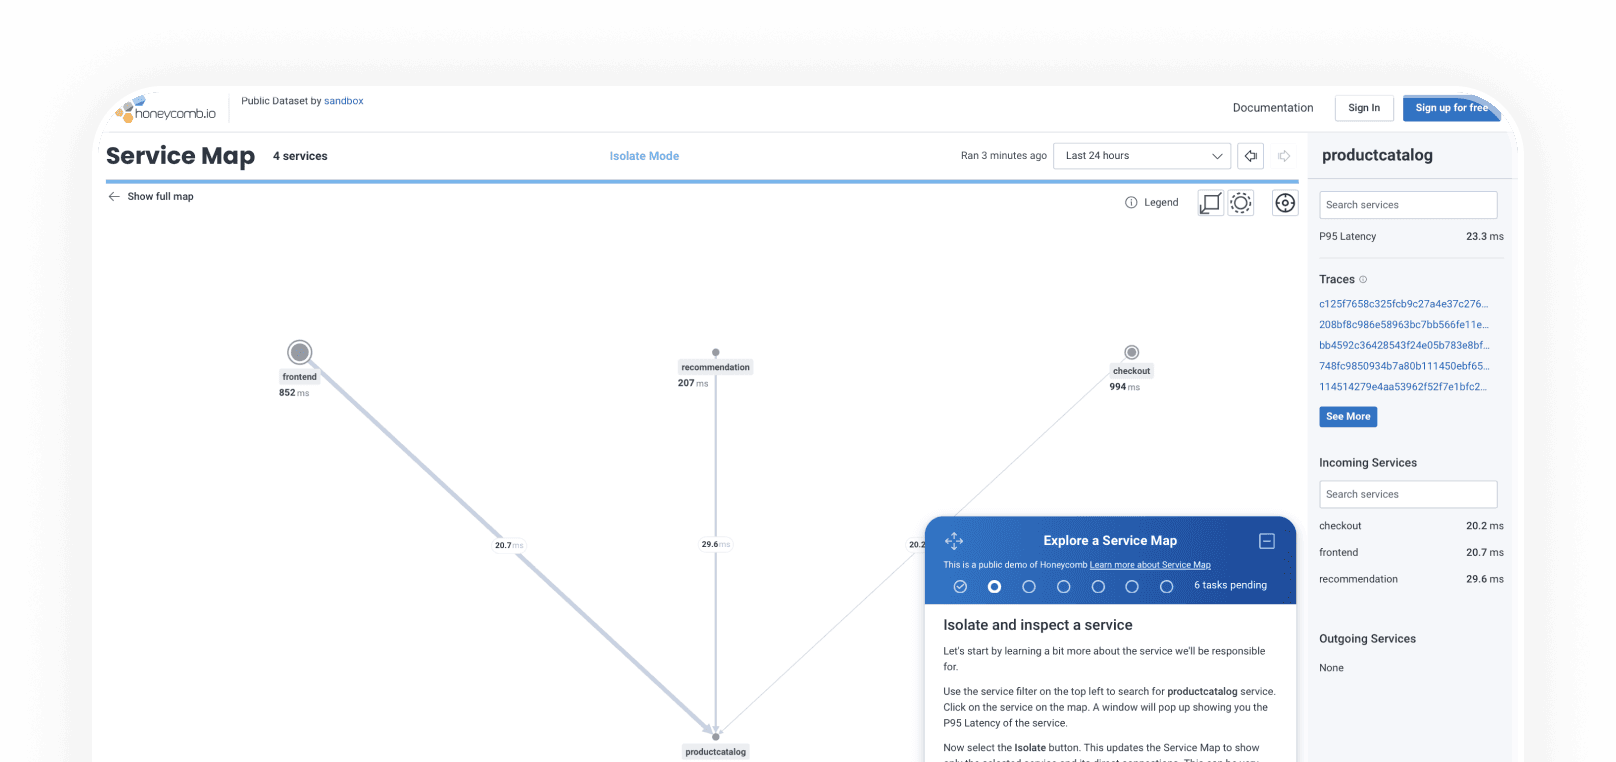
Debug visually with Service Map
Scan, filter, and quickly isolate issues between your application services.
Why you’ll love Honeycomb
See the bigger picture
Map any granular request across your services. Find dependencies by filtering down from a unified view.
Pinpoint issues faster
Tighten the feedback loop with fast filters and a live map of your code. Find and fix issues before customers notice.
Work as a team
Service Map orients every engineer to your stack, making collaboration and hand-off easier.
See how it works
Watch a demo or try Service Map for yourself in our sandbox —no registration required.
Why you need Honeycomb Service Map
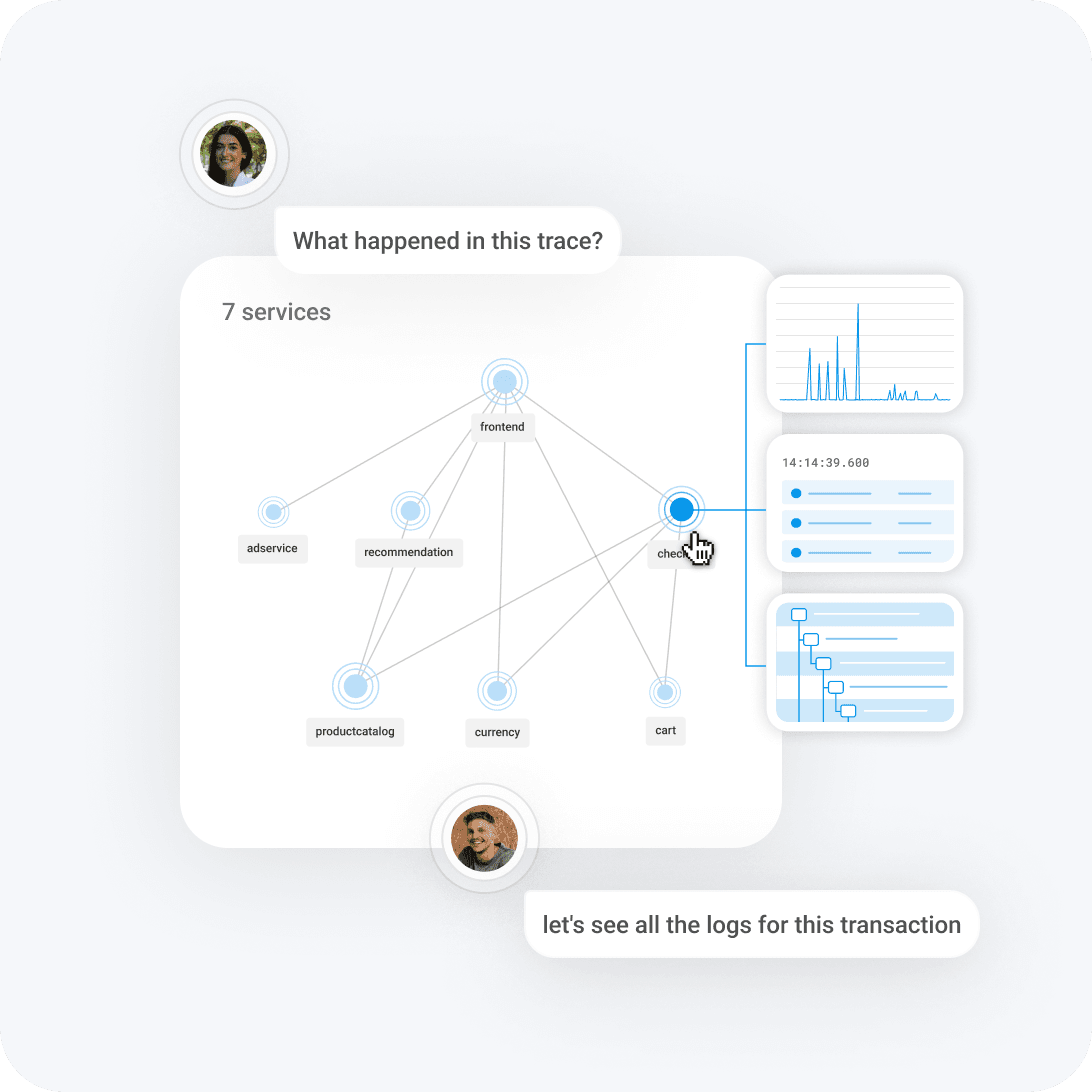
Unified observability
Filter down the map with trace attributes, then reveal log context and metrics in a single workflow.

Faster problem-solving
Spot root causes by filtering the map and revealing patterns within the event data.
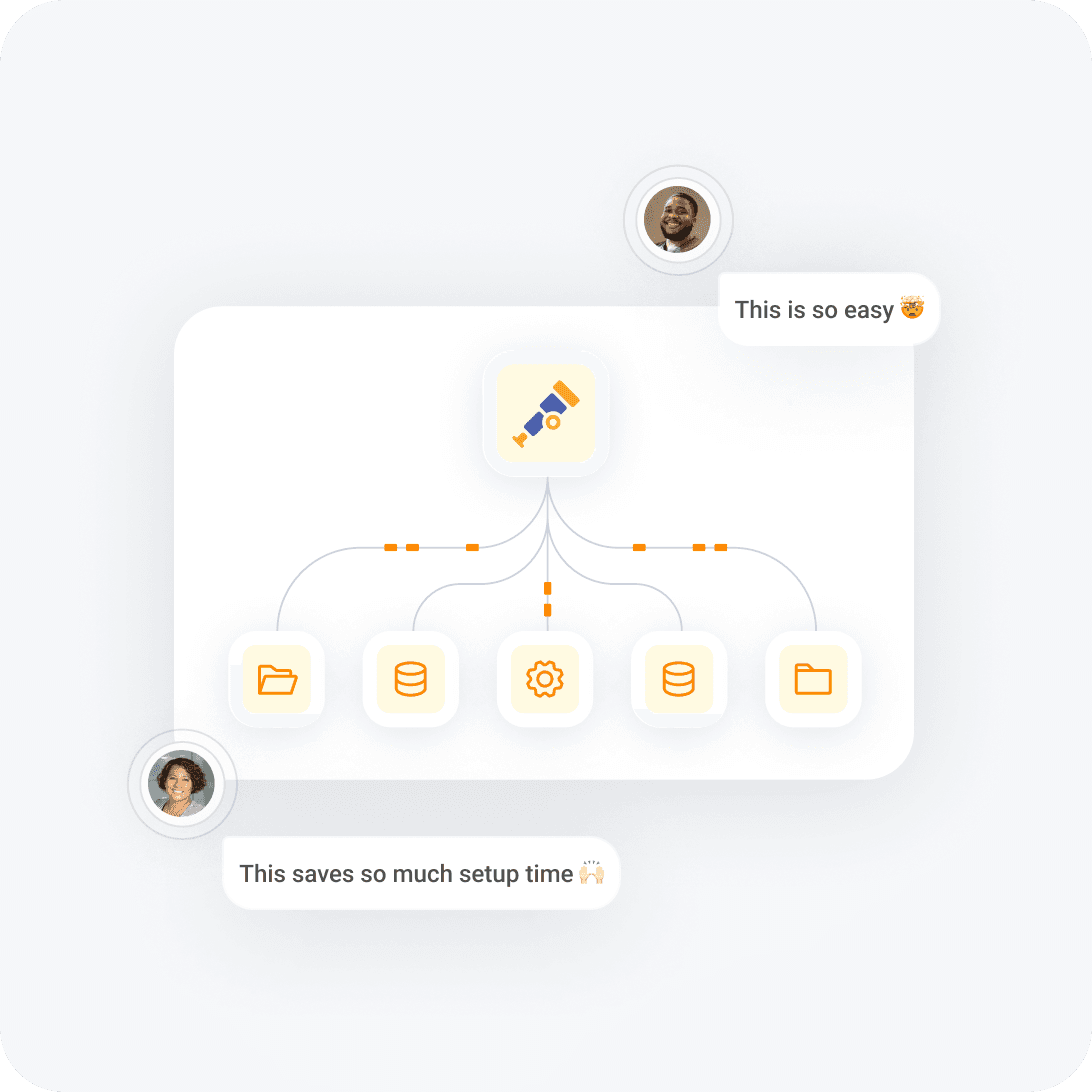
Seamless integration
Powered by OpenTelemetry for easy data collection and custom instrumentation you own.

Equip every engineer
Give every engineer, even less-tenured ones the ability to understand your whole stack. Let your software teach you how it works.
Now, with Service Map, we can see where everything is going for that single server. We’re also able to highlight down to what is 500ing. That will get us to the point where you can see login secrets or users, and maybe that’s what’s causing our errors, and we can look at spans and traces for that service.

Zach McCoy
Principal Staff Engineer, Jack Henry
Give it a try in our sandbox
See how Honeycomb’s Service Map allows you to visualize your system’s connections to give you rich insights about your services.


Want to know more?
Talk to our team to arrange a custom demo or for help finding the right plan.