How Metrics Behave in Honeycomb
Honeycomb has the ability to receive events from application. These events can take the shape of Honeycomb wide events, OpenTelemetry trace spans, and OpenTelemetry metrics. Because Honeycomb’s backend is very flexible, these OpenTelemetry signals fit in just fine—but sometimes, they have a few quirks. Let’s dive into using metrics the Honeycomb way and cover a few optimizations.

By: Mike Terhar
Honeycomb has the ability to receive events from applications. These events can take the shape of Honeycomb wide events, OpenTelemetry trace spans, and OpenTelemetry metrics. Because Honeycomb’s backend is very flexible, these OpenTelemetry signals fit in just fine—but sometimes, they have a few quirks.
Let’s dive into using metrics the Honeycomb way and cover a few optimizations:
- Getting metrics into a format that Honeycomb supports
- Sending them to Honeycomb
- How they fit into the architecture
- Where they show up and what value they bring
Metrics can be a nice enrichment to traces
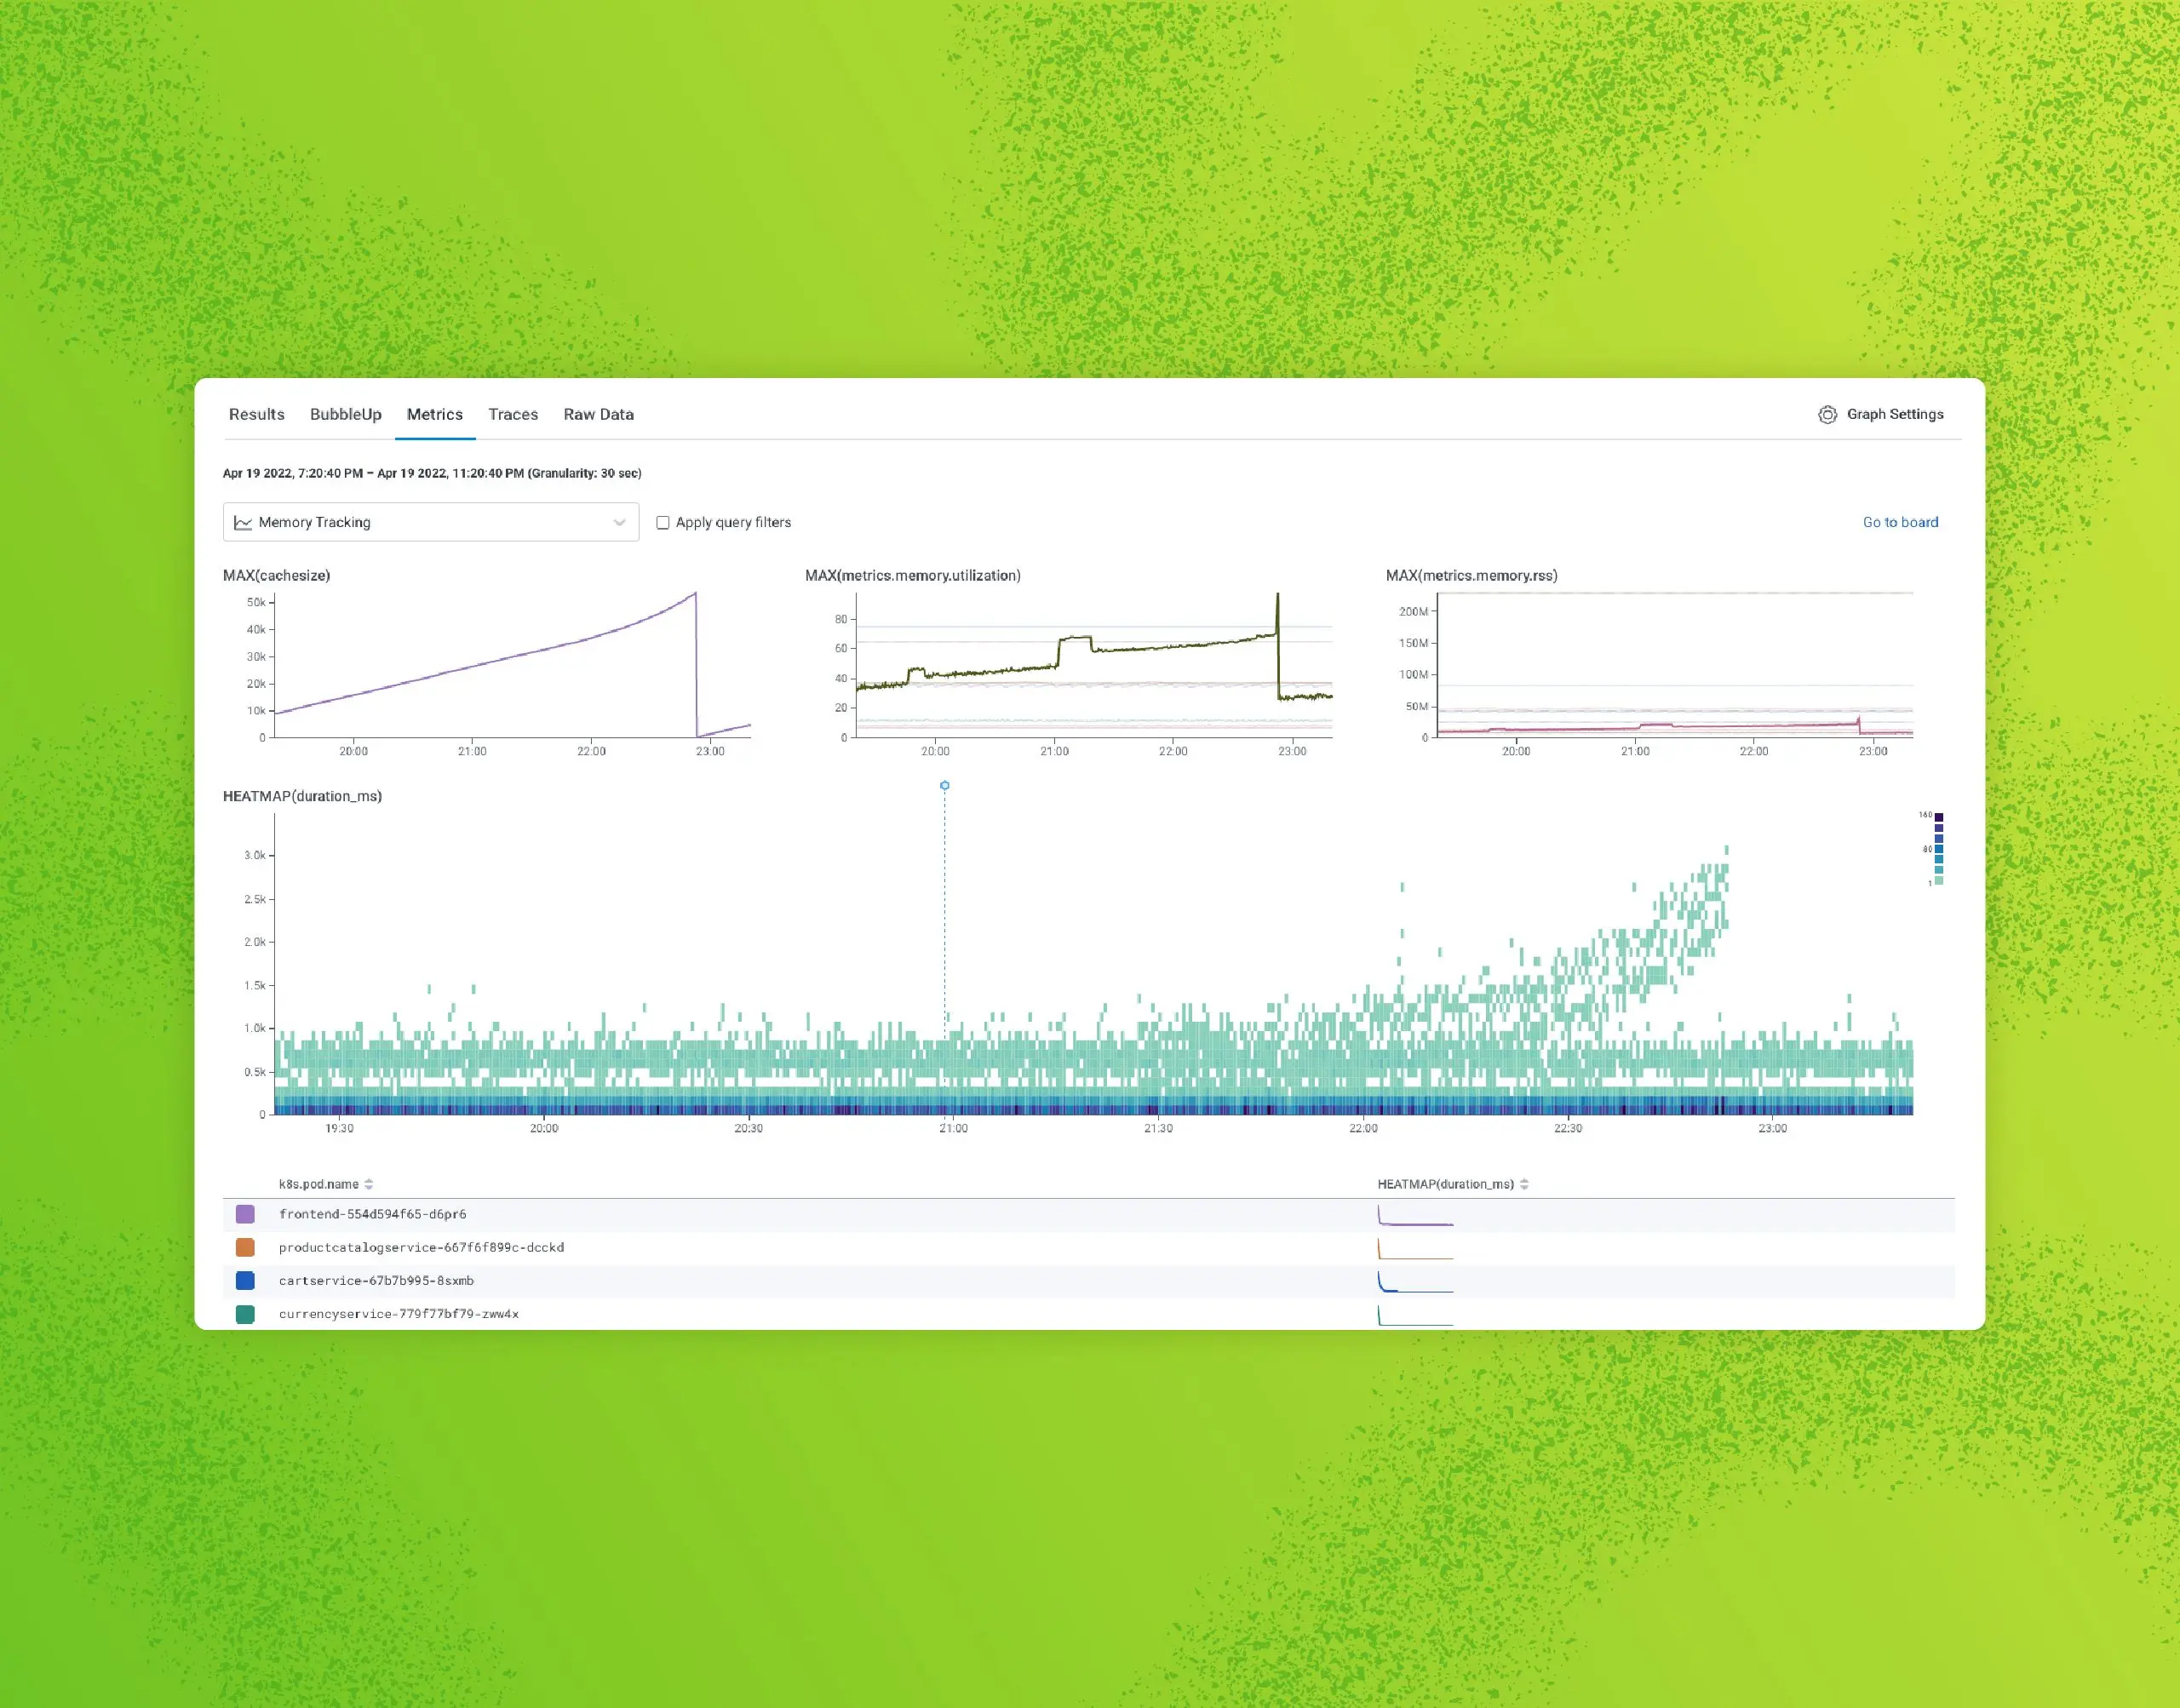
We built our first metrics feature to support the OpenTelemetry metrics format. Since other systems use metrics as the only data presented to a user, they focus on formatting and a variety of graphical representations to make up for the lack of context. Honeycomb shows metrics alongside relevant queries to add the infrastructure contexts to the application’s performance over a given time range.
The chart above shows metrics about memory pressure, along with the heatmap of latency from the application. Other metrics that could be added include network throughput, CPU interrupts, or disk IO. Depending on the types of workloads or errors, different metrics boards can be referenced to aid in troubleshooting.
This is particularly helpful when applications function well within their typical boundaries, but a noisy neighbor, for example, could deplete all the cloud IPs on a Kubernetes host, making error rates climb.
What kinds of metrics go to Honeycomb?
There are two flavors of metrics that go to Honeycomb, with the first being OpenTelemetry metrics that are emitted from software that you instrument. The most clear and mature example of this is the Java Agent instrumentation, which includes a host of metrics related to garbage collection and application health. The only thing needed to send these to Honeycomb is to decide on a metrics dataset and configure the agent with a few properties or environment variables.
After setting HONEYCOMB_METRICS_DATASET, any software instrumented with the Java Agent will start sending OpenTelemetry metrics data to Honeycomb. It even reuses the API key and endpoint assuming the data are all going to the same place.
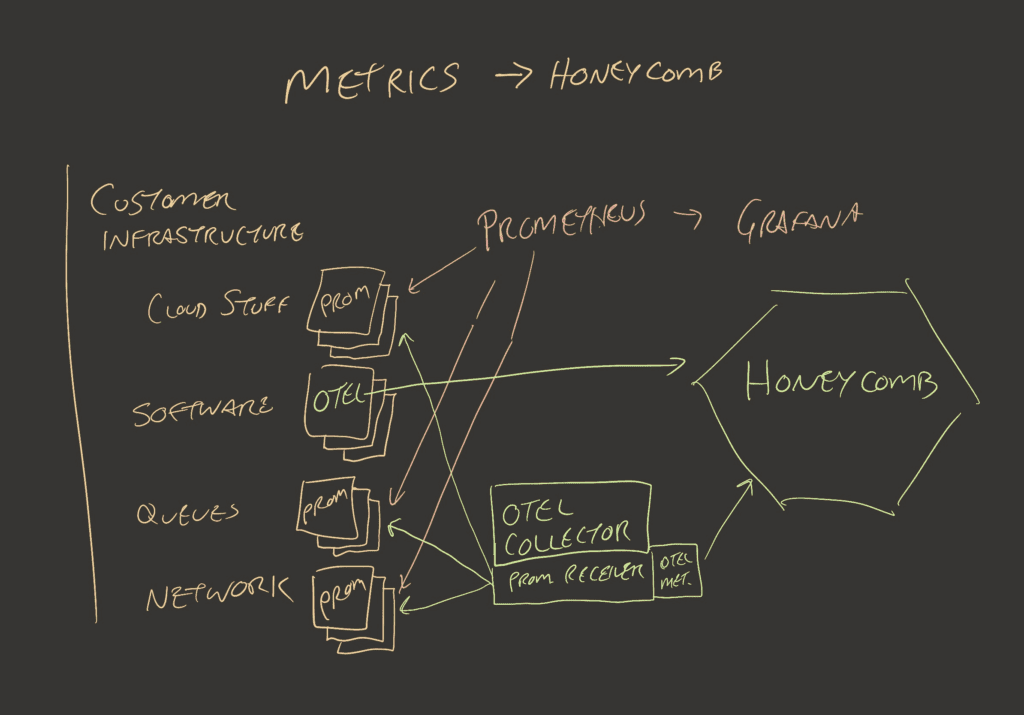
The second metrics flavor consists of metrics that the OpenTelemetry Collector can collect. There are currently OpenTelemetry metrics receivers for Prometheus, Host Metrics, OpenCensus, BIG-IP, and more. A good place to check, or even contribute to the OpenTelemetry metrics receivers, is in the otel-collector-contrib GitHub repository.
The easiest volume control for all of these is the frequency. This is the metrics analog for a sample rate, which controls the volume of events that are collected and sent to Honeycomb. For most receivers, it’s configured in the yaml using a key like scrape_interval or collection_interval. There are reasons to keep the interval low for certain pieces of infrastructure, but increasing it from one to 10 seconds can cut your event usage by 90%, still leaving you with six data points per minute (per dimension, per host).
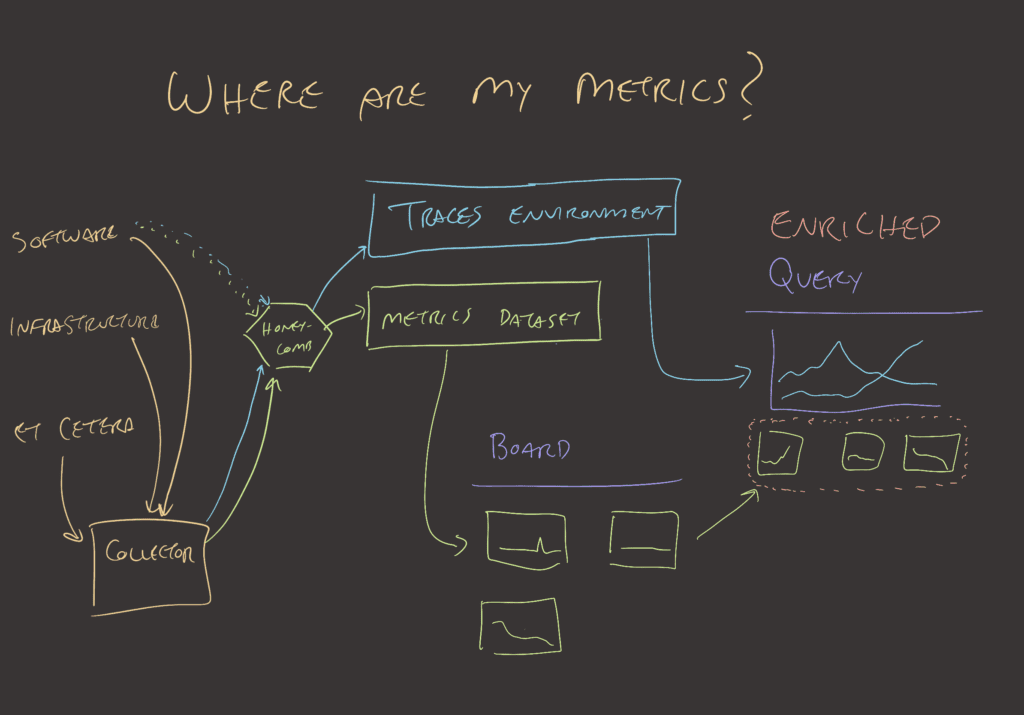
Where do metrics go in Honeycomb?
Honeycomb’s user experience is designed around asking questions with the query builder and getting answers that beg more questions. This investigation loop leads to points where you may want to look at a whole trace. For that, you’d go to the waterfall view. From there, you could select a group or area on a heatmap to surface BubbleUp’s findings. That may lead to a dead end where you’d need to reframe your question.
This whole experience starts with the idea that an external force has led you to ask questions. The typical metrics dashboard represents the opposite of this. It shows the answer to some predetermined set of questions, like “How much of something is depleted?” or “How many times has x thing happened?” To help with some of these known questions, create a Honeycomb Board that shows metrics that you care about.
Honeycomb even created a Terraform-based Board with prefabricated queries to support teams who use Refinery as a tail sampler. We know how Refinery typically behaves. We know what it looks like when it’s misbehaving. As such, this is a good starting point for investigations. This is an example of using Honeycomb Metrics instead of trace data.
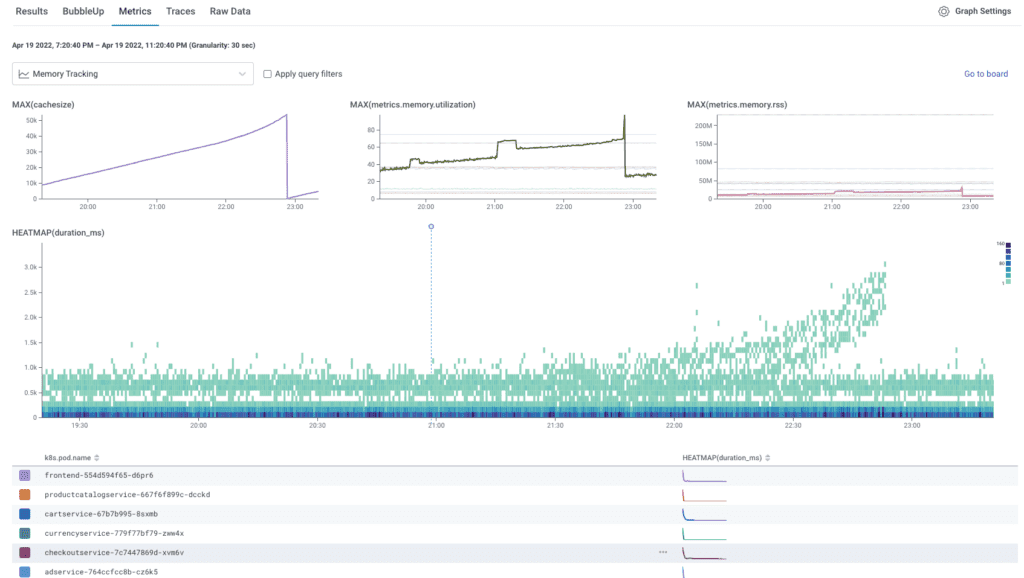
An explorative approach to metrics in Honeycomb is to evolve your metrics boards as your infrastructure sends more interesting information. The screenshot above shows a few CPU charts getting pulled into a query in a traces dataset. The metrics are sent to a metrics dataset since many services rely on the same infrastructure.
Datasets are the basic unit in Honeycomb that establishes a boundary around a schema and query. This has changed for traces, but metrics are still bound by this convention. Each environment or region within an environment likely has separate sets of metrics since the underlying infrastructure for each is different. Depending on each team’s deployment patterns, one or more metrics datasets may be required.
Sources of metrics
There are plenty of agents that emit or expose metrics, and many can go into an OpenTelemetry Collector. Once inside the Collector, one can apply several different processors to maximize value. Here are some examples:
- Receivers
- HostMetricsReceiver – get metrics similar to node exporter
- PrometheusReceiver – the Collector scrapes any Prometheus endpoints
- OtlpReceiver – can receive metrics from other collectors or agents
- Specific software has some receivers:
- Processors
- FilterProcessor – remove problematic labels
- GroupByAttrsProcessor – combine metrics before they get sent to Honeycomb
- K8sAttributesProcessor – enrich metrics with Kubernetes attributes
- TransformProcessor – modify metrics using OpenTelemetry Transform Language (OTTL)
If you use the Honeycomb Kubernetes agent, you’ll see the most commonly used metrics included in the node metric group. The Honeycomb Kubernetes agent’s metrics also include metric groups for pods, containers, and volumes. Since we created and maintain this agent, it compacts metrics very effectively.
How do I get value from these metrics?
A team that has metrics contexts available inside Honeycomb typically relies on it as a contextual signal for their investigations. The Boards functionality can be a nice place for reassurance that known resource depletion problems of the past stay in the past.
Each service will have its own metrics dataset configuration, which can be directed at different datasets depending on where relevant metrics are stored.
A team normally evolves from no metrics to many metrics. That process often looks like this:
- Send metrics to a metrics dataset in Honeycomb.
- Create boards based on the metrics that come in. If they’re about memory and CPU, make a board for those things. If it includes network figures, application information, or other things, you can create additional boards based on the question that these metrics answer.
- In the dataset configuration for each service, select the relevant metrics dataset so queries know what to present in the Metrics tab.
- Create alerts on known problems with depletion of resources.
- Add scraper configurations to the OpenTelemetry Collector to get more metrics from more places.
- Realize you’re using a lot more events than seems reasonable.
- Read the next section about how to manage event usage for metrics.
How to manage event usage for metrics
Events in Honeycomb consist of a timestamp identifier, and then as many columns as one wants to add (up to 2,000). Each metric object that arrives to Honeycomb consists of a few labels and a number representing the thing being measured.
Storing events this way in Honeycomb would be incredibly wasteful since you’d have four events for a set of metrics that express “node 1038 is running on arm64 architecture has 8 CPU cores, is using 20% average, 40% p99, 80% max.” Each event would be:
- timestamp: 2023-06-14 02:30:38.123, name: node 1038, arch: arm64, cpu_cores: 8
- timestamp: 2023-06-14 02:30:38.125, name: node 1038, arch: arm64, cpu_usage_avg: 20
- timestamp: 2023-06-14 02:30:38.131, name: node 1038, arch: arm64, cpu_usage_p99: 40
- timestamp: 2023-06-14 02:30:38.144, name: node 1038, arch: arm64, cpu_usage_max: 80
There are more practical/correct examples in the Honeycomb documentation but for explanation purposes, I’ve chosen to use a human-readable timestamp.
When the events are formatted as expected, the measurements above turn into a single event:
- timestamp: 2023-06-14 02:30:38, name: node 1038, arch: arm64
- cpu_cores: 8
- cpu_usage_avg: 20
- cpu_usage_p99: 40
- cpu_usage_max: 80
- … anything else with the same timestamp (rounded to the second), name, and arch without additional tags.
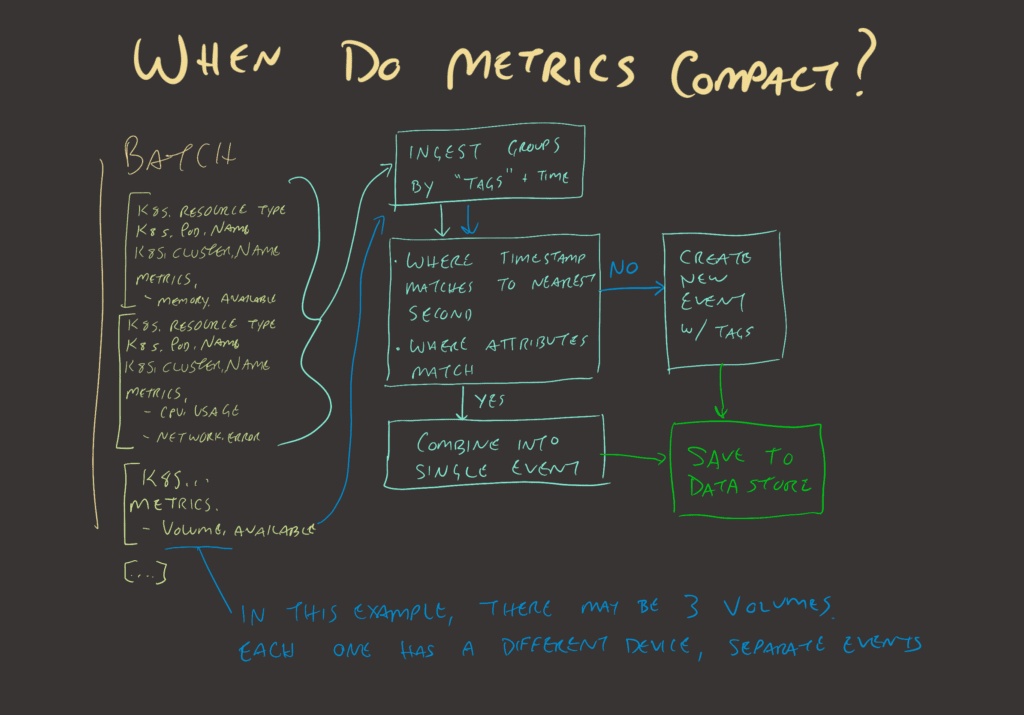
Following the flowchart, if a batch with a bunch of events arrives, Honeycomb looks for ways to coalesce them into as few events as possible. If the batch is one host with three network interfaces and five filesystem mounts, the first event will include most of the generic metrics for memory and CPU usage. Then, each of the three network interfaces will have an event, since the tag for the network interface device name is different. The same will hold true for filesystem metrics where the volume device and mount paths are different; they’ll each need their own event.
Depending on how the exporters are configured, Honeycomb can sometimes think it is detecting a distinct metric, when really, it has found a set of distinct tags. When this happens, telling the OpenTelemetry Collector to drop certain tag attributes, or configuring the scraper to suppress those tags, will remove unhelpful events.
The best method to do this is to configure your exporters, scrapers, Collectors, and Honeycomb dataset with defaults. Then, run the collection cycle for a minute or two. Open up the Honeycomb query builder for that dataset and use the raw data tab to see the events in tabular format.
It is normal to see a lot of empty white space in metrics datasets where CPU won’t be recorded in filesystem or network metrics. Scrolling horizontally, look for column headers that don’t belong.
Drop tags when they aren’t helpful
Some tags can confuse Honeycomb into thinking a measurement is being recorded when it’s actually metadata. Other times, a tag may force an unnecessary separation between events. The easiest solution for misbehaving tags is to use the Attribute Processor to drop them.
- key: label.kuberntes.io/part-of
action: deleteIf the label.kubernetes.io/part-of label causes you trouble, you can use the rule above as part of the attribute processor configuration to get rid of that rule.
- pattern: ^label\.longhorn\..
action: deleteIf the Longhorn labels clutter the dataset and you don’t think they’re valuable, you can also remove them by using the pattern approach of the attributes processor.
Keep in mind that Honeycomb provides arbitrarily wide events for any of these, so leaving additional stuff isn’t a cost issue, just schema aesthetics.
Modify metrics with the Metric Transform Processor
Further customization can be done using the Open Telemetry Collector’s Metric Transform Processor. If you need to do something fancier than dropping an attribute, this one can:
- rename fields
- change the order of magnitude for consistency (so everything is milliseconds instead of seconds)
- force a data type
- combine label sets or values
There are a ton of examples, some of which can be used to reduce event count, and others that can be used to improve the quality and consistency of data across different metrics exporters.
Example from the node exporter
Prometheus exporter for hardware and OS metrics exposed by *NIX kernels, written in Go, with pluggable metric Collectors.
The default node_exporter, if deployed to a single host, sends roughly 340 metrics per scrape. If you zoom in on a spike in Honeycomb to see a single scrape batch, you can see how the metrics map to events:
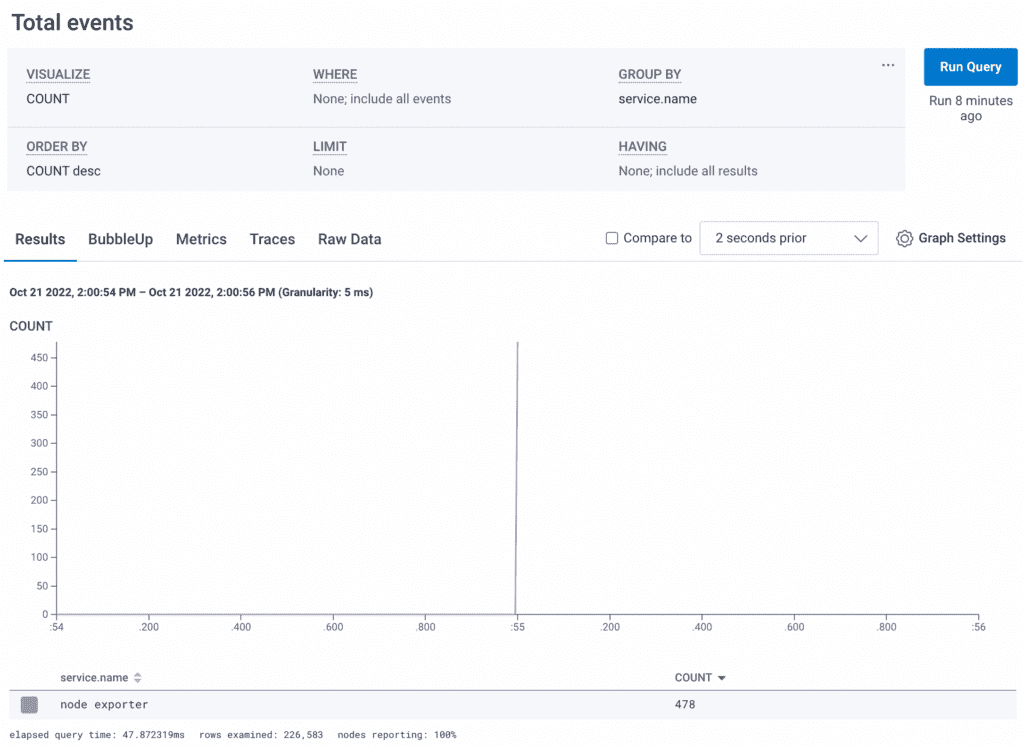
You’ll notice there are 478 events created from 340 metrics. There’s a good chance some of these aren’t compacted correctly. To dig in, click over to “Raw Data” and then the “CSV” link on the left side to download the tabular view of these metrics. If you have more than a thousand rows in a single scrape, you may need to split them up with a where clause into multiple groups of 1000 in order to perform a spreadsheet-style review.
Open the CSV in your favorite spreadsheet application and look for rows that aren’t helpful. Each row counts as an event, so managing the event count means eliminating any row that isn’t valuable. One way that I comb through the CSV is to remove the metadata that’s on every row—fields like service.name, service.instance.id, http.scheme, net.host.name, and net.host.port. After, look for rows that have useful stuff in them and hide them. Some rows may appear blank, so I copy them into a new blank sheet (along with the header row) and delete all the empty cells. Whatever is left is the hint at what metric is attempting to be recorded.
One example of a nearly empty row is a row that only contains these: node_nfsd_requests_total = 0, method has some data, proto = 3 or 4.
- These rows come from an NFS share that hasn’t been connected to
- Even rows that have a value for the total do not have a path listed so they’re not particularly actionable
- The node exporter docs say these come from /proc/net/rpc/nfsd
# cat /proc/net/rpc/nfsd
rc 0 0 191879
fh 0 0 0 0 0
io 0 0
th 8 0 0.000 0.000 0.000 0.000 0.000 0.000 0.000 0.000 0.000 0.000
ra 32 0 0 0 0 0 0 0 0 0 0 0
net 191880 0 191880 2
rpc 191879 0 0 0 0
proc3 22 0 0 0 0 0 0 0 0 0 0 0 0 0 0 0 0 0 0 0 0 0 0
proc4 2 0 191879
proc4ops 72 0 0 0 38 0 0 0 0 0 191656 110 0 0 0 0 74 0 0 0 0 0 0 191616 0 74 0 0 0 0 0 0 0 0 0 0 0 0 0 0 0 0 0 2 4 2 0 0 0 0 0 0 0 36 191869 0 0 0 0 2 0 0 0 0 0 0 0 0 0 0 0 0 0There’s another presentation of this same data by using the nfsstat command. It looks like this:
# nfsstat
Server rpc stats:
calls      badcalls   badfmt     badauth    badclnt
192596     0          0          0          0

Server nfs v4:
null             compound
0         0%     192596  100%

Server nfs v4 operations:
op0-unused       op1-unused       op2-future       access           close
0         0%     0         0%     0         0%     40        0%     0         0%
commit           create           delegpurge       delegreturn      getattr
0         0%     0         0%     0         0%     0         0%     192369   33%
getfh            link             lock             lockt            locku
116       0%     0         0%     0         0%     0         0%     0         0%
lookup           lookup_root      nverify          open             openattr
78        0%     0         0%     0         0%     0         0%     0         0%
open_conf        open_dgrd        putfh            putpubfh         putrootfh
0         0%     0         0%     192327   33%     0         0%     78        0%
read             readdir          readlink         remove           rename
0         0%     0         0%     0         0%     0         0%     0         0%
renew            restorefh        savefh           secinfo          setattr
0         0%     0         0%     0         0%     0         0%     0         0%
setcltid         setcltidconf     verify           write            rellockowner
0         0%     0         0%     0         0%     0         0%     0         0%
bc_ctl           bind_conn        exchange_id      create_ses       destroy_ses
0         0%     0         0%     2         0%     4         0%     2         0%
free_stateid     getdirdeleg      getdevinfo       getdevlist       layoutcommit
0         0%     0         0%     0         0%     0         0%     0         0%
layoutget        layoutreturn     secinfononam     sequence         set_ssv
0         0%     0         0%     38        0%     192586   33%     0         0%
test_stateid     want_deleg       destroy_clid     reclaim_comp     allocate
0         0%     0         0%     0         0%     2         0%     0         0%
copy             copy_notify      deallocate       ioadvise         layouterror
0         0%     0         0%     0         0%     0         0%     0         0%
layoutstats      offloadcancel    offloadstatus    readplus         seek
0         0%     0         0%     0         0%     0         0%     0         0%
write_same
0         0%     # nfsstat
Server rpc stats:
calls      badcalls   badfmt     badauth    badclnt
192596     0          0          0          0

Server nfs v4:
null             compound
0         0%     192596  100%

Server nfs v4 operations:
op0-unused       op1-unused       op2-future       access           close
0         0%     0         0%     0         0%     40        0%     0         0%
commit           create           delegpurge       delegreturn      getattr
0         0%     0         0%     0         0%     0         0%     192369   33%
getfh            link             lock             lockt            locku
116       0%     0         0%     0         0%     0         0%     0         0%
lookup           lookup_root      nverify          open             openattr
78        0%     0         0%     0         0%     0         0%     0         0%
open_conf        open_dgrd        putfh            putpubfh         putrootfh
0         0%     0         0%     192327   33%     0         0%     78        0%
read             readdir          readlink         remove           rename
0         0%     0         0%     0         0%     0         0%     0         0%
renew            restorefh        savefh           secinfo          setattr
0         0%     0         0%     0         0%     0         0%     0         0%
setcltid         setcltidconf     verify           write            rellockowner
0         0%     0         0%     0         0%     0         0%     0         0%
bc_ctl           bind_conn        exchange_id      create_ses       destroy_ses
0         0%     0         0%     2         0%     4         0%     2         0%
free_stateid     getdirdeleg      getdevinfo       getdevlist       layoutcommit
0         0%     0         0%     0         0%     0         0%     0         0%
layoutget        layoutreturn     secinfononam     sequence         set_ssv
0         0%     0         0%     38        0%     192586   33%     0         0%
test_stateid     want_deleg       destroy_clid     reclaim_comp     allocate
0         0%     0         0%     0         0%     2         0%     0         0%
copy             copy_notify      deallocate       ioadvise         layouterror
0         0%     0         0%     0         0%     0         0%     0         0%
layoutstats      offloadcancel    offloadstatus    readplus         seek
0         0%     0         0%     0         0%     0         0%     0         0%
write_same
0 0% Taking a look at the source for these data points, they’re not presented in a way that I find helpful. In this case, I will edit the node exporter command to include the --no-collector.nfsd argument. For NFS mounts from the client side, you can still get information since they show up in filesystem metrics. If the main purpose of one of your servers is hosting NFS shares, then these metrics may be of vital importance to you. Not so for my case.
What if most of these node exporter metrics aren’t useful?
One option is to use a different agent that is preconfigured to address your needs. The OpenTelemetry Collector can get at quite a few host metrics.
You can always take the more deliberate approach by disabling defaults and only enabling valuable metrics. In node exporter, you can use the --collector.disable-defaults flag and then only enable those of interest to you. The list is well documented in the GitHub project’s README.md file.
If you see columns you want to get rid of, they can be removed by changing configurations in the node exporter. Or, delete them in the OpenTelemetry Collector using the attribute processor.
That’s a lot of work!
It can be a lot of work. The example shows what you can do in a case where your tooling has lots of flexibility and lots of noise. Certain cloud metrics are difficult to wrangle, so these approaches come in handy.
The good news is, for most of your systems, you can do this work once to establish the kinds of metrics you need and then apply it across the board. The node exporter is designed for ultimate flexibility and granularity. These capabilities also bring the requirement that the emitted metrics be tuned heavily.
Conclusion
Adding metrics to Honeycomb is pretty easy, but optimizing them for usability and cost can take a bit of work. We hope that the tools available here make it a smooth process to get from confusion and frustration to reduced MTTR and increased confidence in your production systems.
For more discussion of metrics in Honeycomb or the OpenTelemetry community, join the #discuss-metrics channel in our Pollinators Slack. You can also read this blog on how Heroku uses metrics in Honeycomb.
Want to know more?
Talk to our team to arrange a custom demo or for help finding the right plan.