Incident Review: What Comes Up Must First Go Down
On July 25th, 2023, we experienced a total Honeycomb outage. It impacted all user-facing components from 1:40 p.m. UTC to 2:48 p.m. UTC, during which no data could be processed or accessed. This outage is the most severe we’ve had since we had paying customers. In this review, we will cover the incident itself, and then we’ll zoom back out for an analysis of multiple contributing elements, our response, and the aftermath.

By: Fred Hebert
On July 25th, 2023, we experienced a total Honeycomb outage. It impacted all user-facing components from 1:40 p.m. UTC to 2:48 p.m. UTC, during which no data could be processed or accessed.
This outage is the most severe we’ve had since we had paying customers. In this review, we will cover the incident itself, and then we’ll zoom back out for an analysis of multiple contributing elements, our response, and the aftermath.
This post represents an overview of the incident and our response. For a more detailed view, download the full report [PDF].
The incident
Late on July 24th, we switched between two clusters of Retriever (our storage and query engine) to avoid a subtle bug. This is a routine change we’ve done multiple times in the past, which we knew to be safe.
Hours later, our internal SLO for Shepherd (our ingest service) started slowly burning. The engineers decided that since the problem was just a marginally slow, inconsistent performance burn with a lack of good explanation, this was a minor issue that could be investigated in the morning.
In the morning, our engineers found a chart that explained the performance issues:
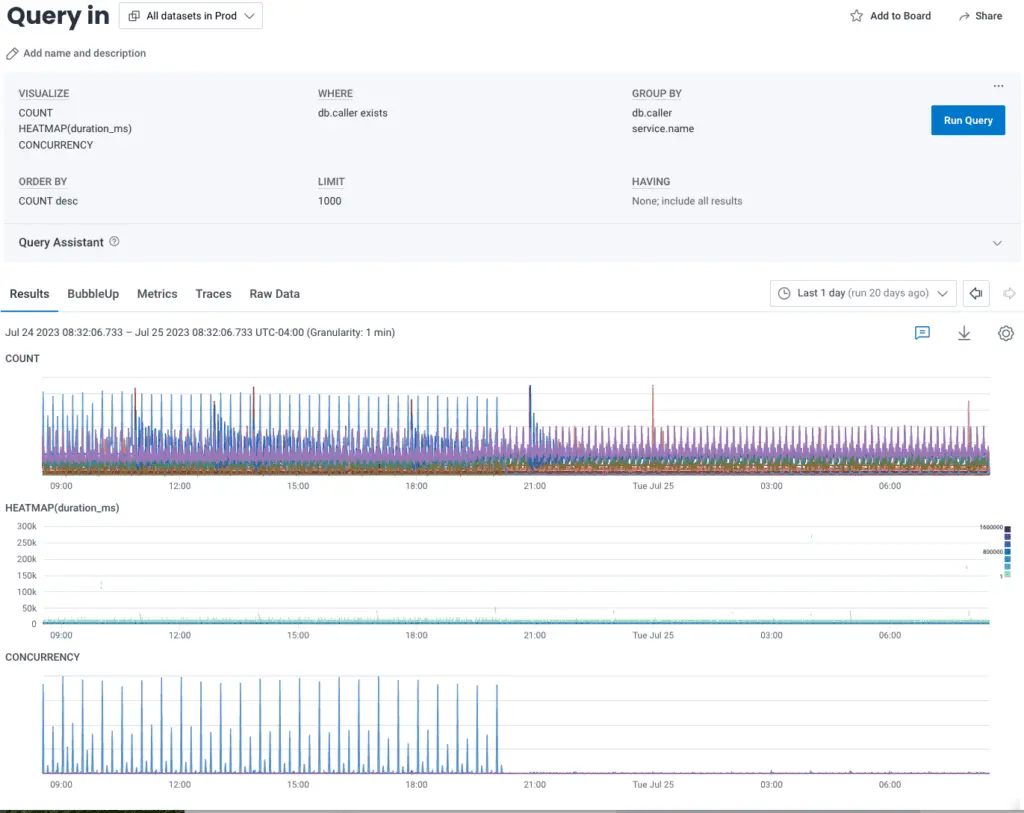
The blue lines that suddenly stop are database calls. They are sent when Retriever updates the records containing the last time we received data for any field or dataset.
This is used by our caching mechanism to know which dataset schemas we needed to refresh and keep warm for the ingest service. The query engine cluster somehow failed to write them after the switch, which undermined the ingest cache, explaining the performance issues:
Thinking something was wrong with the cluster’s writes, we flipped only the writes back to the other cluster by toggling a feature flag—a flag we had used often without issues—so we could update the stamps and bypass the bug we still had to address. This did not fix it.
We eventually noticed a subtle implementation bug: whenever we switched the flag, any host that was told to stop never tried again even if the flag was switched back. A full reboot was required for writes to migrate over to a cluster whose cache writes had previously been turned off.
The flaw was present all along, but was hidden by our deployment mechanism often running in parallel with migrations and restarting hosts. The most recent flip had fully stopped any remaining writes that kept the system alive.
The moment we understood this, we wrote a command to restart our query engine’s cluster without interfering with other critical features (querying and alerting). But right before the command was ready, the database seized up, we ran out of connections, and our entire system crashed.
We knew from past experience that ingest outages may require manual circuit-breaking of all traffic just to come back from a death spiral. But bringing ingest back without a cache would make it go down again, either through overload or database connection saturation. We first had to make sure the database was available, and only then restart all of the Retriever hosts to provide the data for the cache:

We set up circuit-breakers and denied all Shepherd traffic with a 5xx error to protect the database.
We then tried to save the database host, but it was hard locked. We had to fail over to a replica instead, which brought the database back up, along with all services that depend on it.
We then manually updated the ‘last written’ timestamp of all schemas that had seen traffic in the last day and marked it as “now” so the schema store would reload it all—manually reloading all data in the cache. This introduced incorrect data in parts of our UI that tell you how fresh data is.
We then brought ingest back fully by removing the circuit-breaker, and restored full querying capacity given some hosts required extra restarts—the database faults made them fail some internal checks. Honeycomb was healthy again.
Analysis
As we ran our incident investigation and review, multiple interesting threads came up. They are explored in depth in the full report, but here are the high-level notes about how our database died, contributing factors, and corrective items.
How a database dies
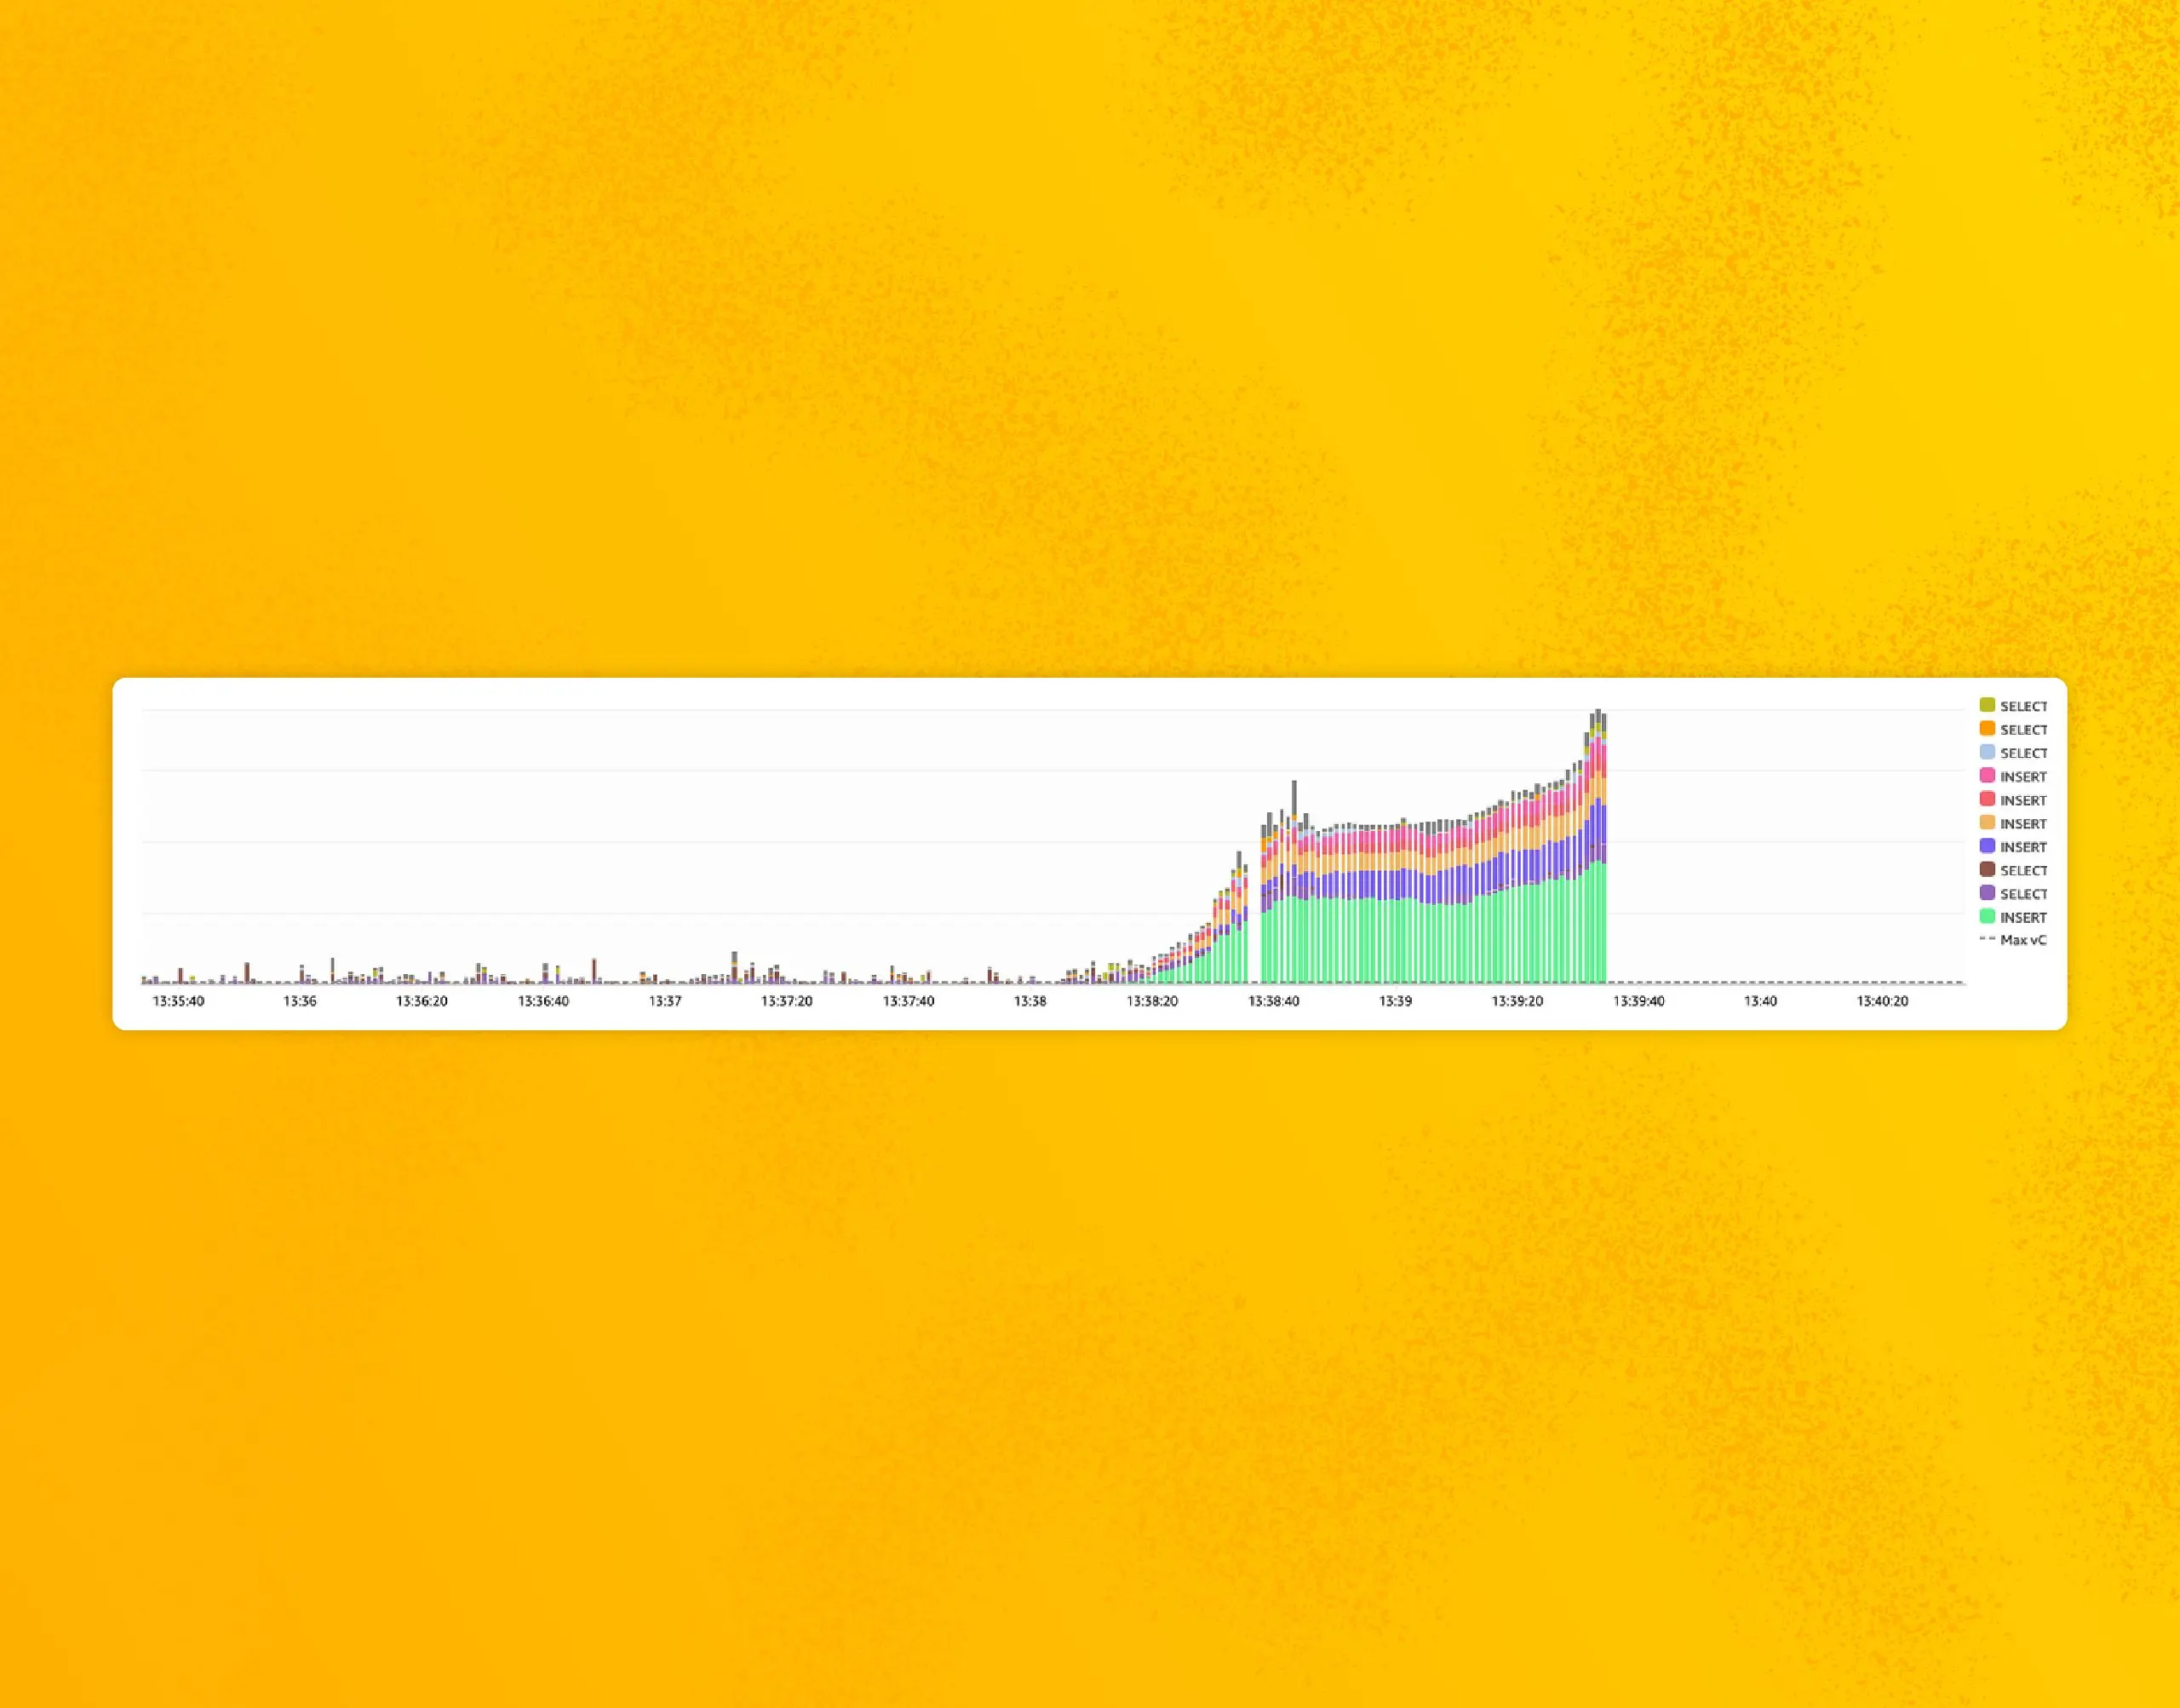
The core of the database failure was a deadlock in MySQL’s internals. There’s no clear path on how we specifically got there, but since this is a concurrency issue, we think it’s non-deterministic, and the more loaded the database is, the higher the likelihood of hitting these rare bugs. Here’s what we observed:
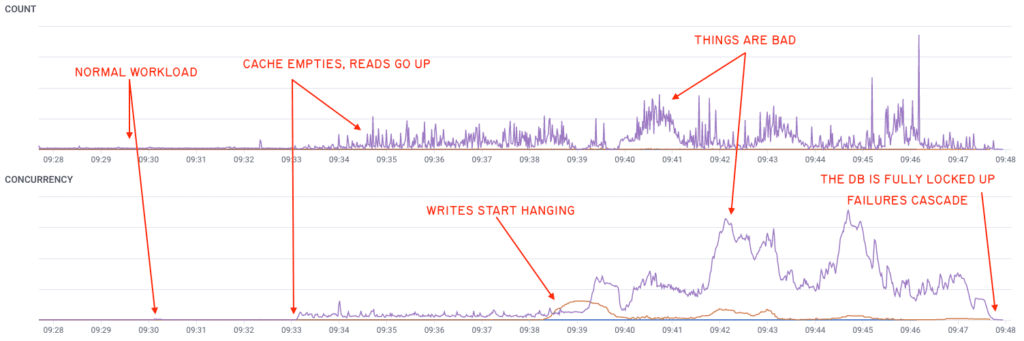
As our cache mostly stopped working, the amount of reads (in purple) shot up, overloaded the database, and then a few writes (in orange)—nothing abnormal—seemingly triggered a rare race condition in the MySQL internals, locking thread after thread of the database, until operations piled up.
The database ran out of connections, and our services died when they were unable to get the information they needed. This internal deadlock further explains why we weren’t able to recover without a failover: any interaction with a stuck thread got stuck waiting on the same lock as well.
Contributing factors
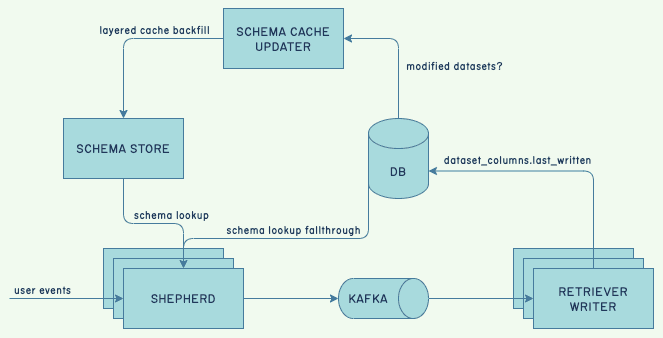
We run multiple MySQL databases via RDS. Although we have many, there’s a “main” database that contains data such as user accounts, permissions, and data schemas—to name the most critical ones. No such database contains customer events, which are stored by Retriever, but they are necessary for the overall system to work.
Our schema cache protects this database, and the ingestion of data is required to keep the cache warm. If this shared cache isn’t around, services can still update a local memory cache on their own and run for a good while, as long as the database does not die—which is what happened.
This creates a web of indirect dependencies, and things going wrong in one end of the environment can end up degrading service for another. Many of these are set up because they are more economical and less risky than not having them.
Similarly, other locally good decisions interacted in unexpected ways:
- The query engine updated the timestamps to the database because it already had to see all the data, and it ensured consistency between queries and the interface.
- The shared cache helps scale ingest, but is also part of an effort to clean up and normalize schema usage—a step in making it easier to untangle the “main” database.
- We believed the failover of the primary database would be costly because we had seen inadequate performance issues when failing over in read replicas in the past.
- We were migrating clusters to avoid a bug.
- Frequent deploys hid the feature flag bug.
- We paused deployments to prevent interference with the investigation.
Preventing a bug by switching to the old infrastructure set up the stage. We suspended deployments during the investigation, which prevented restarts accidentally making the feature flags work. Recovery on the database was slowed down by prior near-misses making us believe performance would suffer for longer than observed.
It is a bit ironic how feature flags, frequent deploys, suspending deploys during incidents, and learning from prior near-misses all technically contributed to this incident, while being some of the most trusted practices we have to make our system safer.
Corrective actions
For the duration of the outage, no new data could be ingested. If our users or customers did not buffer this data to disk somewhere to replay it later, it is gone for good. This had knock-on effects on alerting and querying during the outage, but the ingestion gap stays visible for as long as we hold data.
We’re exploring future architectures that may mitigate the impact of such incidents and their implications. We are looking at ways to strengthen the cache further, mechanisms to lower the amount of contention we put on our database during “update” storms from new schemas, and to stabilize the performance costs of some operations within our system. We are studying them along with other measures, including those related to instrumentation or experimentation to better detect and handle such edge cases, in order to find the better trade-offs.
In the short term, the chances of an incident happening with this specific failure mode have been drastically reduced: our migration is complete and we have already removed all code that could disable writes behind the cache. Our expected response time is likely to be faster since we’ve learned that a database failover is fastest for unlikely lockups of this kind.
Conclusion
While we wish such incidents wouldn’t happen, we know that we’ll have to manage them—no matter how hard we plan for them. One of the most intriguing themes that came up from many of our recent incidents and near-misses is how often one of their contributing factors has been trying to avoid a subtle bug we discovered—only to end up with a bigger unforeseen outage at the end.
We hope that we’ve been able to illustrate the complexity and richness behind this outage.
Some of the patterns in incident response mentioned here may feel familiar with some of our readers. If you’ve seen similar things and want to discuss them with us, reach out to us in Pollinators, our Slack community. And, you can read our full incident report now.
Want to know more?
Talk to our team to arrange a custom demo or for help finding the right plan.