Ingesting HTTP Access Logs from AppService
Debugging application performance in Azure AppService is something that’s quite difficult using Azure’s built-in services (like Application Insights). Among some of the issues are visualizations, and the time it takes to be able to query data. In this post, we’ll walk through the steps to ingest HTTP Access Logs from Azure AppService into Honeycomb to provide for near real-time analysis Access Logs.

By: Martin Thwaites
Debugging application performance in Azure AppService is something that’s quite difficult using Azure’s built-in services (like Application Insights). Among some of the issues are visualizations, and the time it takes to be able to query data. In this post, we’ll walk through the steps to ingest HTTP Access Logs from Azure AppService into Honeycomb to provide for near real-time analysis Access Logs.
This is supplemental to the awesome post by Brian Langbecker on using Honeycomb to investigate the Application Load Balancers (ALB) Status Codes in AWS. Since Azure AppService also has a Load Balancer serving the application servers, we can use the same querying techniques to investigate AppService performance. This also has the added bonus that AppService Logs are generated less than every 60 seconds as opposed to 5 minutes on ALBs.
There are some differences in the fact that we don’t have a `backend_status_code` like ALBs as they’re considered one and the same.
What is Azure AppService?
AppService is Azure’s platform for Managed Application Hosting. The service abstracts the developers and engineers away from the infrastructure that’s needed to host resilient applications that include fault tolerance, auto-scaling, and even edge-based authentication. It supports .NET, and also Python, Node.js, and Java, making it a very easy hosting platform for users.
What are HTTP Access Logs?
Almost all web servers are willing to write every request to a log file. This data can be very useful to understand the usage of your site. These contain things like the URL that was hit, along with other useful information, like the Client IP Address and the Time Taken.
Access Logs allow you to ask questions like:
- What Client IP address is hitting my site most?
- Which URLs are being hit most often?
- What’s the duration of requests to certain URLs?
- How many 500 response statuses are being sent?
Being able to ask these questions can provide vital analysis of your user’s overall health and experience of the application.
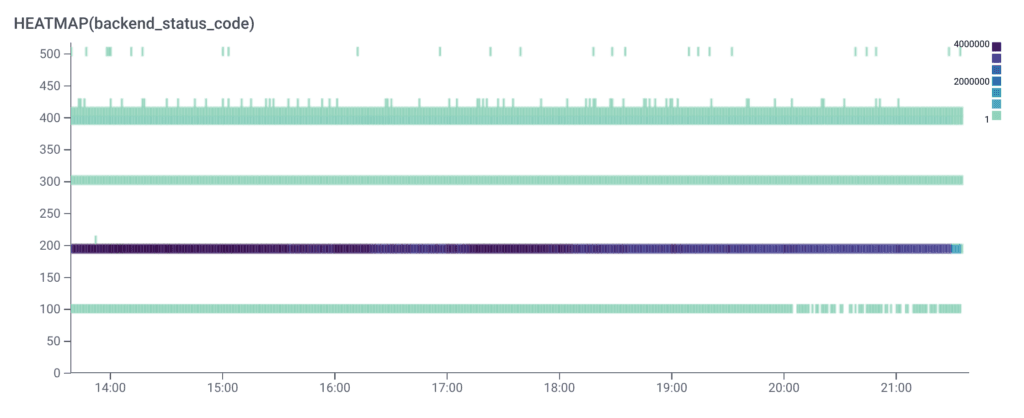
Leveraging an observability tool like Honeycomb, you can take these logs, and easily conduct an interesting exploratory analysis to find outliers in user experience, such as how the distribution of status codes in your application looks.
AppService logging
As Azure AppService includes a Load Balancer for distributing traffic, AppService then provides a mechanism for exporting the HTTP Access Logs for analysis. There are multiple options available when setting this up, with the simplest being to write files into Azure Blob Storage. For what we’re going to do, we want something a little more real-time than files persistent to a storage mechanism, and therefore, we’re looking for something that will stream that data into Honeycomb. What we need for this is Azure Event Hubs.
Azure Event Hubs is a streaming event service that is compatible with Apache Kafka. Azure Monitor, and therefore, AppService Diagnostic Logs can integrate with this service and stream all its’ Access Logs into it. AppService can stream more than just Access Logs, like Metrics and Platform Audit logs. We’ll cover those in future posts.
With the Azure AppService logs, you’ll be able to ask questions like:
- What Client IP is hitting my AppService most?
- Which specific URLs in my app, deployed using AppService, are slow?
- How often am I seeing 500 errors?
In addition, you’ll be able to use this data to generate SLOs for these characteristics, turning your Azure AppService into something that is production grade.
Let’s get started
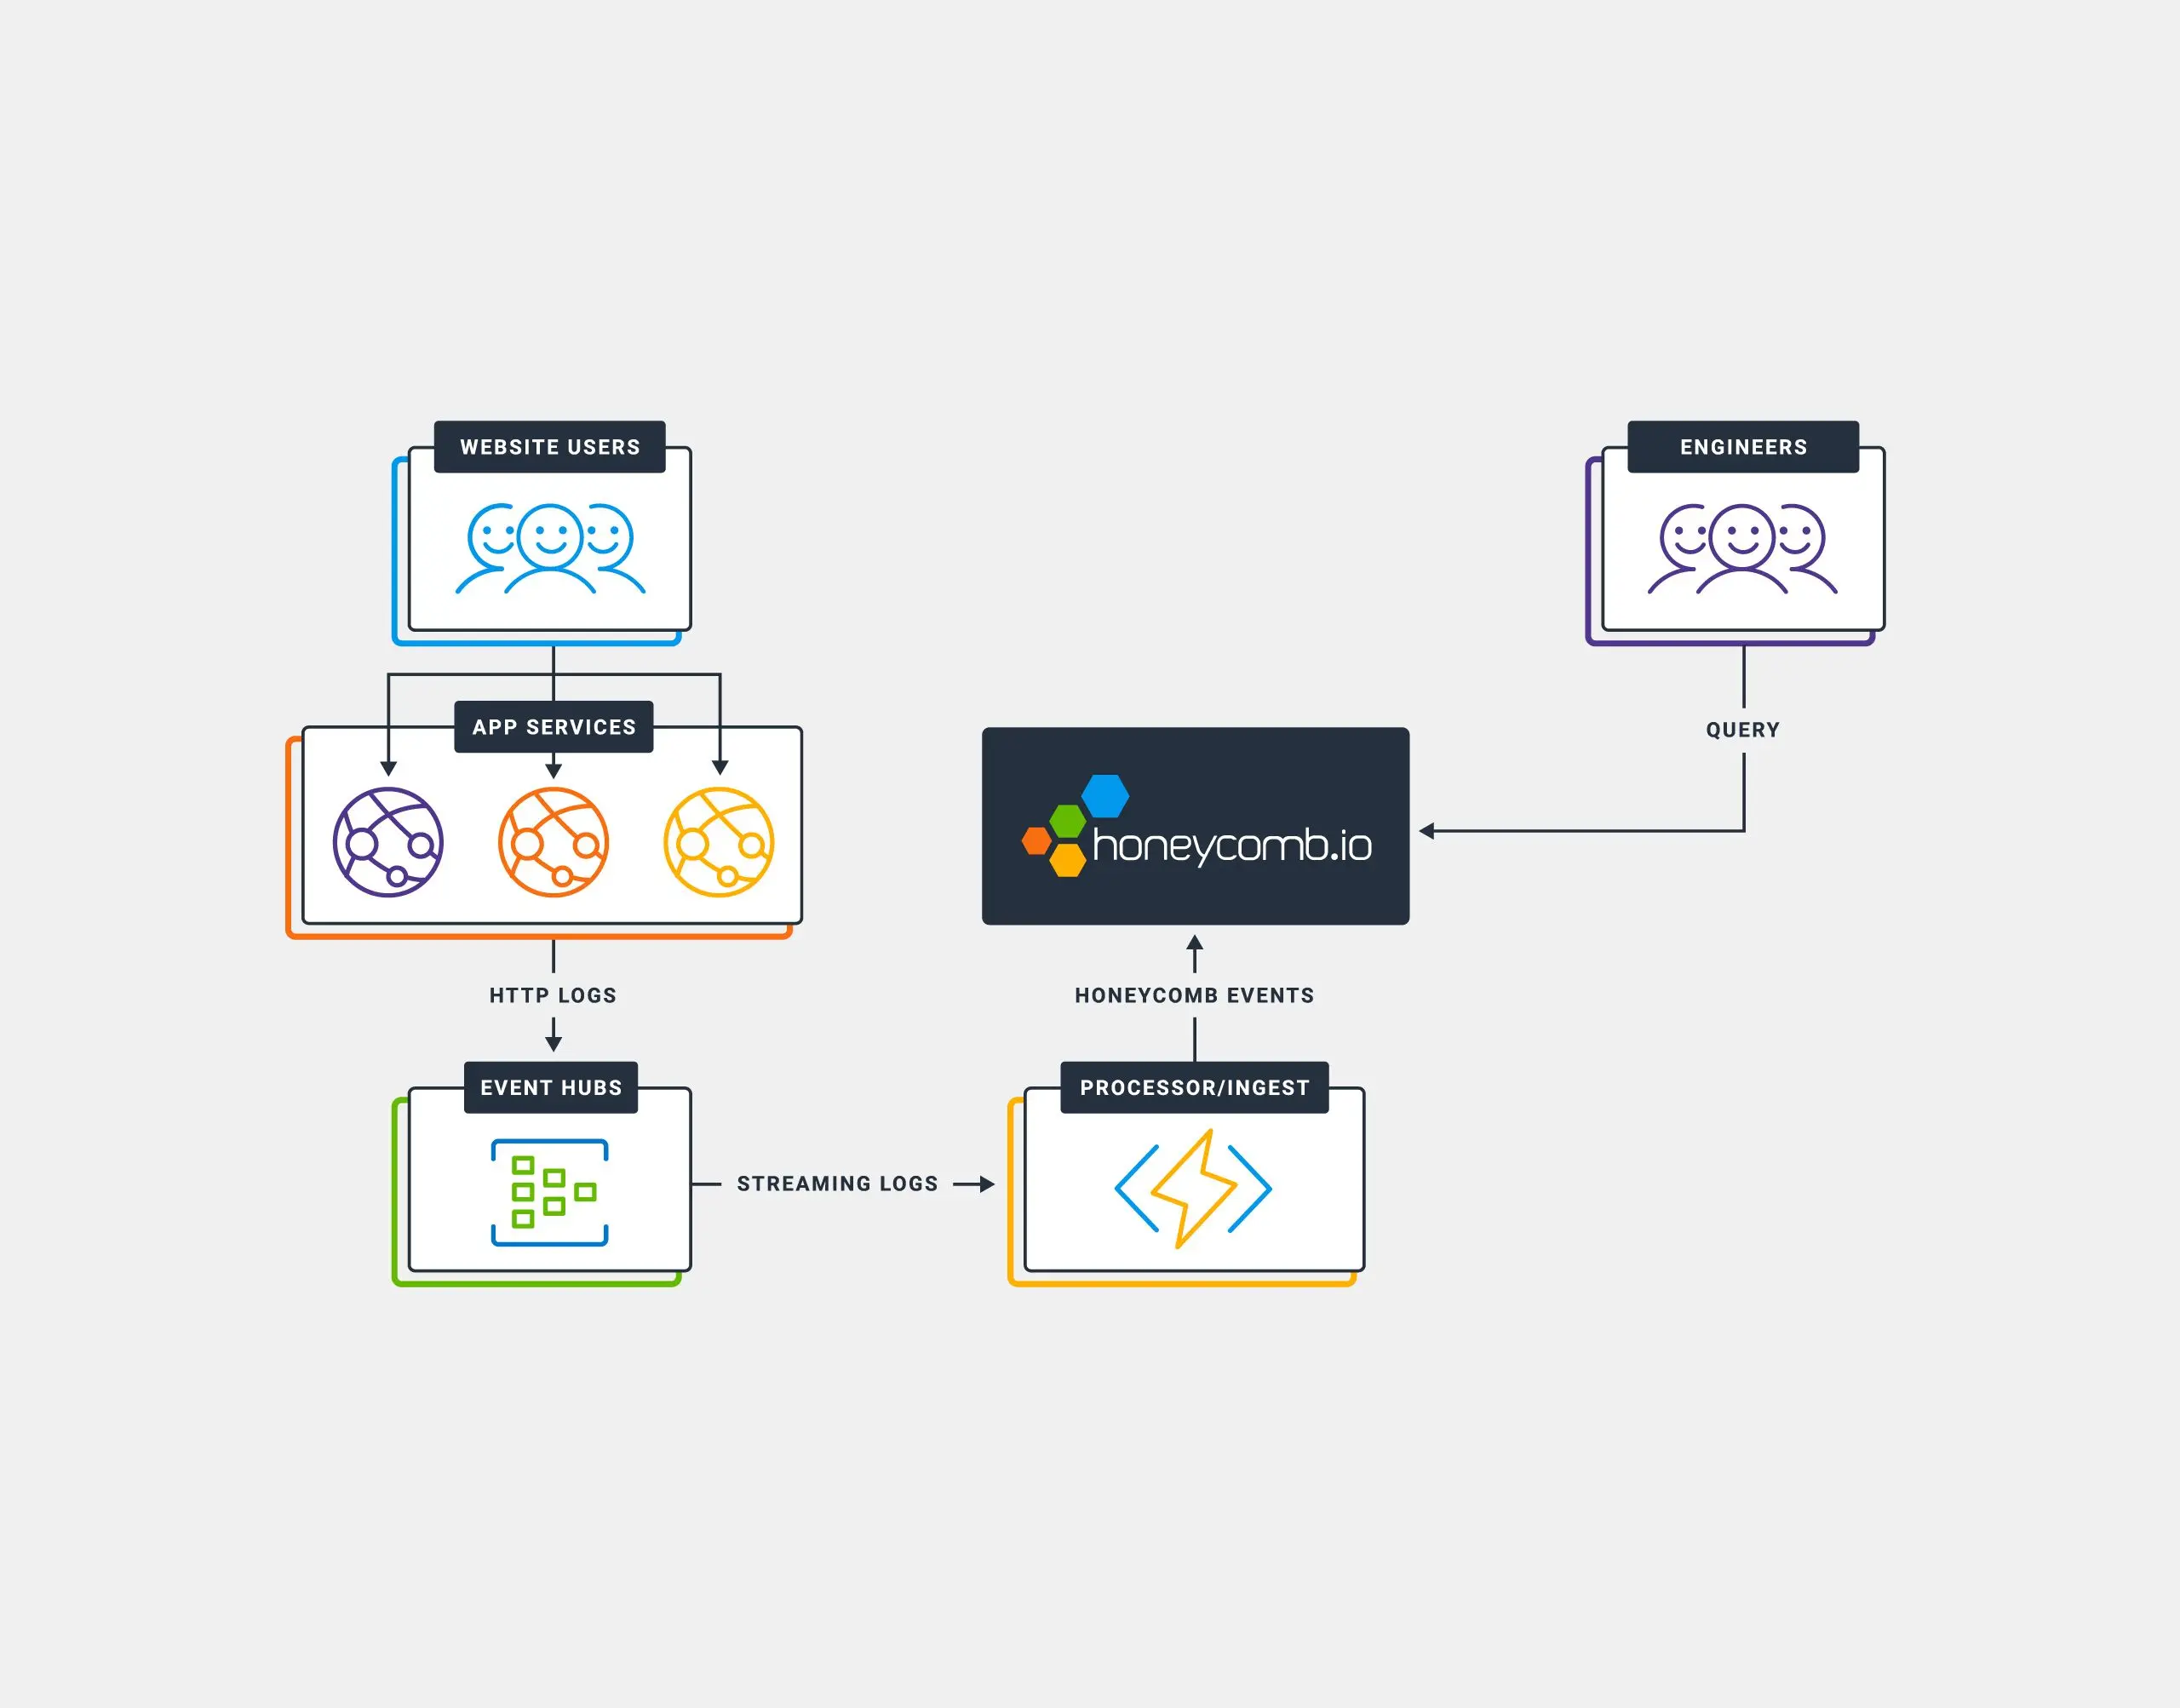
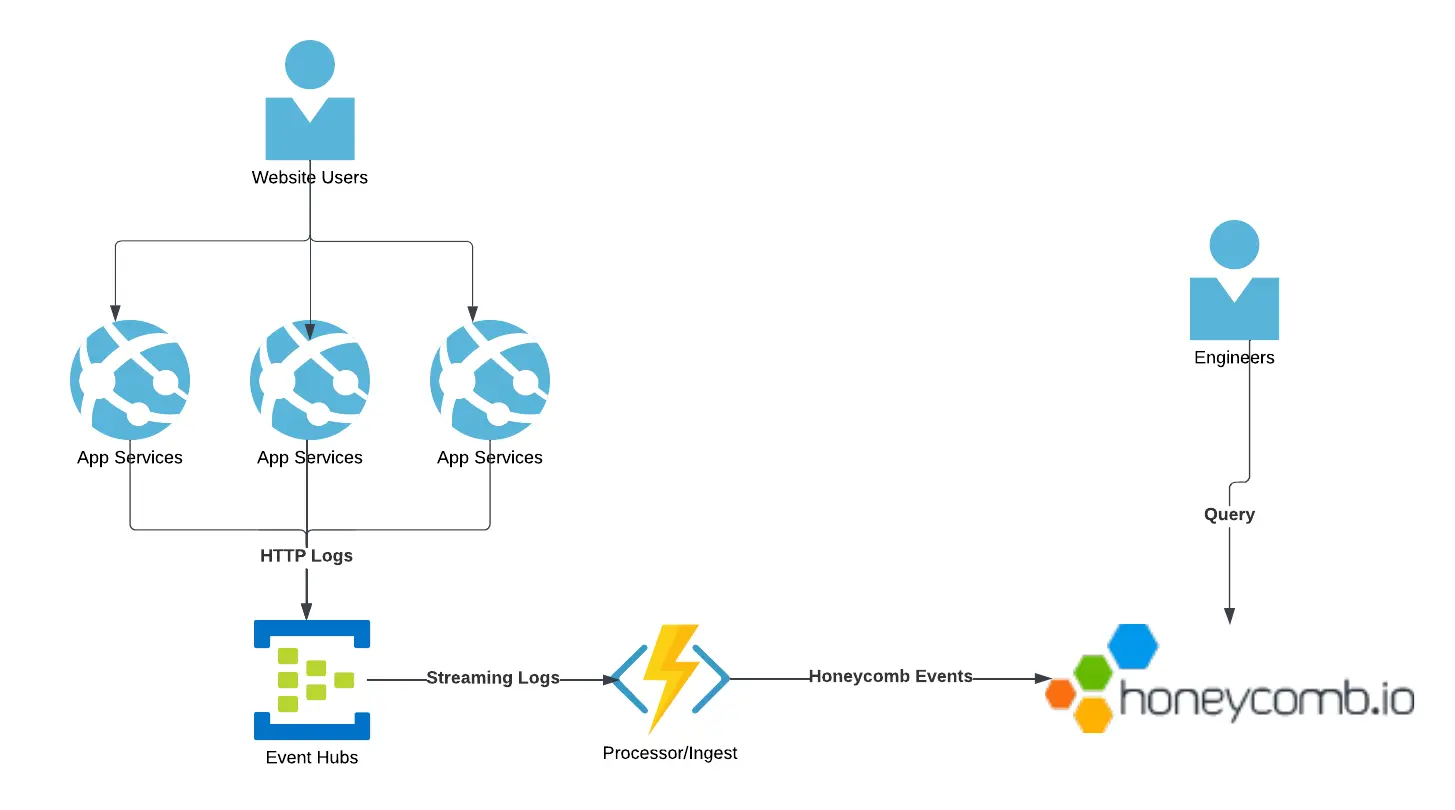
We’re going to need to set up a few services for this to work, and also upload some custom code. The solution will look like this:
Prerequisites:
- An AppService that you want to monitor
- Contributor rights to the AppService
- Access to create an Azure Event Hub Namespace
- Access to create an Azure FunctionApp
- Honeycomb account (our free tier will work great depending on how active your site is)
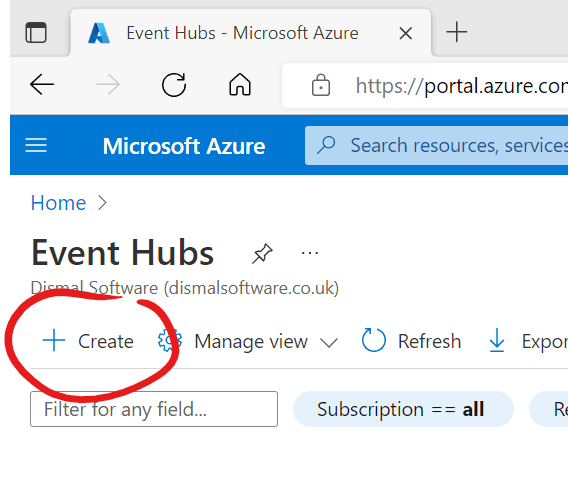
Step 1: Create Azure Event Hub Namespace
Search for Event Hubs in the Azure Portal and click Create.
You’ll need to select a subscription, and a resource group.
Note: Your subscription doesn’t need to be the one where the AppService exists, it just needs to be within the same Azure Directory (Azure Active Directory Tenant).
Next, you’ll need to give it a name. It needs to be globally unique across the entirety of Azure, not just your subscription or tenant.
For the purpose of this tutorial, we’re going to use the Basic tier, which is around $11 (USD) per month. With a lot of traffic, this will scale and you’ll be charged more. I can only suggest that you monitor the cost to avoid not having an unbounded expense.
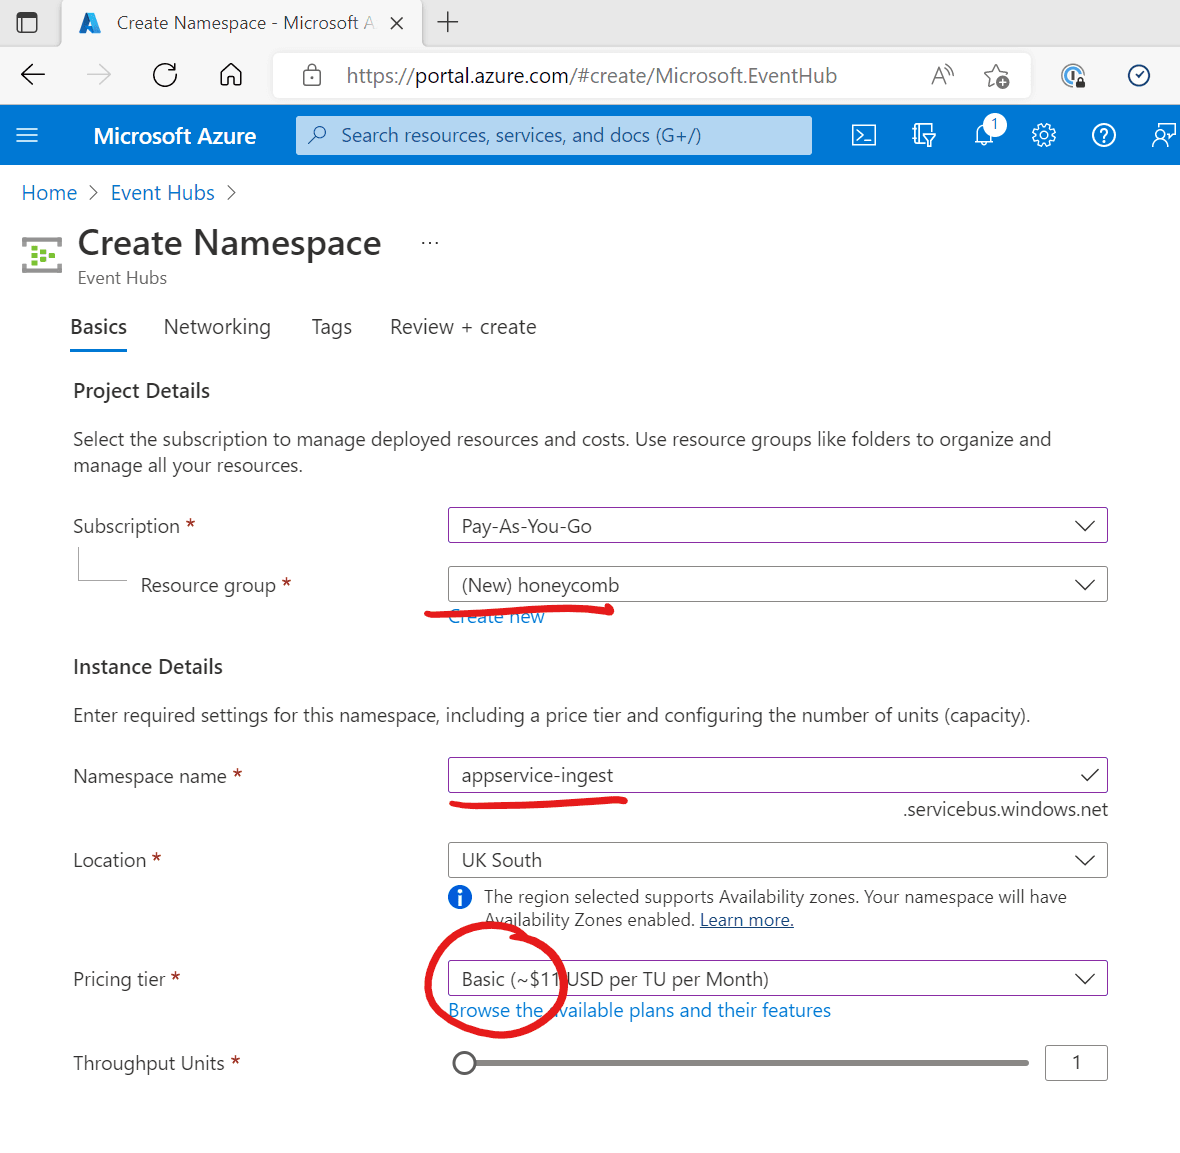
For the Location, you can choose wherever you want.
Step 2: Enable Diagnostic logs and send to the Event Hub
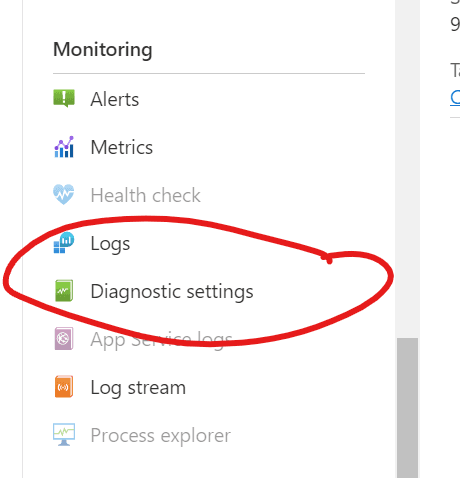
Click “Add Diagnostic Setting.”
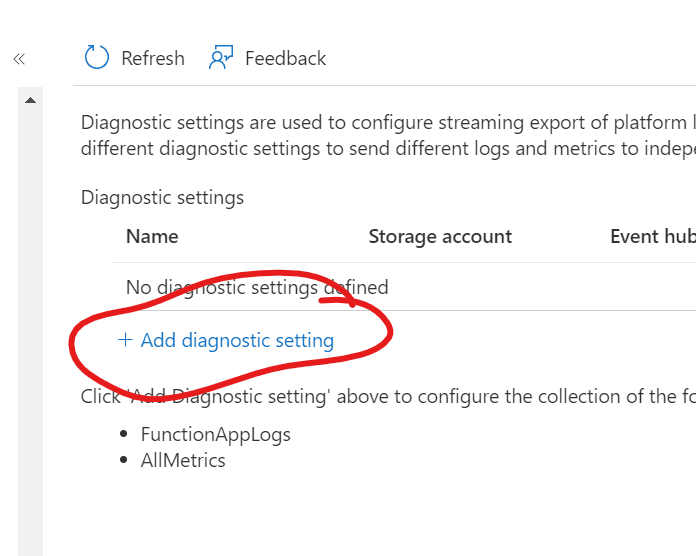
From here, we can choose the types of logs we want to send—and where.
Enable “AppServiceHTTPLogs”, and forward them to our Event Hub namespace. The important thing to note here is that you should be using the option “(Create in Selected Namespace)” in the Event Hub name field. This will create the Event Hubs for us with predictable names.
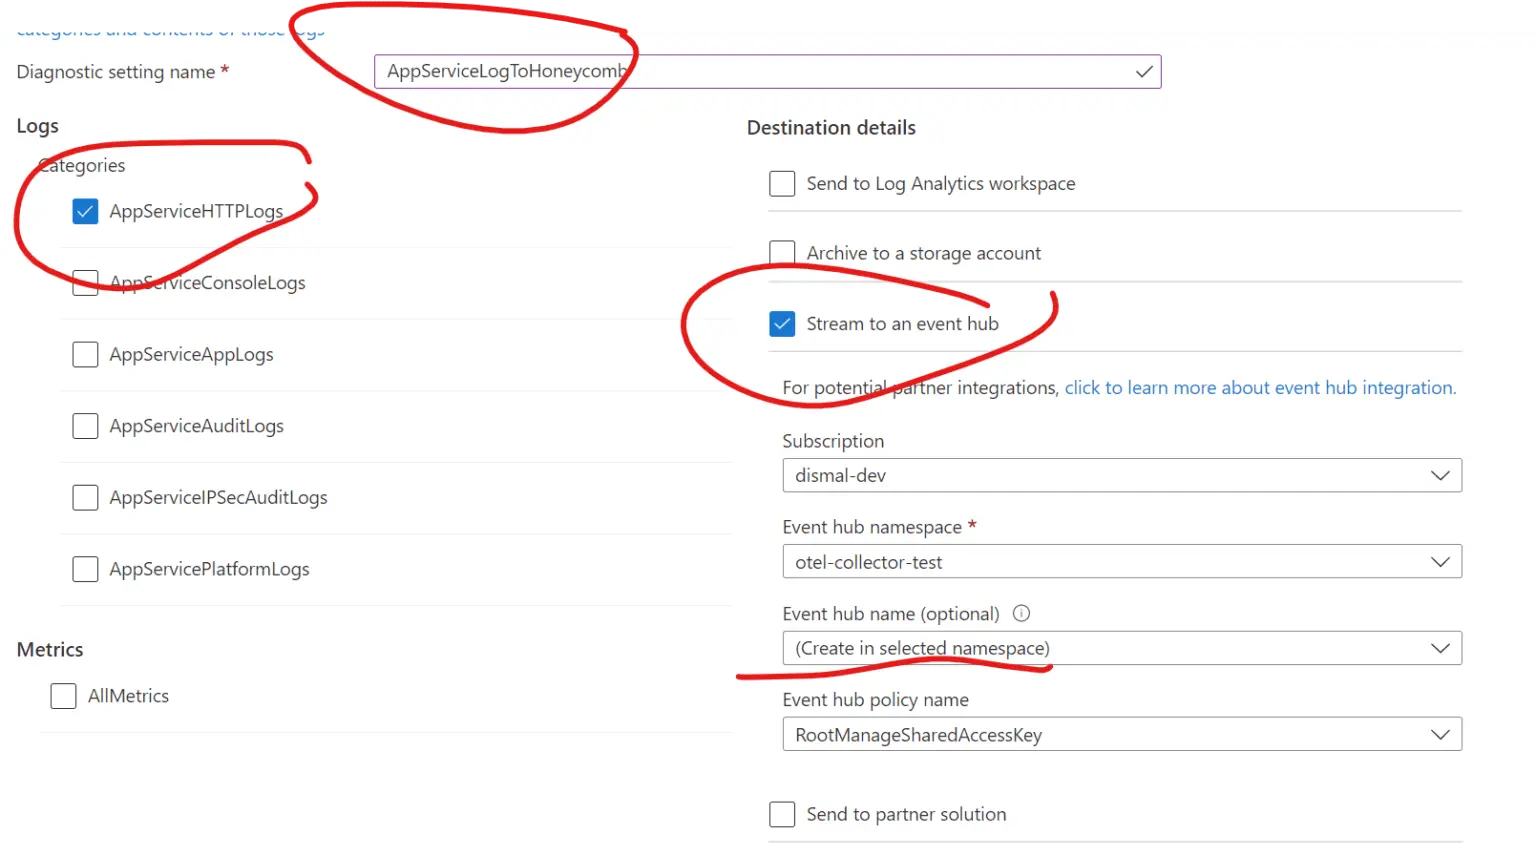
And we’re now done setting up the Logs pipeline.
At this stage, we’ve now got all the access logs backing up in the Event Hub. The next step is to deploy something that will consume those log entries and forward them to Honeycomb.
Step 3: Create the FunctionApp
Search for “FunctionApp” and then click Create.
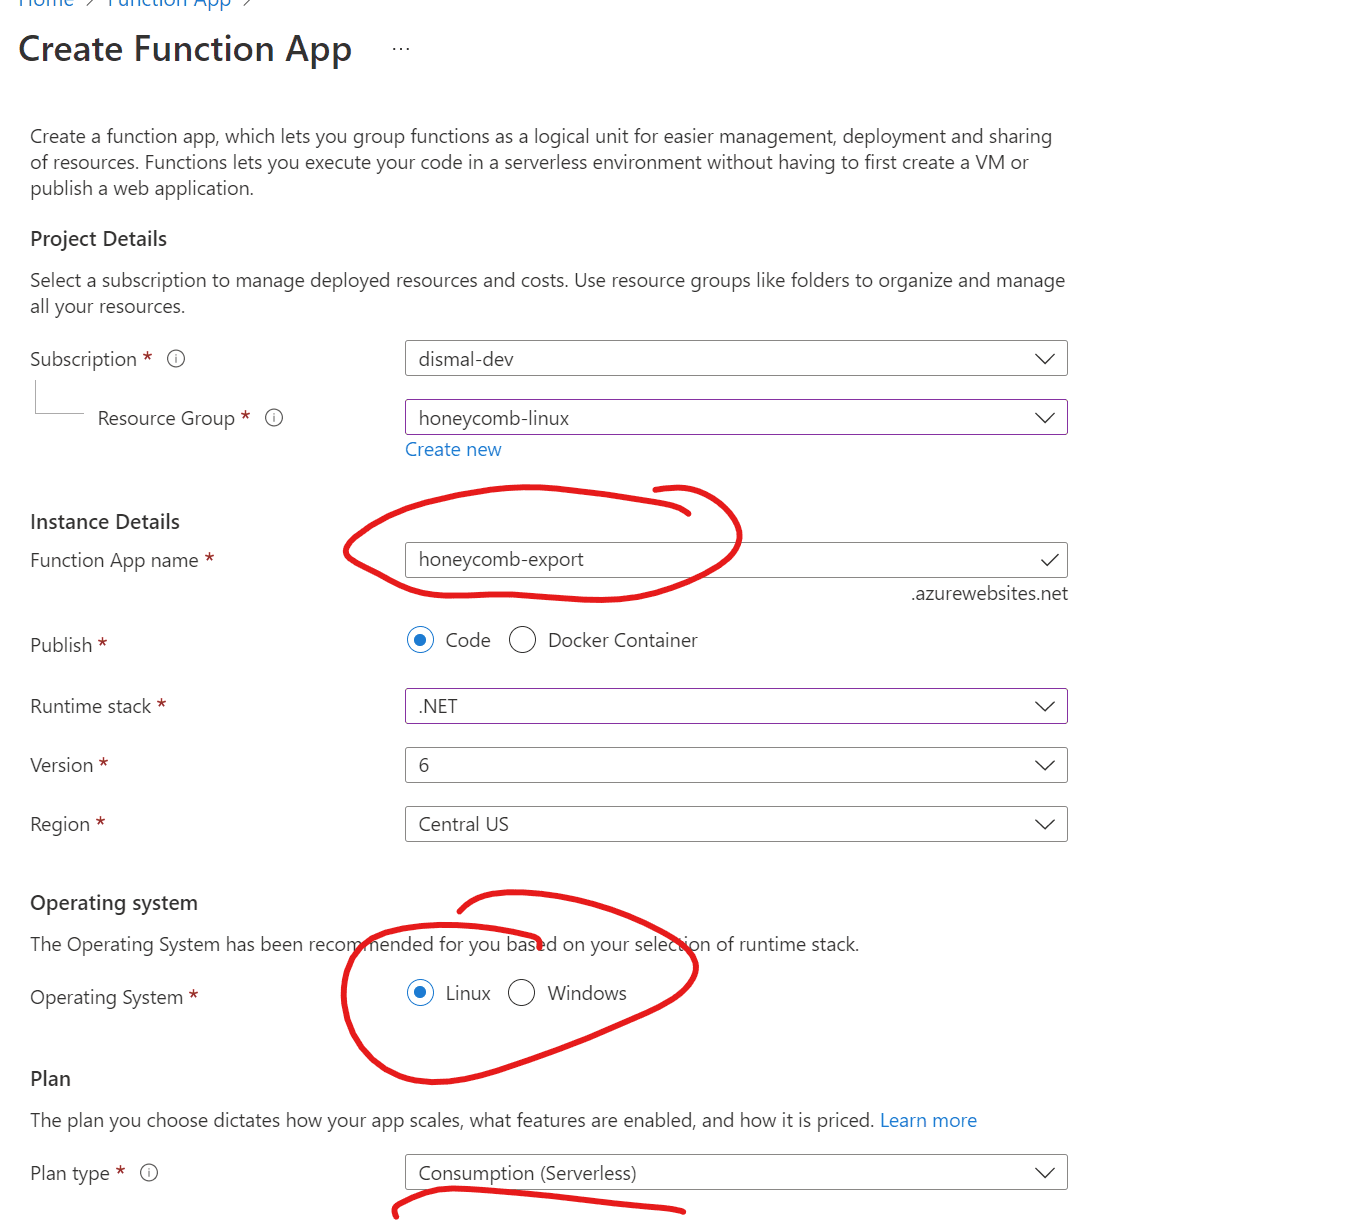
Give it a globally unique name. It’s not something that will actually be used, as we’re using service triggers instead, but Azure requires it.
For this tutorial, we’ll use a Linux Function App. We’re also going to stick with Consumption for the plan type. When you take this to production, you should consider the capacity plan for this, as when you hit significant scale, it may be cheaper to run this with an AppService Plan.
Note: note that Linux Function Apps can’t live in the same resource groups as Windows Apps, so you may need another resource group.
All other settings here aren’t relevant, so you can go straight to “review and create.”
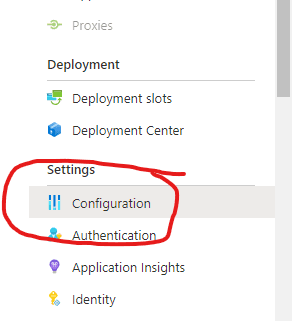
Step 4: Function App settings/configuration
Next, we’ll need to set up some settings in the app.
The first is the name of the Event Hub within the Event Hub namespace we created in Step 1. If you’ve followed the steps exactly, this will be a deterministic name. If you’ve chosen to give it a different name, then you’ll need to put that in here.
Name: EventHubName
Value: insights-logs-appservicehttplogs
The next setting you’ll need is your `ApiKey` from your Honeycomb environment.
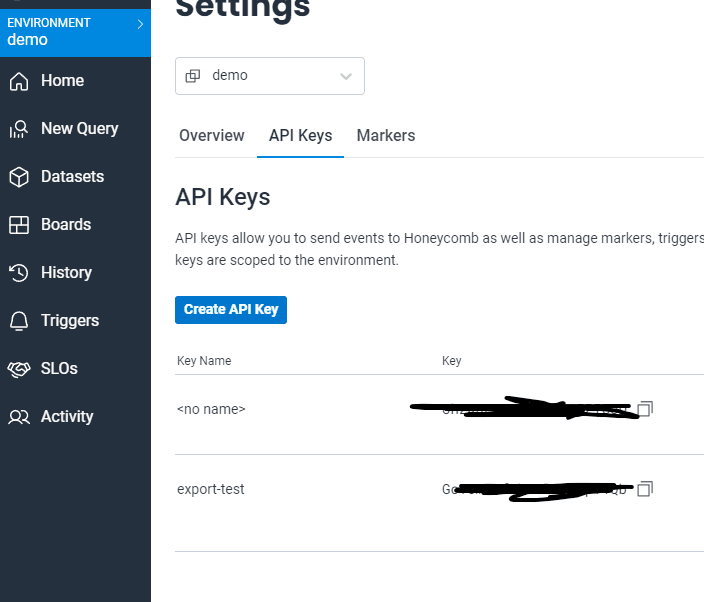
Note: This is based on a team that has been created with (or upgraded) to the new Environments workflow. However, the process will work for other Honeycomb Classic teams.
I’d recommend creating a new key that only includes theSend EventsandCreate Datasetpermissions.
Name: HoneycombApiSettings__WriteKey
Value: <from your honeycomb environment>
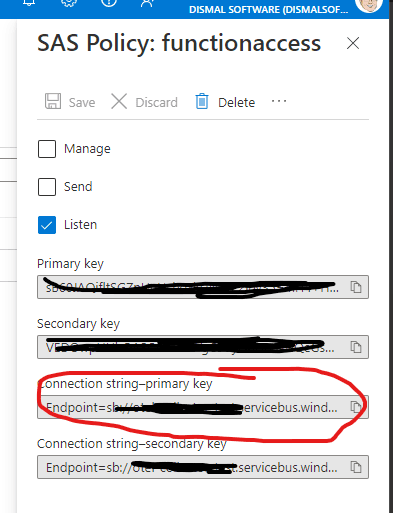
The final setting is the Event Hub ConnectionString. This is a connection string to the namespace, not the Event Hub directly. You can find the connection strings under “Shared Access Policies” on the Namespace.
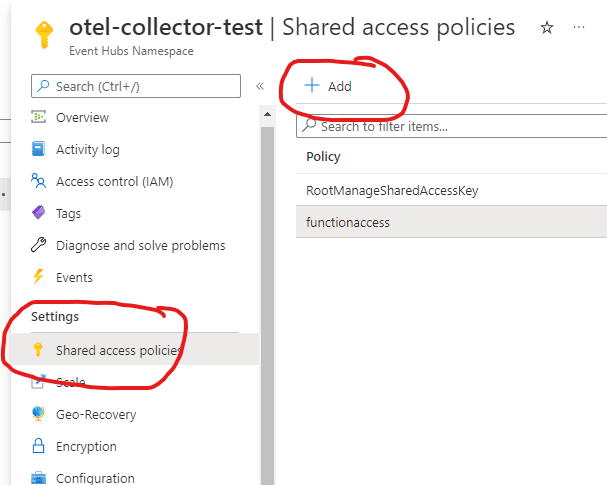
You’ll want to add a specific Policy for your Function app, as it won’t need to send, or manage the Namespace. Once you’ve done that, you’ll be able to get the primary connection string.
Name: AppServiceEventHubNamespace
Value: <From the page detailed above>
Step 5: Build and deploy
You’ll need to clone this repository.
These instructions are based on bash/linux.
To build and deploy the application, you’ll need to first build and zip the function. From the root of the repository, perform the following:
rm -rf publish-function/* && \
dotnet publish src/ -o publish-function && \
cd publish-function && \
zip -r ../function.zip . -i */* -i * && \
cd ..
Then, you’ll need the Azure CLI to push the package to your function. Replace the double braces with the relevant values from your Function app:
az functionapp deployment source config-zip \
--resource-group {{resourceGroupName}} \
--name {{functionAppName}} \
--src function.zip \
--subscription {{subscriptionName}}
That should be it! You should now be able to see your logs flowing into the Honeycomb portal. It takes less than a minute for things to star
From here, you should check out Brian’s post to get some ideas of the interesting things you can establish from these kinds of Access Logs.
The Takeaway
Once you have your pipeline set up, you can send as many of your AppService’s logs to the same Azure Function, and they’ll be forwarded over to Honeycomb for analysis.
It’s a really low cost, high value change you can make to achieve some awesome visibility into your Azure AppService without any code changes.
In the next few posts, we’ll bring in:
- Azure Application Gateway Access Logs
- Azure FrontDoor Access Logs
- Metrics from all your services
All using the same methodology. Keep an eye out on the blog to see more.
Want to know more?
Talk to our team to arrange a custom demo or for help finding the right plan.