Instrumentation: system calls: an amazing interface for instrumentation
When you’re debugging, there are two basic ways you can poke at something. You can: create new instrumentation (like “adding print statements”) use existing instrumentation (“look at print statements you already added”, “use Wireshark”)…

By: Guest Blogger
When you’re debugging, there are two basic ways you can poke at something. You can:
- create new instrumentation (like “adding print statements”)
- use existing instrumentation (“look at print statements you already added”, “use Wireshark”)
When your program is already running and already doing some TERRIBLE THING YOU DO NOT WANT, it is very nice to be able to ask questions of it (“dear sir, what ARE you doing”) without having to recompile it or restart or anything.
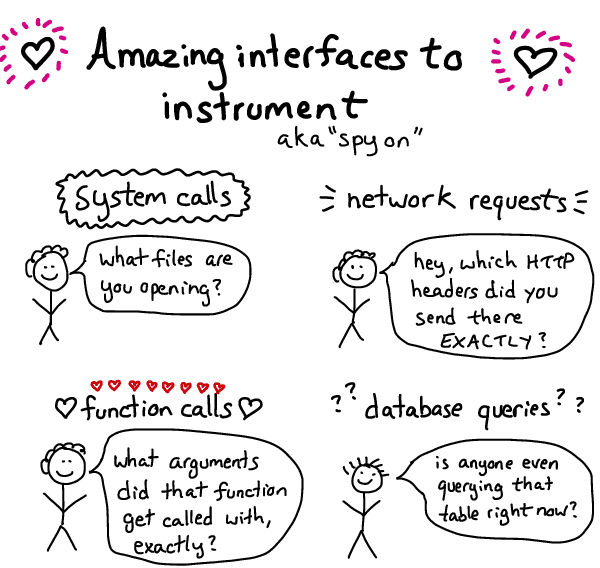
I think about asking questions of a program in terms of “what interfaces does it have that I can observe?”. Can I tell which system calls that program is using? Can I look at its network requests? Can I easily see database queries?
In this post, we’ll talk about my very favourite interface: system calls
what’s a system call?
Your program does not know how to open files: it doesn’t know what a hard drive is, or how to read a filesystem, or any of that. However, your operating system does know all that stuff!
System calls are the interface that your program (no matter what programming language it’s in) uses to
why system calls are an amazing interface
System calls are my favorite interface to debug because every program uses system calls.
A few examples of questions that you can ask using system calls:
- Which files is my program opening or writing to right now? This is surprisingly useful – it has uncovered hidden configuration files and log files for me many times.
- Which other programs is my program executing? You can see every program that’s being started, and all its arguments
- Which hosts is my program connecting to (the connect system call). This can also help you see timeouts.
These are all pretty simple questions, but without being able to observe which system calls your program is using, they can be very hard to answer!
How do I see which system calls my program is using?
You use a program called strace on Linux! Or dtruss on OS X.
I have a fanzine about how to use strace, if you are new to it and would like to learn more!
Want to know more?
Talk to our team to arrange a custom demo or for help finding the right plan.