Observability Without Tradeoffs: Introducing Powerful New Honeycomb Telemetry Pipeline Features

By: Elsie Phillips
The CTO’s Guide to Predictable Observability Costs
Learn More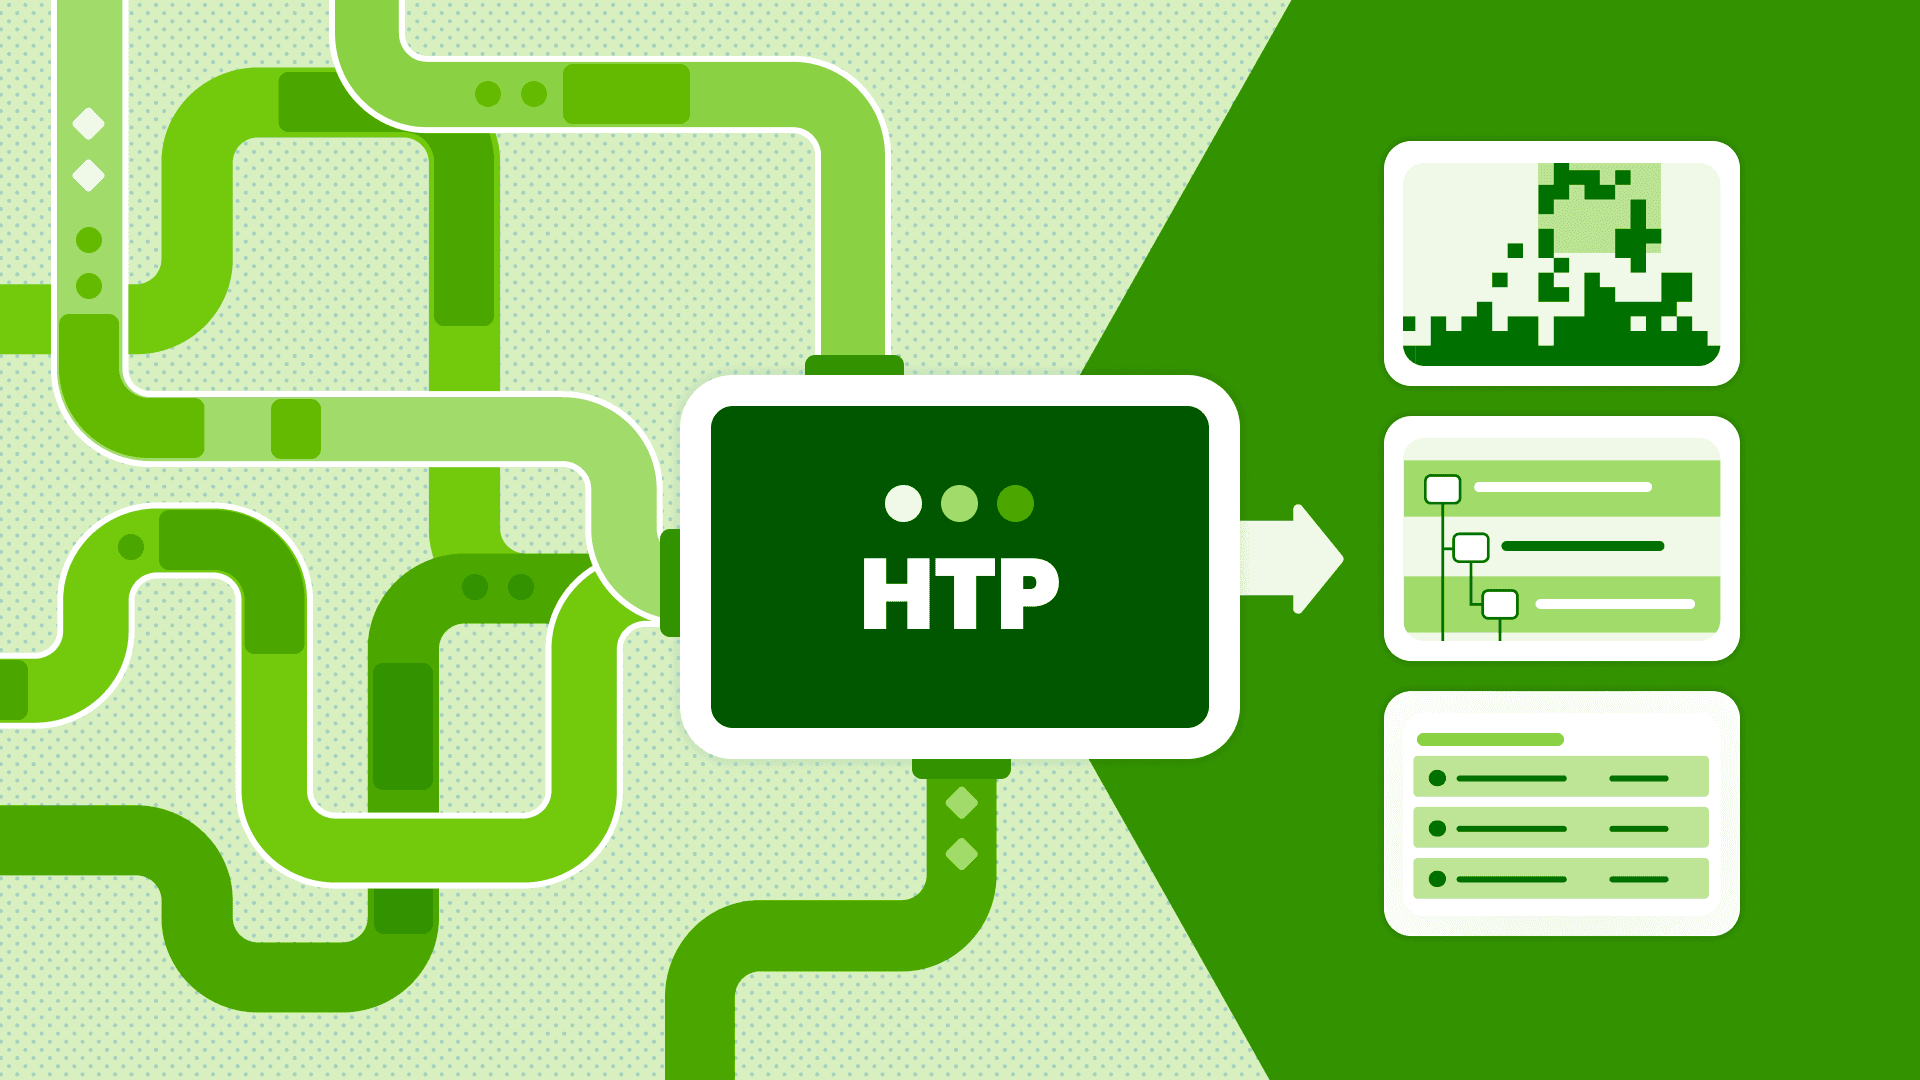
Every day, enterprise companies generate terabytes of observability data while engineering teams are under pressure to cut costs. One of the easiest ways to reduce observability bills is through sampling: intentionally sending only a representative portion of telemetry data, rather than the full volume, to your observability tool. But turning down the dial is risky. There’s this nagging voice and persistent fear in the back of your head: “What if we drop essential data we’ll need later?”
And even if you’re ready to make decisions about what to keep and what to drop, the tooling often doesn’t make it easy. You’re fumbling with YAML or leaning on other teams to tweak sampling configurations or pull archived data—assuming it’s even possible.
Today, we’re releasing an update to Honeycomb Telemetry Pipeline to take that fear off the table.
With this release, you can sample safely with the ability to easily pull full-fidelity data from your own archive whenever you need it.
Honeycomb Telemetry Pipeline now gives teams the flexibility to create a telemetry strategy that fits their systems and goals, make moving to distributed tracing less scary, and adopt OpenTelemetry on their own terms with predictable costs, full visibility, and real control.
Let’s dig in!
What’s new in this release of Honeycomb Telemetry Pipeline
Logs and traces rehydration without leaving Honeycomb
With the new Enhance feature, you can rehydrate full-fidelity logs and traces directly from your own AWS S3 archive, instantly from Honeycomb. That means you can pull data in as needed throughout your analysis, without having to think about where that data is actually stored or how to get it into Honeycomb.
What can you do with Honeycomb Telemetry Pipeline
Fully control telemetry costs
Moving to a trace-first observability model often includes two epiphanies: “Holy cow, I can see exactly what’s going on, right away!” and “OMG, this is a lot of data for every single request that comes in.”
Honeycomb maximizes the first, while solving the second with industry-leading tail-based sampling. It drops duplicate or boring traces while keeping failures, performance problems, and enough representative traffic to show how your system behaves under real conditions. Each sampled trace includes its sampling probability, so you can analyze trends and generate accurate metrics across your services.
Sampling is powerful, but setting it up is challenging. Honeycomb Telemetry Pipeline manages the infrastructure for you and gives you a clean, quick interface to choose sampling rules and rates. Start with commonly used defaults, then set your target rate of traces to keep, setting costs where you want them.
And when you need to see a trace or log that was sampled out, you are covered. With Honeycomb Telemetry Pipeline you can store full-fidelity telemetry in your S3 bucket and rehydrate any part of it back into Honeycomb for perusal and analysis.
“Enhance brings together proactive insights and reactive debugging in a single tool,” said Shogo Wada, Staff Software Engineer at Bubble. “Previously, we’d end up falling back to logs when investigating customer-reported issues, piecing together traces in our heads if the specific ones we needed were sampled out. Now, with Enhance, we can instantly grab those missing traces, streamlining our workflows and reducing our MTTR.”
World-class analysis over existing logs
Investigations in Honeycomb are a world-class experience. Move smoothly between high-level queries, specific statistics by any field, and detailed log records. Our unified data store was built for fast queries over structured data. Honeycomb Telemetry Pipeline turns your existing logs into the structured data that generates value in Honeycomb. Parse, enrich, filter, deduplicate—and just in case, store everything in S3.
We’ve built Honeycomb to be trace-first because distributed traces are incredibly powerful for understanding how services interact across complex systems. Still, we know that some developers have a strong attachment to logs (and with good reason).
Honeycomb Telemetry Pipeline helps bridge the gap: It makes it easy to transition your team to trace-centric observability by keeping logs within reach when needed while making them significantly cheaper to store. You get the best of both worlds: the richness of trace-based exploration and the comfort of familiar log data that’s structured, enriched, and queryable on demand.
“Transitioning our logging to Honeycomb was a natural choice. The most compelling factor was the significant cost savings. With the ability to ingest all our logs previously sent to our former logging solution, we could sunset that contract without any additional cost to our Honeycomb agreement.” -Josh Parsons, Software Development Engineer II at Amperity.
Scale OpenTelemetry adoption
OpenTelemetry has become the industry standard for observability data because it enables vendor-neutral, flexible instrumentation. But for many teams, especially in larger or more complex environments, reinstrumenting everything at once simply isn’t practical.
As you include OpenTelemetry in new and upgraded services, you need agents and processors to accept that data. That’s where Honeycomb Telemetry Pipeline comes in: It helps ease the transition by transforming data into OpenTelemetry-compliant formats. You can instrument on your own terms, at your own pace.
Honeycomb Telemetry Pipeline streamlines the infrastructure: configuration happens in a friendly UI inside Honeycomb, and a Helm chart deploys the full pipeline stack into your Kubernetes cluster. Start with our recommended pipeline, then iterate on log parsing, data enrichment, and sampling rules directly from Honeycomb’s Pipeline UI. Update your telemetry configuration with a click and roll changes out to all Collectors and samplers.
“We realized with at least 30 key microservices running, we needed to transition to a world where tracing became a tangible concept. Transactions were increasingly complex, demanding a deeper understanding of their flow through the system. We started our journey with OpenTelemetry and then sought out the best-suited observability solution.” – Ranbir Chawla, SVP of Engineering at Ritchie Bros.
Get started with Honeycomb Telemetry Pipeline
With this update to Honeycomb Telemetry Pipeline, you can now get observability without trading off cost, control, or full visibility.
Honeycomb Telemetry Pipeline is available to Honeycomb Enterprise customers.
To learn more about how to reduce your observability spend, increase your control over your telemetry, and gain full visibility, register for our upcoming webinar: Telemetry That Pays Off: Fully Integrated Pipelines for Maximum Observability Value on July 22nd with Honeycomb’s VP of Product, Graham Siener and Director of Customer Architecture, Irving Popovetsky or book a personalized demo with our sales team.
This post was written by Elsie Phillips and Jessica Kerr.
Want to know more?
Talk to our team to arrange a custom demo or for help finding the right plan.