Investigating Timeouts With Tracing Using Sentry
Tracing is one of the key tools that Honeycomb offers to make sense of data. Over the last few weeks, we’ve made a number of improvements to our tracing interface — and, put together,…

By: Danyel Fisher

Tracing is one of the key tools that Honeycomb offers to make sense of data. Over the last few weeks, we’ve made a number of improvements to our tracing interface — and, put together, those changes let you think about traces in a whole new way!
Tracing makes it easier to understand control flow within a distributed system. We render traces with waterfall diagrams, which capture the execution history of individual requests. Recently, I interviewed a number of Honeycomb users about what they did with traces. Several of them told me that they use it for investigating crashes. When they hit a crash, their code would store the traceId so they could find the crash more easily. They’d then go look at the actual trace of the crashing code to go see what had happened.
Let’s talk through how we can use that process — and, on the way, show off some of the coolest new features in Honeycomb Tracing.
Debugging and tracing with Sentry
Let’s start with getting into the trace. Since we know the TraceID for a specific crash — why not use that TraceId to get us straight into Honeycomb’s trace view? Using the new Direct Trace Links API, you can now create a link that goes directly into a specific trace.
We’ll start by looking at a scenario for a small team that runs a back-end API. It’s important to us that when our clients call the API, we respond quickly — we have a service guarantee of under one second. When our service fails to answer a request in under a second, we return a status=500 error to our user. Errors are logged using error-logging software — in this case, we’re using Sentry.
As part of the crash reporting process, we’ve added in a link right back into Honeycomb, directly to the failing trace, as part of that crash! We can create a TraceURL out of convenient parts we had laying around in the house, and forward that to Sentry.
The Sentry source code looks something like this:
function sentryError( errorString: string, e: event ) {
let traceId = e.trace.id;
let trace_start = e.trace.start_time;
let trace_end = e.trace.start_time + 10000;
// create a URL that points to the trace
traceURL := `https://ui.honeycomb.io/${e.team}/datasets/${e.dataset}` +
`/trace?trace_id=${traceId}&trace_start_ts=${trace_start}&trace_end_ts=${trace_end}`;
// and send the URL as a parameter to sentry
raven.CaptureMessage(errorString,{"honeycomb_trace": traceURL})
}
Follow the trace link in Sentry
We start off by seeing that we’ve got a problem: something has taken way too long to run, and has fired off a “Deadline expired!” error. Our error budget is getting burned, and so we’ve been paged. We go to Sentry to see what’s up.
It looks like there have been a number of “Deadline Expired!” warnings. After we dig around in the error report here, we decide that the best path is to go see how this error came about:
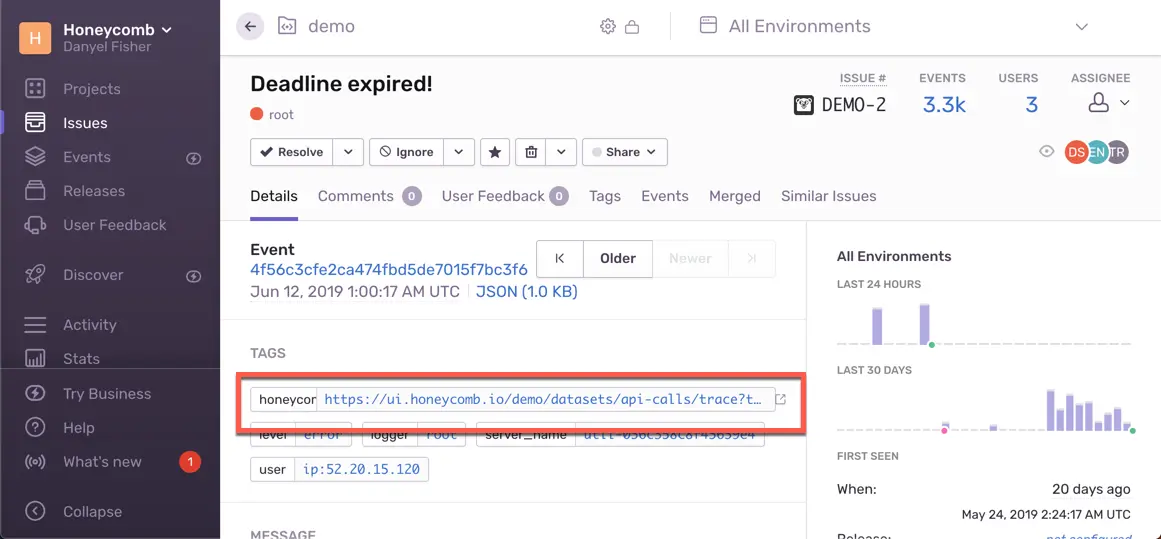
When we click the link, Honeycomb opens directly in the waterfall view.
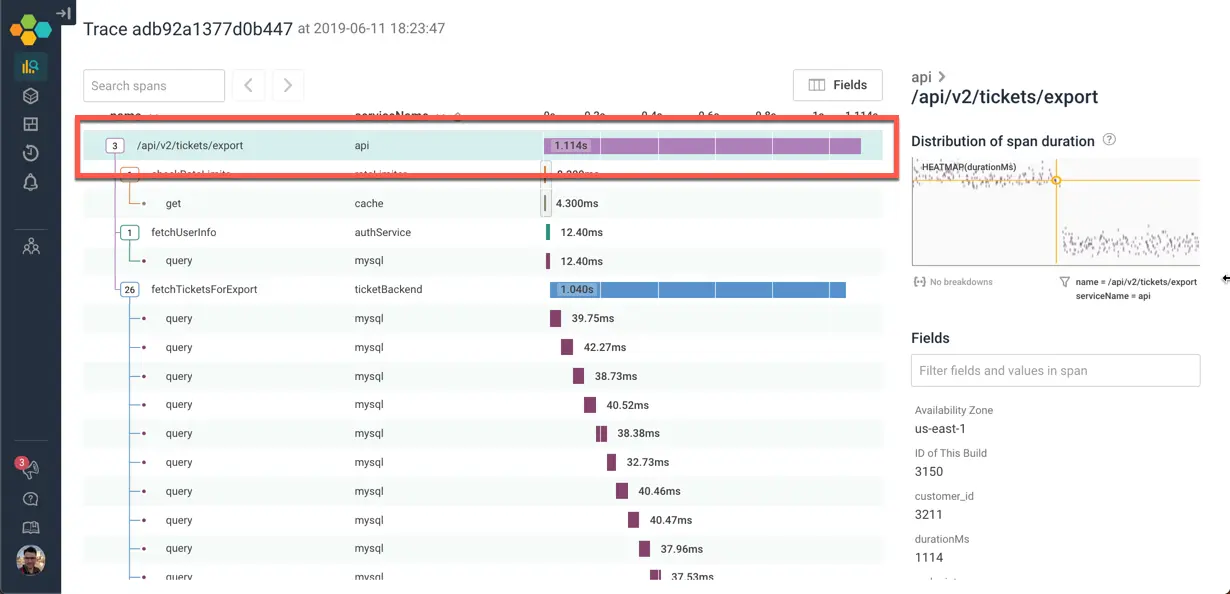
We can see the trace from here. A call to /api/v2/tickets/export took a little over a second — and if we know we have a 1 second timeout, that tells us where the deadline exceeded comes from.
Let’s figure out what it was that took so long:
Navigate the trace
This trace is bigger than my browser window. To try to get a handle on the structure, I can quickly collapse everything at a given level of depth, or with a given name. This can be invaluable when you’re dealing with hundreds, or even thousands of spans in your tree!
In this case, we quickly see that the entire tree is just three top-level functions — and the third is taking all the time:
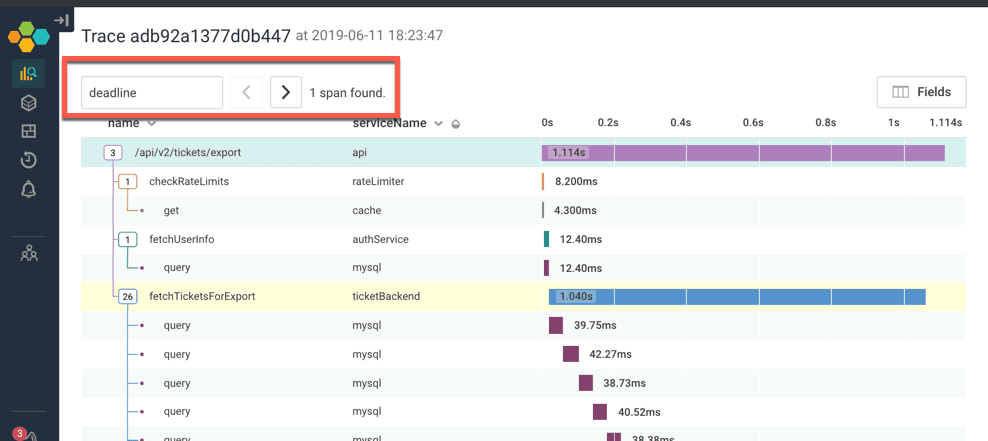
Let’s go explore what happens inside fetchTicketsForExport. We can click on the icon to expand it — and scroll through the 26 children. It looks like the process of calling fetchTicketsForExport is calling 26 different MySQL queries serially!
There are other ways we could have explored the trace to find the deadline expired message: For example, if I searched for the word “deadline”, the span that has that message is highlighted in yellow. I can jump right to it!
Compare this span to others like it
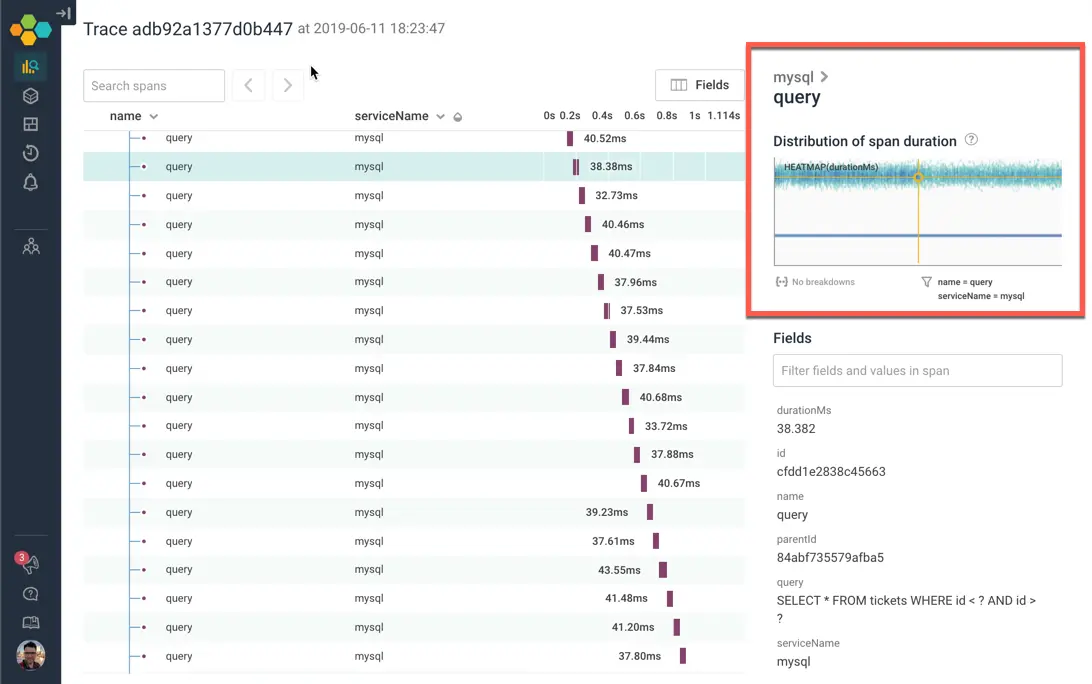
Of course, the next question is — is that unusual? Would we expect to spend this much time? The minigraph in the top-right corner tells us how a given span compares to other spans with the same name and serviceName. The X axis shows when they occurred; the Y axis shows how long they took. The yellow crosshairs identify this single span.
We can read a lot out of this heatmap! There seem to be two groups of spans with this name. There’s a very uniform set of them, and a larger, somewhat more diffuse, slower set. For spans named “query”, with the serviceName “mysql”, this span is pretty normal. (For more on reading heatmaps, check out our older post on how Heatmaps Make Ops Better.)
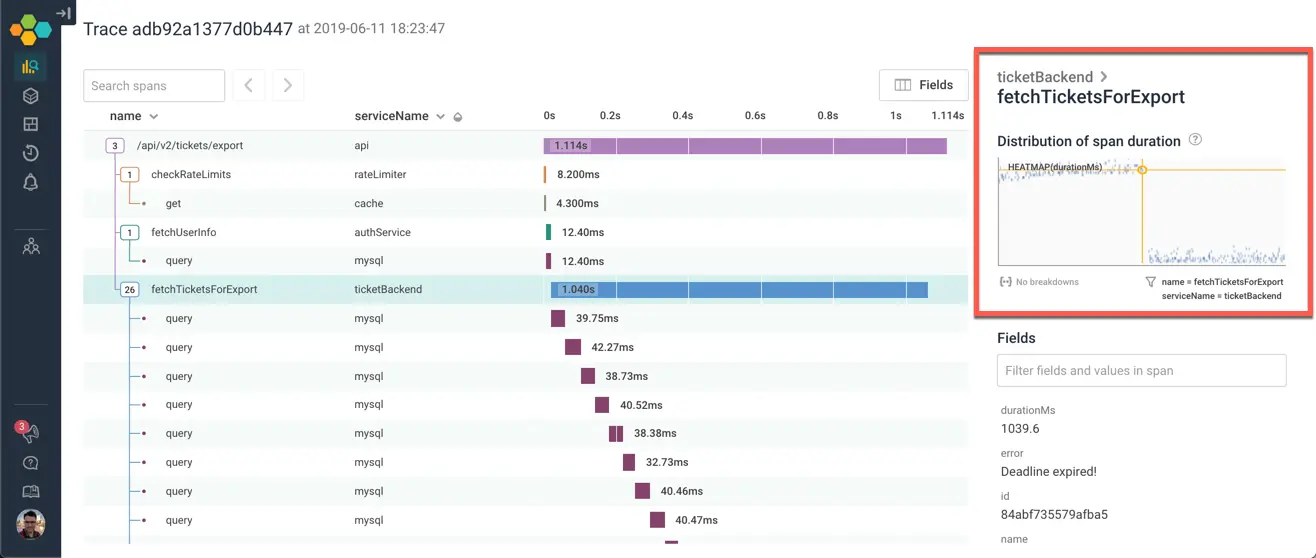
The fetchTicketsForExport call is more interesting. We can see that some calls to this method are slow — and others are much faster. Let’s go find out how these populations are different from each other:
Get out of the trace
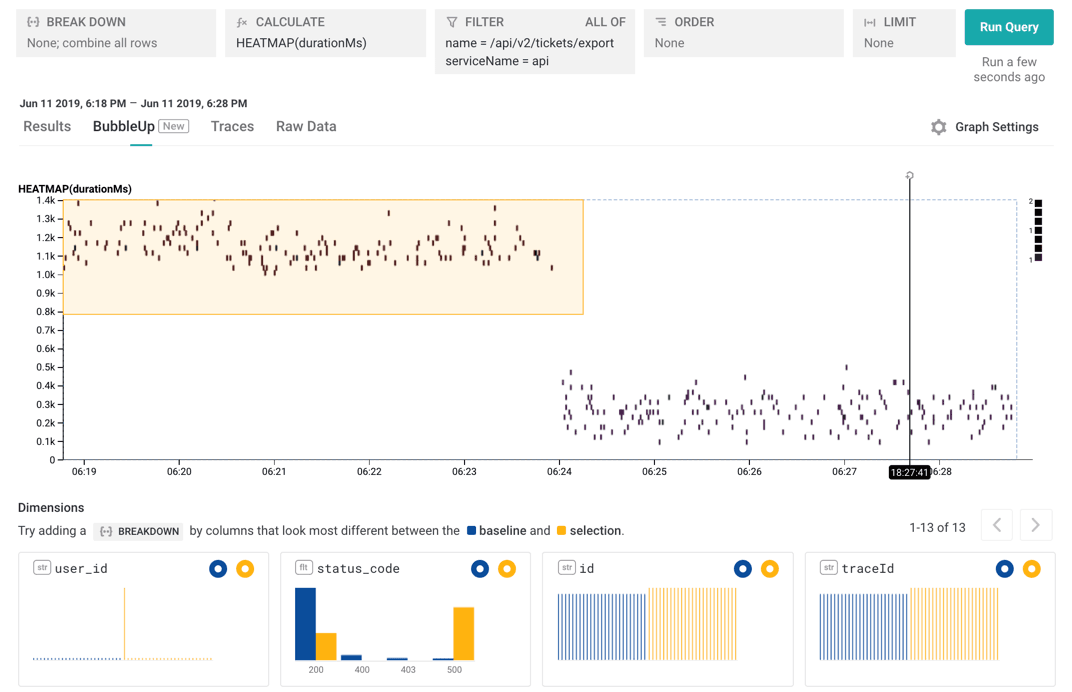
Clicking directly on the heatmap jumps out of the trace into the Query Builder, and gives us a full heatmap!
From here, we have lots of choices. I decided to try a BubbleUp , which lets me pick a set of points that seem off to me. I want to examine how the slow calls to /export are different from the fast ones.
I select the region with the slow calls, and look at the histograms at the bottom. I can instantly see that the issue is isolated to one particular user_id — this one user has been seeing a lot of status_code = 500 errors. I can now go look at that user’s queries, or can look at the database calls, or lots of other choices:
More data tracing examples
We talk about the waterfall diagram for traces in this blog entry, and use an example of how to analyze a complex system with traces here. Check our docs on exploring trace data.
Want to play with this data, and explore the trace yourself? Check out the Tracing Tour Sandbox. No signup or login required — just jump in and explore!
Want to know more?
Talk to our team to arrange a custom demo or for help finding the right plan.