Getting Started With Distributed Tracing
Distributed tracing is used to understand how a large operation is composed of smaller atomic tasks and how those tasks are spread across services in a distributed system.

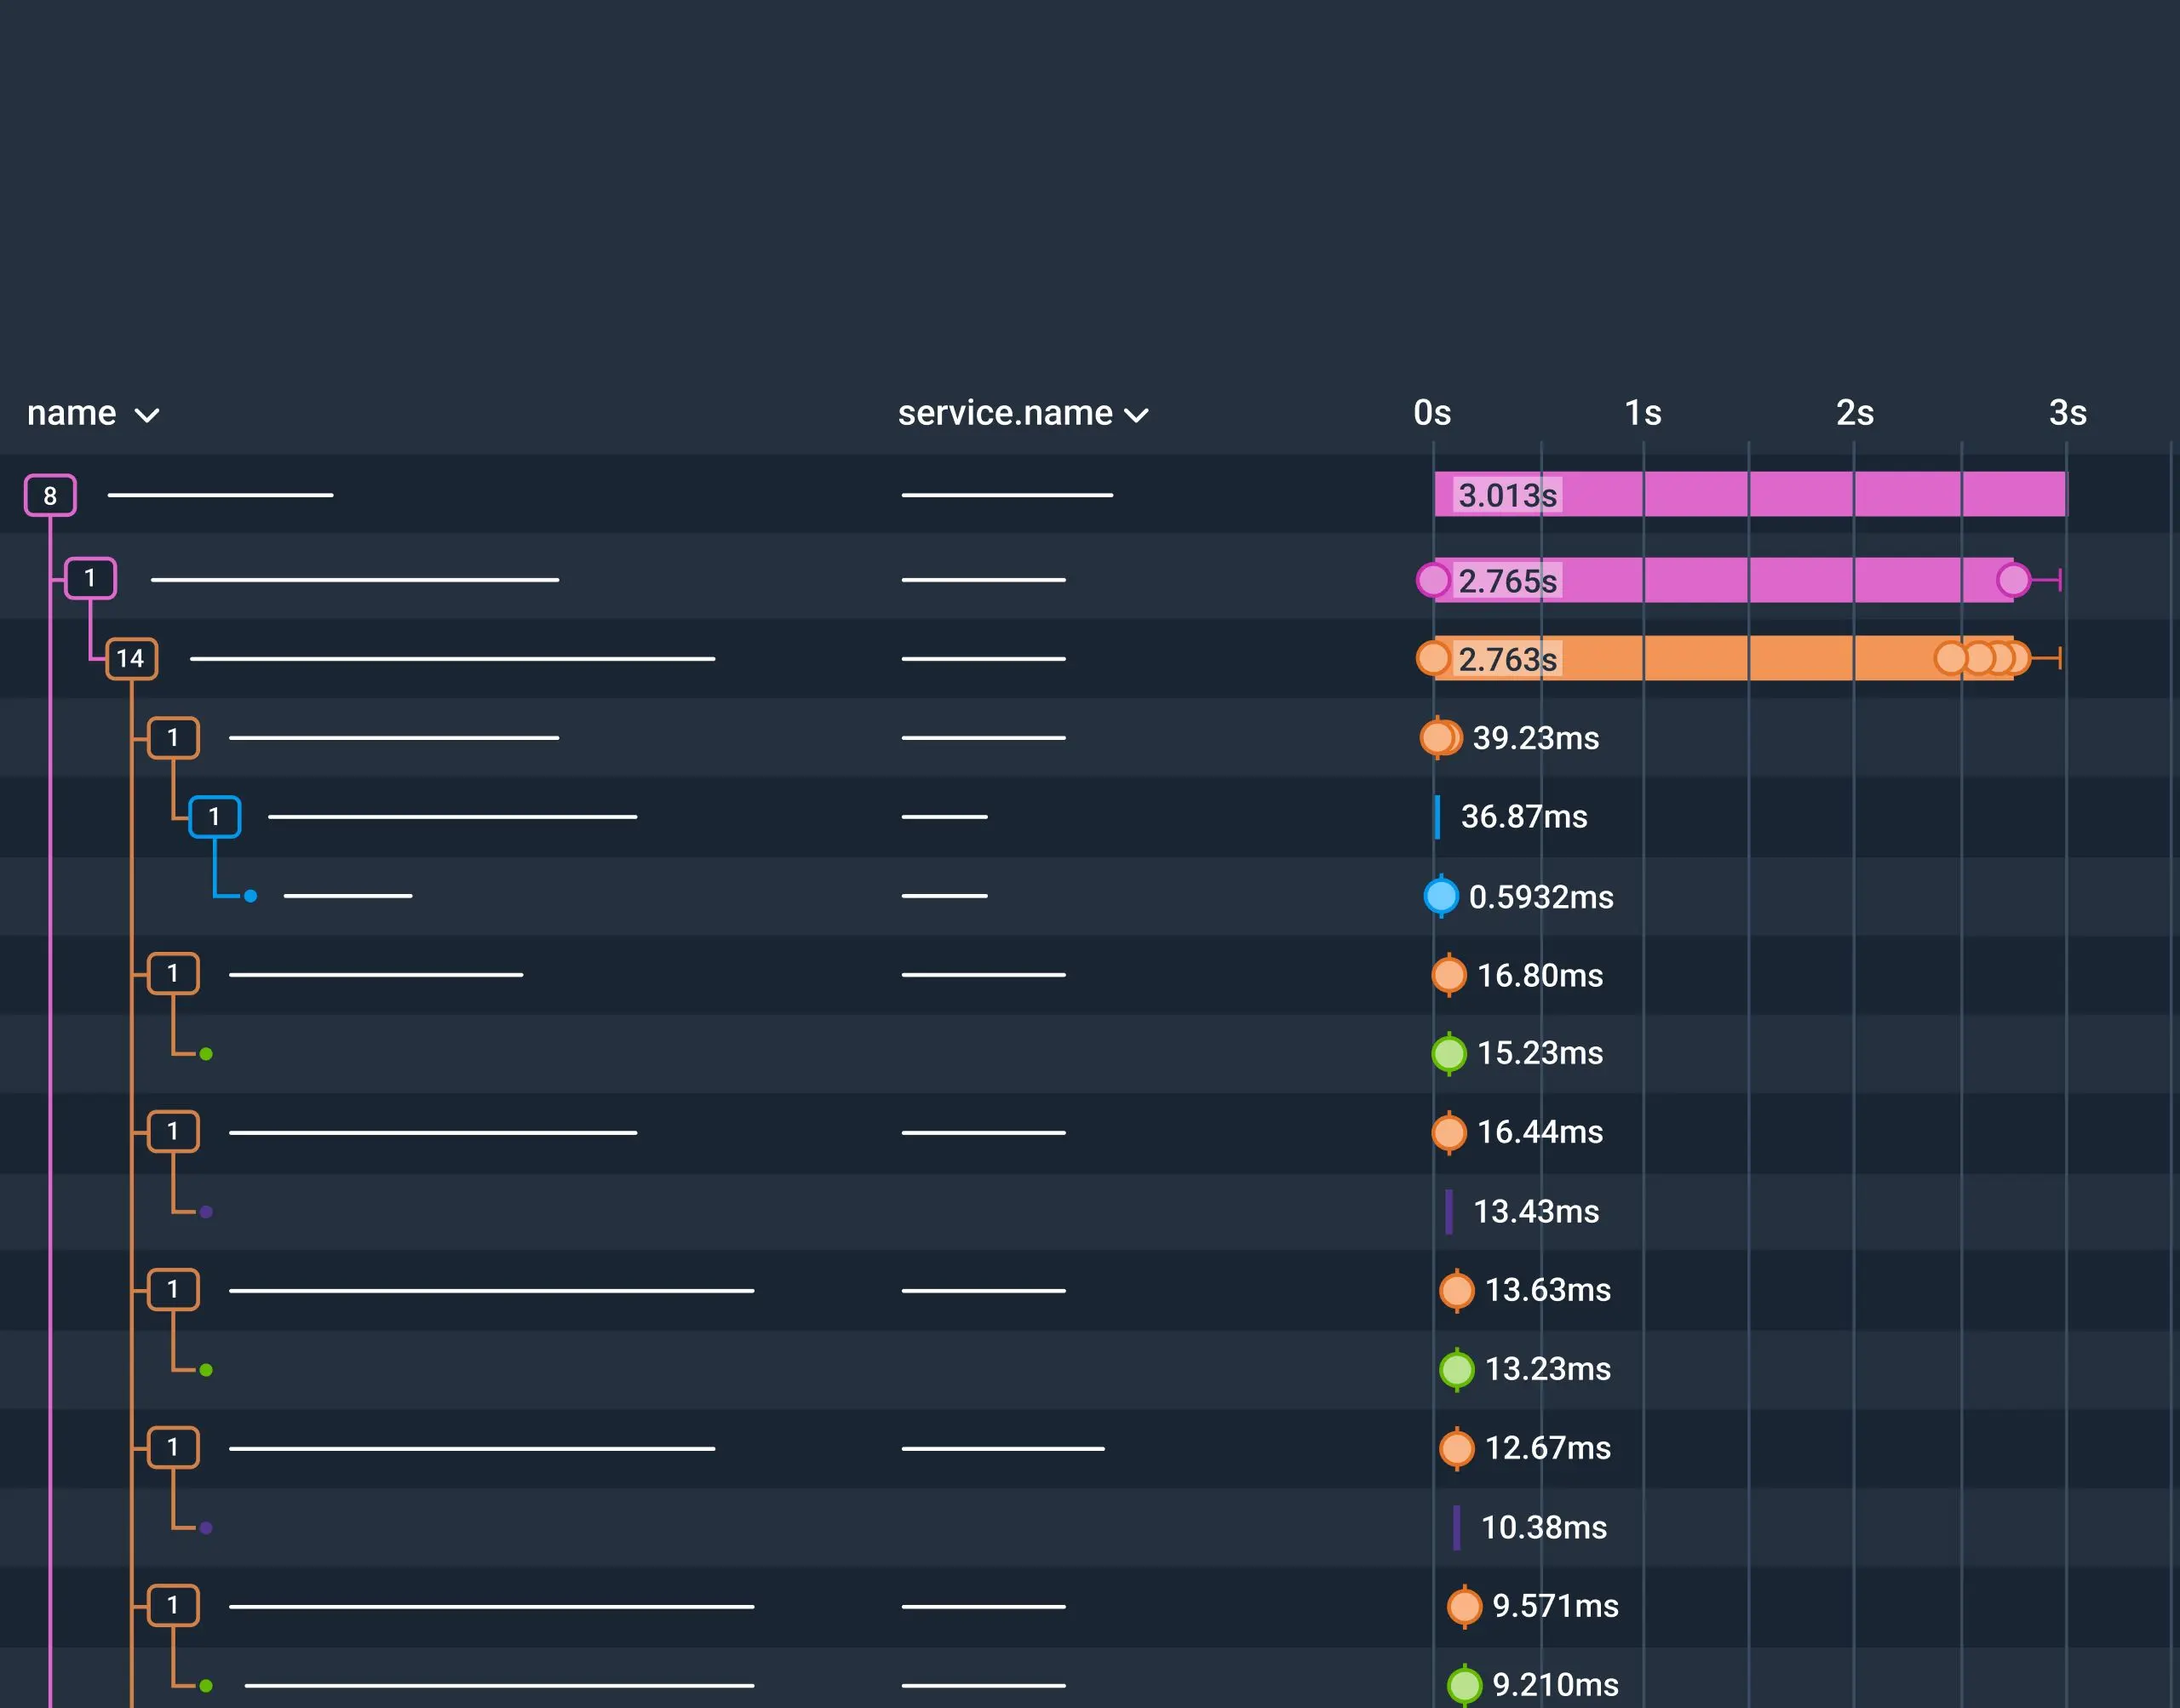
Distributed tracing helps you understand how each operation moves through your system. For traditional call-and-response services and GenAI workflows that invoke AI agents and LLMs, the same principles apply. You need an end-to-end picture of what's happening and why: reconstruct and correlate each step, see where your system slowed down or failed, and how that impacts other parts of your system and your users.
Distributed tracing works by giving each operation a shared trace ID, recording each step as a span, and then sharing that context across system boundaries. You'll see how traces are constructed from these spans, and how they use context propagation to cross those boundaries. You'll also see how to instrument your system with OpenTelemetry, and how the same principles apply to both call-and-response and AI-agent/LLM workflows.
What is distributed tracing vs logs and metrics?
Distributed tracing is used to understand how a large operation is composed of smaller atomic tasks and how those tasks are spread across services in a distributed system. Each task is correlated by a shared trace ID and a parent span ID. With this information, you can understand the duration and nesting of each task and reconstruct the full path through the system. Adding rich metadata and attributes lets you diagnose issues quickly.
Traces are composed of spans, have duration, and are distributed across services in your system. Attaching high-cardinality attributes to spans gives you the context to diagnose issues. To get more clarity you can correlate with metrics and log events:
- Metrics show aggregate data over time, like request rates, error rates, and latency. They signal when something needs investigating, whereas tracing shows what went wrong and why so you can fix it.
- Log events capture point-in-time events from an individual component and can be connected to traces, such as an individual error or stack trace. They provide similar context to span attributes and metadata, but they have their own structure and no duration.
When a user navigates to an e-commerce site and adds an item to their cart, a well-instrumented application will have a trace that covers the page navigation. When they search for a product, your telemetry emits an event when the user clicks the search button, a trace containing the HTTP request for the search, and a nested span for the database call that runs the query. Meanwhile your servers emit metrics like memory usage.
Together, this data lets you answer questions like "How long are our users waiting for product results to load?" and "Are particular users or query parameters driving that duration?"
How does distributed tracing work?
When a request enters the system, tracing assigns it a unique trace ID. As it moves from service to service, each step records its work under that same trace ID. The result is a single, ordered timeline, usually shown as a waterfall. Three primitives make this work: traces, spans, and context propagation.
Traces represent the end-to-end journey of a request
A trace is a collection of nested spans. The nesting between spans is defined by parent_id. The root span of a trace has a null value for parent_id and is the start of the trace. All spans in a trace share a trace_id. You'll often create a span in your application code to represent an application-level unit of work like "User Product Search," and then rely on context propagation and auto-instrumentation to provide additional spans for the HTTP and database calls. This way, your domain logic and lower-level system logic are correlated and can be diagnosed as a single unit even though it's made of many smaller tasks.
Spans describe individual units of work
Each span captures one unit of work: an HTTP call, a database query, a function execution, a queue or cache operation, an LLM call, or a tool invocation. Useful spans have the data:
- Span name: This identifies the operation the span is capturing. This should be a low-cardinality value such as
get_account. - Span ID: This uniquely identifies the span; it's usually generated by the SDK.
- Parent span ID: This specifies the calling operation or, if unspecified, identifies it as the root span.
- Trace ID: This groups all units of work into a single operation.
- Start and end timestamps: This indicates when the operation starts and ends, from which you derive duration.
- Service name: This specifies which system is responsible for servicing the request.
- Status: Unset, Ok, or Error to identify how the task completed. Further details can be specified by Attributes.
- Attributes: This is additional key-value metadata to furnish the context needed to understand your system. Attributes can be high-cardinality values like
http.request.urlor a user ID.
OpenTelemetry's semantic conventions standardize span and attribute names so the data looks the same across services and languages. Using an SDK and auto-instrumentation will ensure your spans are properly constructed and nested.
Context propagation links spans across service boundaries
For spans from different services (identified by service.name) to join the same trace, you need to share context across those boundaries. Context propagation is the mechanism for sharing the trace ID and parent span IDs.
Each transport carries this context using OpenTelemetry's propagators in whatever form fits the protocol. Over HTTP, the carrier is the request headers: the traceparent and tracestate headers travel alongside Content-Type, Authorization, and the rest of the request. gRPC puts the traceparent and tracestate values in call metadata. A message system like Kafka puts the traceparent and tracestate values in a record's headers.
Context propagation keeps downstream work connected to the initiating request. Ensuring context is propagated prevents downstream spans from starting a new trace of their own, creating an orphan span.
Why distributed tracing matters for modern applications
A user's actions ripple across services, serverless functions, third-party libraries and APIs, remote data stores, and increasingly LLM and AI-agent calls. Tracing preserves the shape of that work across the whole path, so when something is slow or broken you can see where it happened and why, then fix it.
Microservices and serverless make a single request a system event
In a microservices or serverless architecture, one user request can touch dozens of libraries, services, and ephemeral functions before it returns. That changes where problems live. A latency spike often doesn't belong to any single service; it emerges as the request flows through the system. The cause might be a queue delay backing up upstream work, a downstream retry that doubled a call, a slow database query, or an error buried deep that recovered but still created ripples. Look at one service in isolation and each piece looks healthy. Tracing reconstructs the full path, with timing and parent/child relationships from the root span to its child spans, so you can see you needed more retries than expected to recover and serve the user's request.
AI agents add a new layer of nondeterminism
AI-agent workflows share a similar problem as traditional call and response, but with a far less predictable path. Without tracing, the system is a black box with no visibility into how the agent did its work. Recording each step as its own span makes those decisions debuggable: which tool ran, what it returned, where the loop stalled, and whether it recovered. You can't predict the shape an agentic workflow will take the way you can a REST API call: LLM calls, tool invocations, retrieval steps, and reasoning loops decide control flow at runtime, which makes for flexible but ambiguous systems.
That ambiguity makes it even more important to capture each unit of work, so that when you identify agentic failures like latency, cost, poor quality, or response errors, you (or your coding agents) can quickly form a hypothesis and iterate on a solution.
Distributed tracing vs metrics and logs
Metrics, logs, and traces answer different questions, and you'll usually want to use all three. Metrics tell you something changed and that you should investigate. Logs tell you what happened, like an error or lifecycle event. Traces correlate metrics and logs and show how work is composed and moves through the system, and where time, errors, or dependencies accumulated. Tracing is the signal that diagnoses emergent behavior in your system.
How to get started with distributed tracing using OpenTelemetry
OpenTelemetry is the modern default for distributed tracing. It's vendor-neutral, backed by the CNCF, and supported by every major observability platform. This lets you instrument your code without vendor lock-in. For an overview, check out the getting started with OpenTelemetry guide.
Instrument your application with the OpenTelemetry SDK
Start by adding the OTel SDK for the service you want to instrument. They exist for most languages: Go, Python, Java, Node.js, Ruby, .NET, and more.
The most out-of-the-box coverage comes from using auto-instrumentation. These drop-in libraries emit telemetry for common frameworks, HTTP clients, database drivers, and other runtimes without you touching that code. This gets you baseline traces for most requests. Then you can layer custom spans for application logic that auto-instrumentation misses, and enrich the auto-instrumented spans with attributes specific to your application. Honeycomb's instrumentation docs cover the per-language setup.
Propagate context across service boundaries
Context propagation is what turns single spans into distributed tracing. It uses the W3C TraceContext standard. Propagating the trace context is usually handled by auto-instrumentation, but if you need to handle it manually, you can use the Propagators API. When this context isn't propagated, you end up with disconnected or orphaned spans that make your system harder to understand.
Add custom spans and useful attributes
High-cardinality fields let you slice traces down to one affected customer or region instead of an aggregate average. Auto-instrumentation tells you what ran (e.g., an HTTP request). Attributes tell you who ran it (e.g., by adding user.id) and under what conditions (e.g., which feature flags were enabled). By adding high-cardinality fields like user ID, session ID, tenant ID, endpoint, region, feature flags, plan type, and error message (or, for AI workflows, model name and tool name) as attributes, you make distributed traces useful for diagnosing production issues and understanding how your system is behaving. Baggage can add any key-value pairs to the propagated context, but avoid putting sensitive information in it.
Sample intelligently to balance cost and coverage
At scale it's not feasible to keep every trace. Head-based sampling decides at the start of a request, usually by percentage or with simple rules, but it can drop the user actions, errors, or GenAI spans you most want to see, leaving you with incomplete data when you have operations like GenAI conversations or user sessions that span multiple traces. Tail-based sampling captures a more complete picture since it waits until a trace finishes, but it's more complicated to set up and has a higher infrastructure cost. Start head-based, then move to tail-based when the need arises. See Honeycomb's sampling guidelines for more.
Export spans to a tracing backend
An exporter ships your finished spans using the OTel OTLP specification to one or more backends, such as Honeycomb, Jaeger, Tempo, or an APM vendor. Because OTLP is the wire format, switching backends means pointing the exporter at a new endpoint, not rewriting your instrumentation.
Quick-start checklist
- Add the OpenTelemetry SDK for your language
- Configure zero-code and/or auto-instrumentation for the frameworks and libraries your application uses
- Add custom spans and important high-cardinality attributes for application-specific operations
- Add high-cardinality attributes that can help you root-cause and diagnose
- Export over OTLP to Honeycomb and confirm trace context propagates across service boundaries
Common distributed tracing challenges
Tracing pays off when the request stays connected and your spans carry the attributes and relationships you'll need to filter, group, and query efficiently. These are the common ways it breaks down.
Broken context propagation creates orphan spans
When a service doesn't pass trace context across a boundary, the downstream work starts a new unconnected trace instead of nesting under the parent. You get orphan spans and that work isn't linked to the request that caused it, so a slowdown or error can look unrelated.
Missing attributes limit investigation
A trace with timestamps but few attributes tells how long a task took, but little else. You can see the database call was slow; you can't see it was slow for one tenant, on one endpoint, behind one feature flag. Add a few high-cardinality attributes like user.id and the trace can answer who, not just how long. Adding custom attributes connects your business context to your infrastructure context.
Sampling can hide rare but important failures
Sampling is a cost-control measure at scale, but an unconsidered strategy omits traces you need for an accurate picture. You'll want a representative volume of normal traffic, plus the exceptional cases: rare errors, high-latency outliers, and customer-impacting failures are almost always worth keeping. Decide what you can't afford to lose before tuning the volume.
Dashboards cannot replace queryable trace data
Dashboards are a great tool for the paths you can predict. They're a good signal that something needs investigating, and then you turn to a tool that lets you query, filter, and group traces by fields to form a hypothesis and diagnosis. This is what modern distributed tracing is built around: query the raw data by any field, and if it's a common path, then you fine-tune your dashboard or alerts.
How distributed tracing applies to AI agent workflows
Agentic systems are still just code. Like many other domains, there are GenAI semantic conventions that standardize span names and attributes. But it's still just a request moving through your system. The distributed tracing model you use elsewhere applies, but it matters even more here, because you now have nondeterminism and need to understand what your agents are doing and why.
The same primitives apply: trace ID, spans, and context propagation
GenAI conversations are made up of multiple traces, and a trace usually represents a turn. A single turn can include multiple LLM inferences, tool invocations, retrieval steps, agent handoffs, retries, and the downstream API requests those tools make. Each of those is a span, and the trace ID propagates through all of them, so they correlate into one trace. Each span also carries the conversation ID (gen_ai.conversation.id), which links the separate turns into a single conversation you can follow end to end. That makes it useful for diagnosing failures like excessive cost, latency, or quality issues.
GenAI semantic conventions add LLM, tool, and token attributes
GenAI semantic conventions give spans and attributes standard names, such as the operation (gen_ai.operation.name), the request and response model, token usage, the agent name, the finish reason, and error state.
Because the names are shared, you can compare and troubleshoot agent runs across agentic frameworks and model providers. Pick instrumentation that emits the current gen_ai.* attributes, or make sure your custom implementation adheres to the spec, so you can diagnose and understand your agentic systems.
Distributed tracing best practices
A useful trace represents one task from start to finish: connected parent-child spans scoped to a single unit of work, time-bounded and detailed enough to show what ran and under what conditions. Noisy tracing gives you the opposite: small, disconnected traces. The practices below keep them useful.
Capture high-cardinality fields like user ID and session ID
In aggregate, traces often look fine, smoothing out the peaks and valleys. But failures are usually confined to one node, a feature flag recently enabled, a single user-cohort, a newly deployed build. To debug with granularity, spans need high-cardinality attributes you can filter and group by: user ID, session ID, request path, build SHA. These will tell you which users and systems are affected.
Tie traces to SLOs and customer outcomes
Auto-instrumentation gives you a foundational view of the frameworks and infrastructure you build on, enough to set SLOs on latency, errors, or request status. Your own application spans let you tie traces to customer outcomes: checkout completion, login, search, or for agentic systems, agent task duration and token usage. When an SLO starts burning, the traces behind it show what has to change—in your system or in the business itself.
Query traces rather than just watching dashboards
Plenty of things point you at a problem: a dashboard, an alert, an SLO starting to burn. But that only says something is wrong. To diagnose it, you need traces complete enough to query by whatever dimension explains the scope, so you can see which cohorts are hit and which service is degrading. A static dashboard can't answer questions it wasn't built for; querying well-connected traces can.
Keep span names and attributes consistent
Consistent naming makes trace data easy to query and compare. Keep span names low-cardinality, like get_account, so the same operation reads the same across services. Don't put high-cardinality details like an account ID or URL in the span name. This fragments your data. Instead, put these details in attributes. OpenTelemetry's semantic conventions are a strong starting point, and they keep your attributes consistent across languages and vendors.
How Honeycomb does distributed tracing
In Honeycomb, every span is a wide event: it carries unlimited high-cardinality attributes. Capture a value once (a user.id, a feature flag, a build SHA) and you can query the trace by it, group, and break down on any field you captured. Whatever you'll want to ask later, you put on the span.
The trace summary highlights the slow spans and errors up front, so you can jump right to that span. Span events and links are available in the sidebar alongside the waterfall view, and span link attributes show how traces connect. Async and queued work reads as a single view instead of disparate orphan spans. When you find the issue in trace zoom, you get a shareable deep-link to your teammate, so you can be confident you're both looking at the same thing.
Since AI-agent and LLM workflows are just code, all the same principles and tools apply. The attributes change (model name, tokens, tool calls), but the trace is still the unit of investigation.
Get started with distributed tracing in Honeycomb
The fastest way to understand distributed tracing is to send your own data. Start free by pointing your existing OpenTelemetry-instrumented service at Honeycomb, and your traces arrive as wide events you can query by any attribute. If you're new to instrumentation, walk through the OpenTelemetry quickstart or explore a live sandbox first. When you're ready to learn more, book a demo with us.