Get More Out of OpenTelemetry With Honeycomb’s Latest Updates
Just a few short months ago, we talked about a bunch of updates to Honeycomb’s support for OpenTelemetry. To the surprise of no one, we’ve got more updates to share!

By: Phillip Carter

Just a few short months ago, we talked about a bunch of updates to Honeycomb’s support for OpenTelemetry. To the surprise of no one, we’ve got more updates to share!
OpenTelemetry logs support is GA
In August of this year, we announced beta support for OpenTelemetry logs. It is now GA! So, what does that mean?
- Sending us OpenTelemetry logs through any means (collector, SDK, etc.) is fully supported
- Querying these logs is fully supported
- Logs show up on the Home page as events, just like any other events you might send
- Individual logs attached to traces are displayed as Span Events in the Trace UI
In the near-term, this means that if you have a way to translate your logging pipeline into OpenTelemetry Logs, you can send them to Honeycomb! And in the future, as logs mature more in OpenTelemetry, you can correlate these logs with traces automatically.
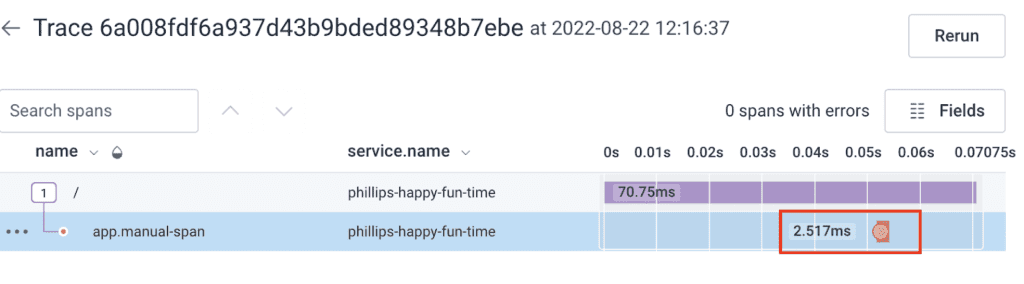
For example, here is an OpenTelemetry log associated with a span in a trace:
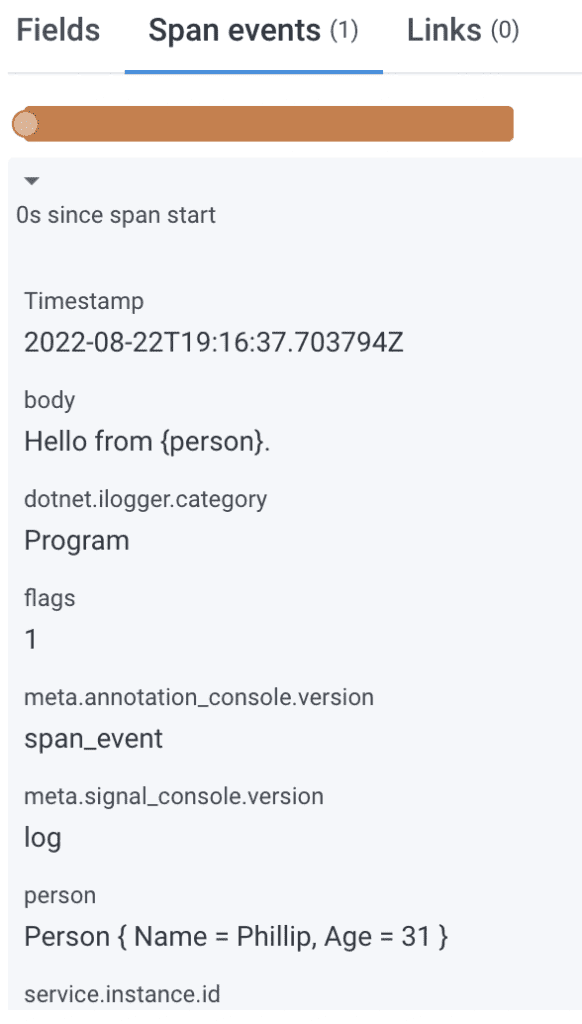
And the detail of the log can be found in the Span Events tab:
To get started with sending OpenTelemetry logs to Honeycomb, check out our documentation.
As we described in August, OpenTelemetry logs are an on-ramp to modern observability. We still believe traces that capture application-specific data on spans is the best way to instrument an app. But the reality is that many systems in the world already make use of structured logs that contain this kind of information, and it’s a very large lift to rewrite these logs into traces. That kind of activity might make sense for apps that are under heavy development, but not for all applications.
The reason why OpenTelemetry logs are an on-ramp is because when you do add traces, the logs will be automatically correlated with those traces for you. This means that you can add an OpenTelemetry logs exporter for your existing logs, then set up automatic tracing, and now your structured logs will be correlated with requests. Over time, you can add more spans to your traces, and that correlation will remain intact. This lets you progressively improve your observability over time without ever having to do a big rewrite to get there.
Honeycomb distribution for OpenTelemetry .NET is 1.0
We released 1.0 of our OpenTelemetry .NET SDK! Some features it includes:
- Easy configuration to send data to Honeycomb with all the right metadata initialized for you
- Automatic instrumentation packages for common .NET instrumentation libraries that you can add with a single line of code
- Baggage Span Processor that lets you add attributes to all spans downstream iin a trace
- Deterministic sampling
- Printing a Honeycomb link to a trace just created, useful during development (off by default)
The major change introduced in 1.0 compared to beta versions is moving the AddHoneycomb() method from an IServiceCollection extension to a TracerProviderBuilder extension. This retains almost all of the same ease of use in the beta versions, but allows for maximal extensibility so that several scenarios can be met:
- People who just want an “easy button” to send data to Honeycomb
- People who want fine-grained control over what instrumentation gets enabled
- People who want to configure multiple exporters
- People who want to register custom instrumentation their organization may have
To learn how to get started, check out our documentation on OpenTelemetry with .NET.
Support for JSON with OTLP/HTTP
While you weren’t looking, we also decided to add support for JSON with OTLP/HTTP. Prior to this change, you could still send OpenTelemetry data over HTTP, but it was protobuf-encoded.
The fact that OTLP/HTTP is protobuf-encoded for most SDKs is usually just an implementation detail for most backend services. But for frontend applications, JSON is used to encode payloads. Anyone looking to try out Honeycomb for frontend instrumentation would have to configure an OpenTelemetry Collector on the backend to translate from JSON to protobuf before they could send data to Honeycomb. This circumstance is true for any scenario in which JSON is used to encode payloads, but it’s most prominent for frontend applications today. Our support for JSON with OTLP/HTTP removes the need to translate via a Collector.
While it is still a good idea to send data to an OpenTelemetry Collector for your production apps, this removes a roadblock that we felt was simply unnecessary for any scenario in which JSON was needed or preferred.
Looking ahead
Finally, a brief look ahead!
Firstly, we’re busy building an SDK distribution for Node.js. The goal with this is the same as all other distributions: make it as easy as possible for you to send data to Honeycomb.
After Node.js is done, we’re looking to move to Python. And after that, Ruby! We’ll probably call it quits on SDK distributions after that, since our language support for SDK distributions also matches our language support for the Beeline SDKs. Next year, we’re going to look more deeply at what it looks like to help people migrate from Beelines to OpenTelemetry, especially when there’s an SDK distribution available for everyone.
Finally, we’re continuing to ramp up our upstream OpenTelemetry contributions, still focusing on changes we can make that improve the usability and ease of use of various components of OpenTelemetry.
For more details and a demo of these updates, be sure to join our webinar.
Want to know more?
Talk to our team to arrange a custom demo or for help finding the right plan.