The Magic of Metrics—and How It Can Burn You
As product developers, our responsibility continues beyond shipping code. To keep our software running, we need to notice whether it’s working in production. To make our product smoother and more reliable, we need to…


As product developers, our responsibility continues beyond shipping code. To keep our software running, we need to notice whether it’s working in production. To make our product smoother and more reliable, we need to understand how it’s working in production. We can do this by making the software tell us what we need to know.
How can we notice when the software is running smoothly? Make it tell us! With some development work, every running instance of every service can tell us at any moment whether it’s running, how much CPU is in use, and what requests it is serving.
The software can give us all this data—too much data. How can we make sense of all this, and transmit and store the data without overwhelming our network and disk? Enter the metric.
Metrics are magical because they use a cool abstraction to reduce a plethora of data into one bounded amount per time period, and then we can graph these and notice when there’s a problem. Reducing all our information to metrics will burn us by stripping that data of information that shows us how our software is working.
This article will help you love metrics, then fear them, and finally know when to use them and how to do better.
The clever abstraction of a monoid
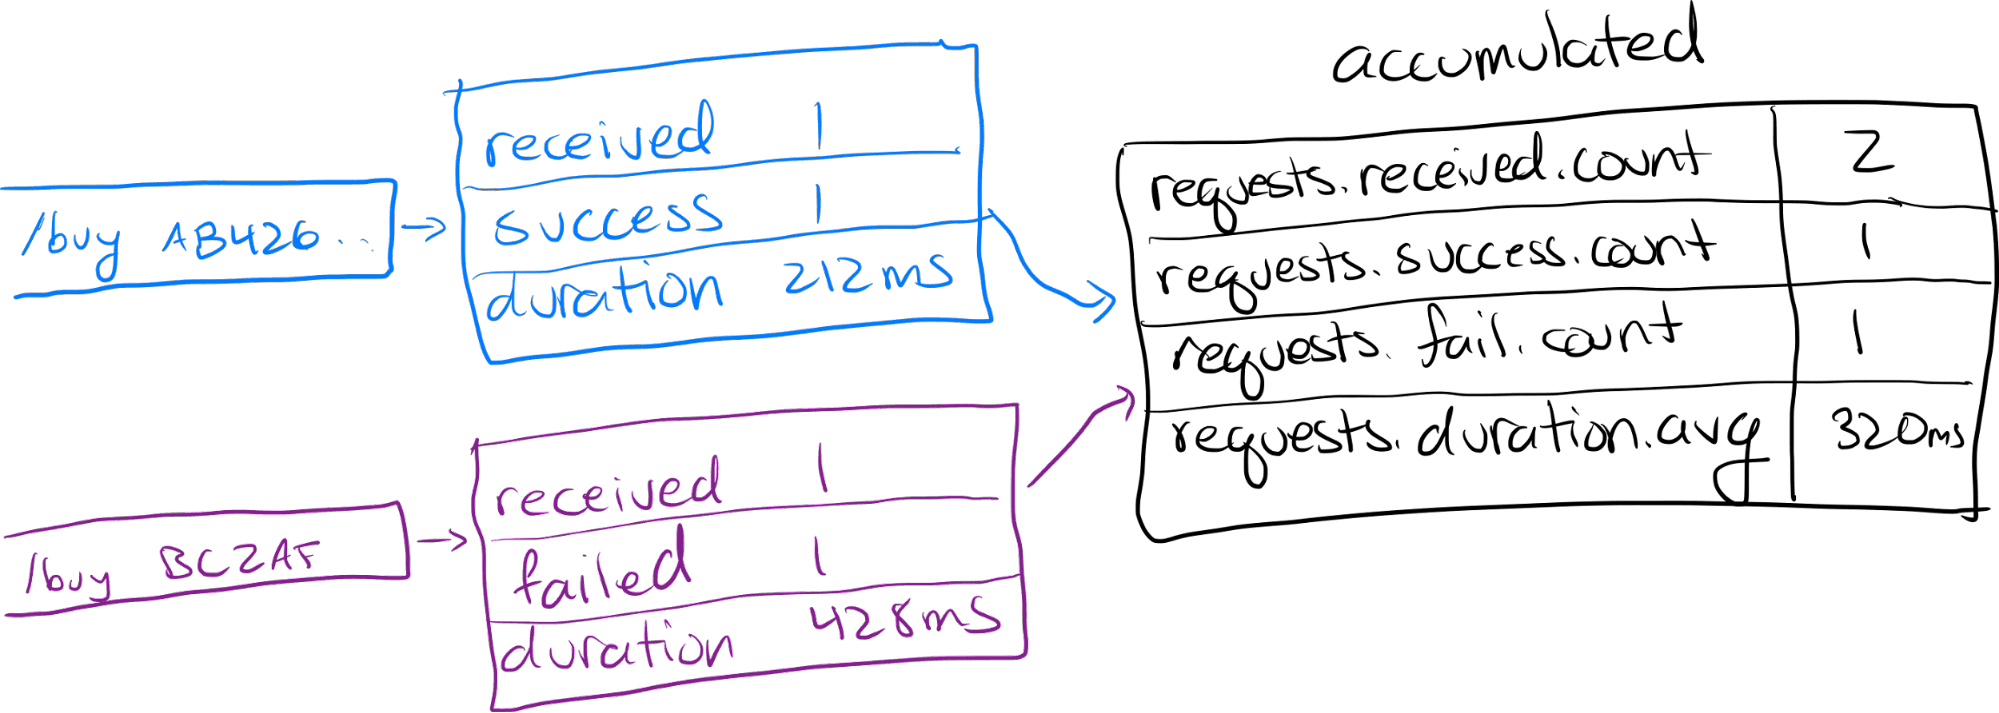
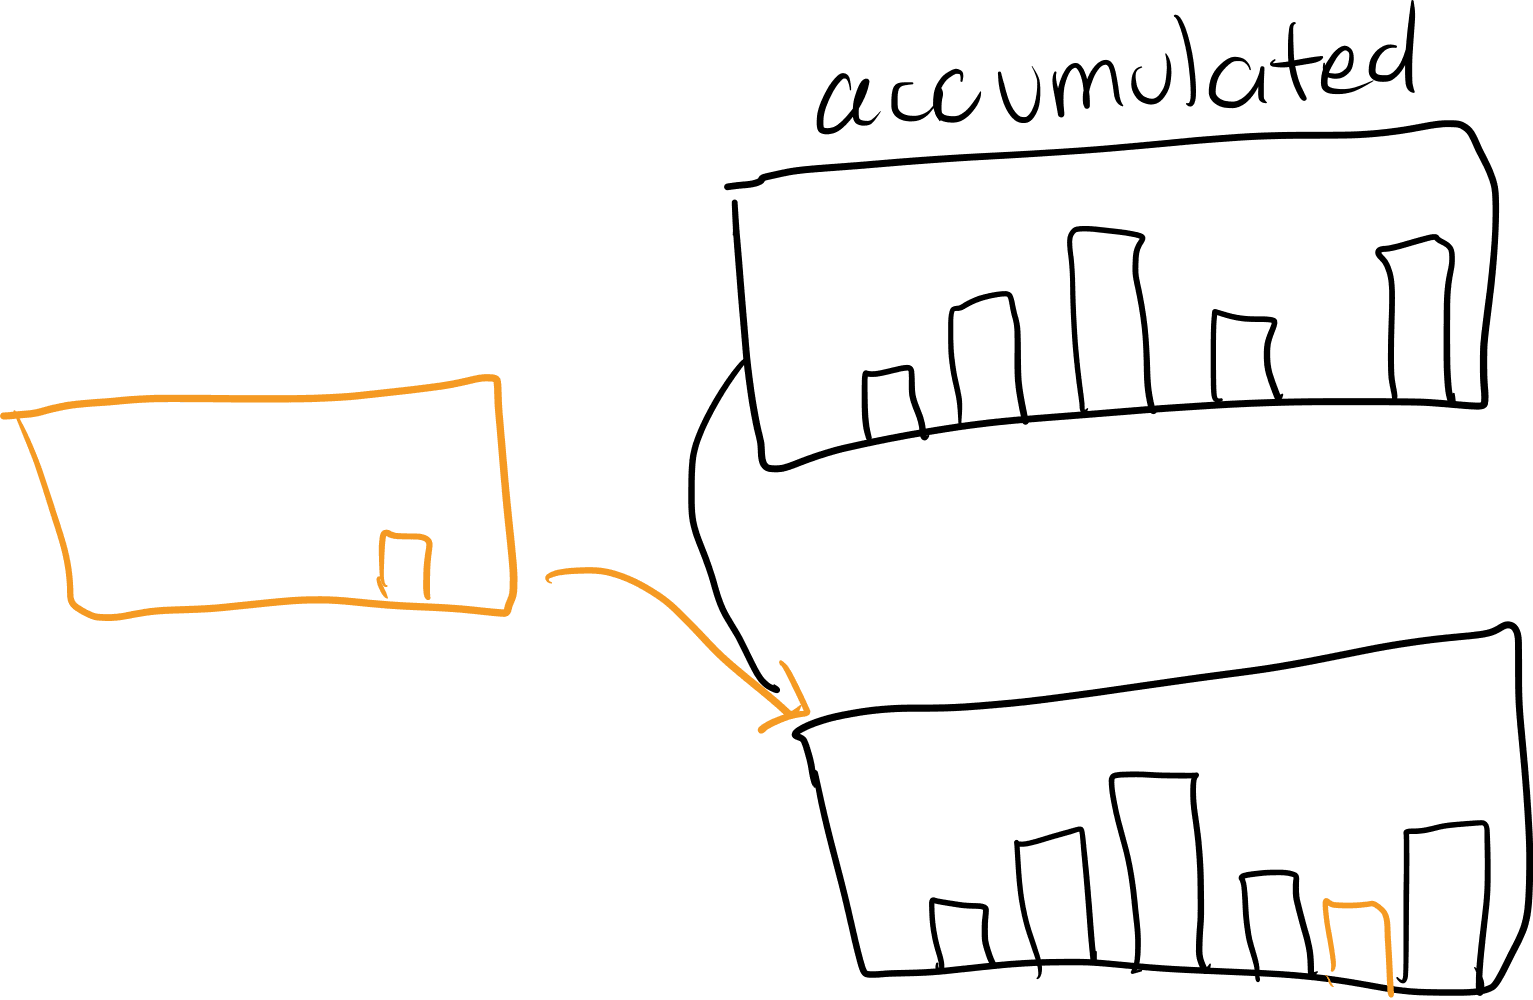
The magic of metrics: No matter how many requests come in, we can gather data about them all into a fixed space. For example, when a request originates, count 1 incoming request. When it terminates, count either 1 successful request or 1 failed request. Record the duration (for example, 212 milliseconds). Store that in memory.

When another request comes in, count 1 request. If it failed, count that too. If this one took 426 milliseconds, combine in that duration. As we accumulate data from this second request, or a third or fourth or five hundredth, the total memory used does not increase.
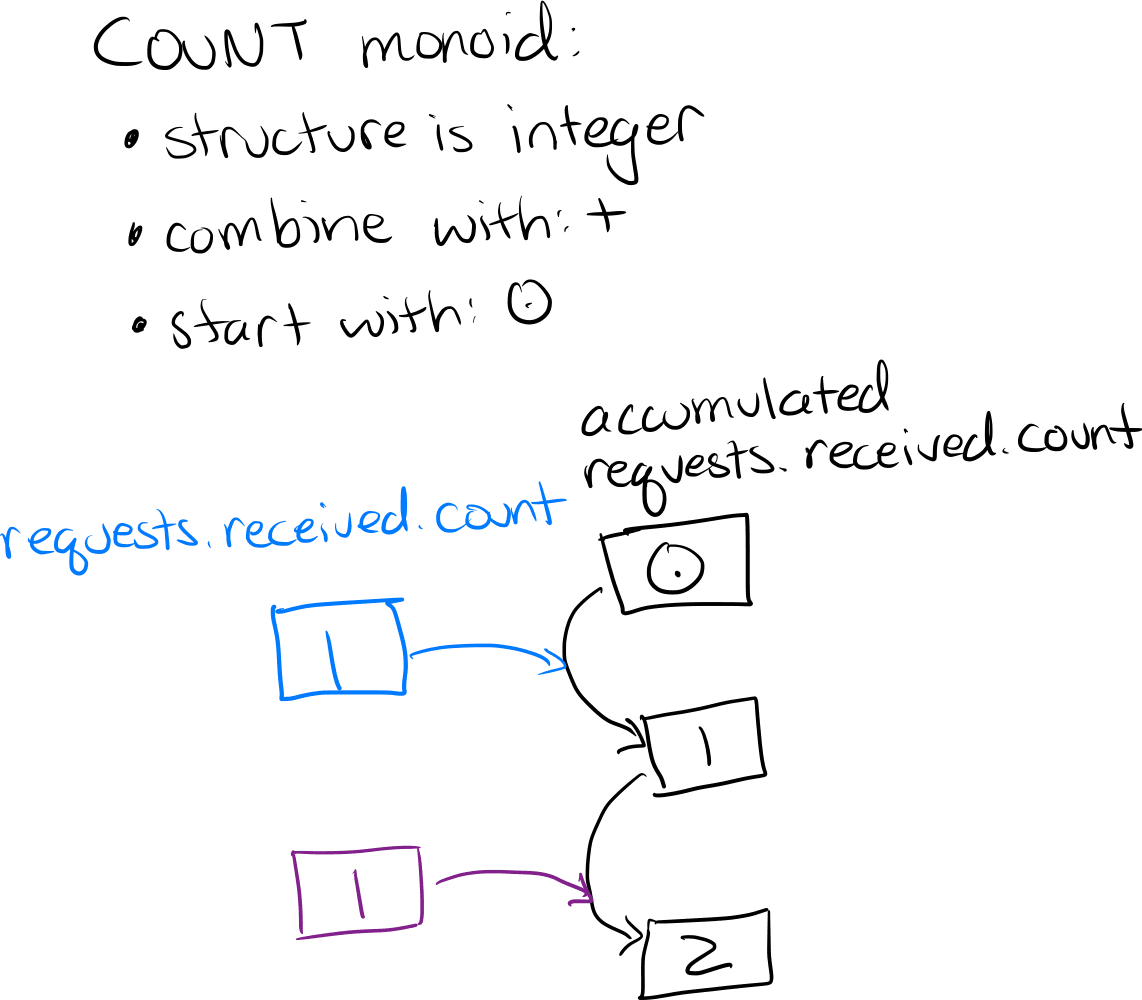
For each metric, we use a monoid. (It’s a mathematical term from category theory, and it does magic in software.) A monoid is made of three things: a data type, a “combine” operation, and an empty value. Its magic is that we can take any number of instances, combine them in any order, and get a single instance that accumulates all the information with negligible increase in size. (We can define monoids that do increase in size, but those aren’t used for metrics.)
The “count” monoid is easy: data type is integer, combine is integer addition, and the empty value is 0. We can add 1 incoming request to the total and it’s still one integer.
The duration monoid needs slightly more. We want to accumulate an average duration, not a total duration. The formula for an average is: sum and then divide by the count of numbers summed. In this example, (212ms + 426ms) / 2 = 320ms on average.
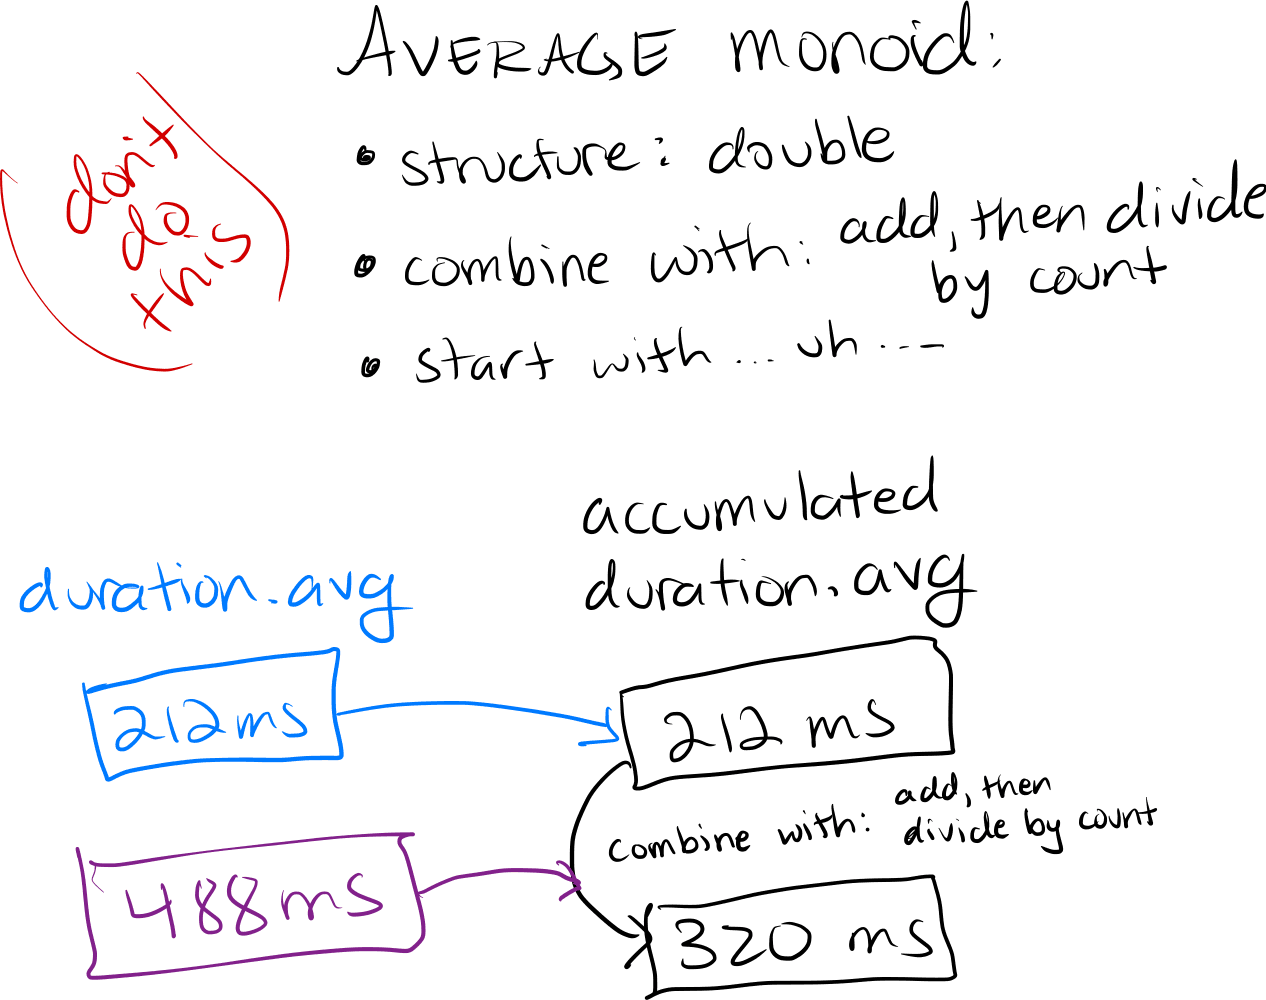
When a third request comes in that lasts 134ms, how is that combined into the monoid? We can’t do the same operation of add 134ms to our average of 320ms and divide by two. That gives equal weight to an averaged value and a new non-averaged value. If we did that, (320ms + 134ms) / 2 = 227ms
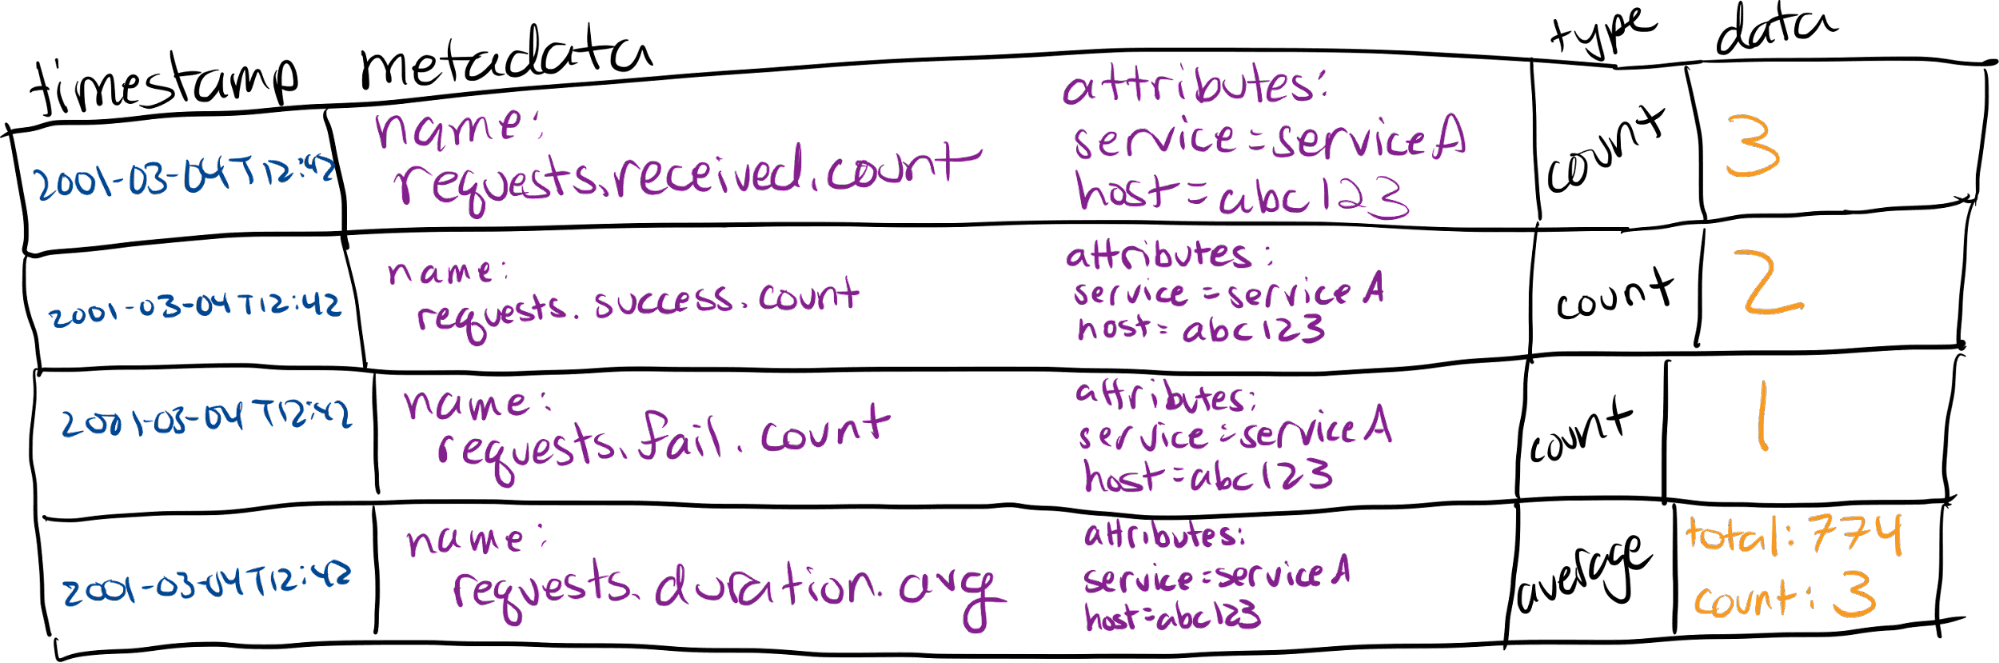
An average of 227ms leans toward the 134ms number more than it should, because there were two data points inside that 320ms average. To deal with that, our “average” monoid has a more detailed data type than integer. It stores both the total duration and the count of requests included; we can reduce those to a single “average” at any time. In a proper “average” monoid, that new request adds 134ms to the total duration, and 1 to the count of requests.
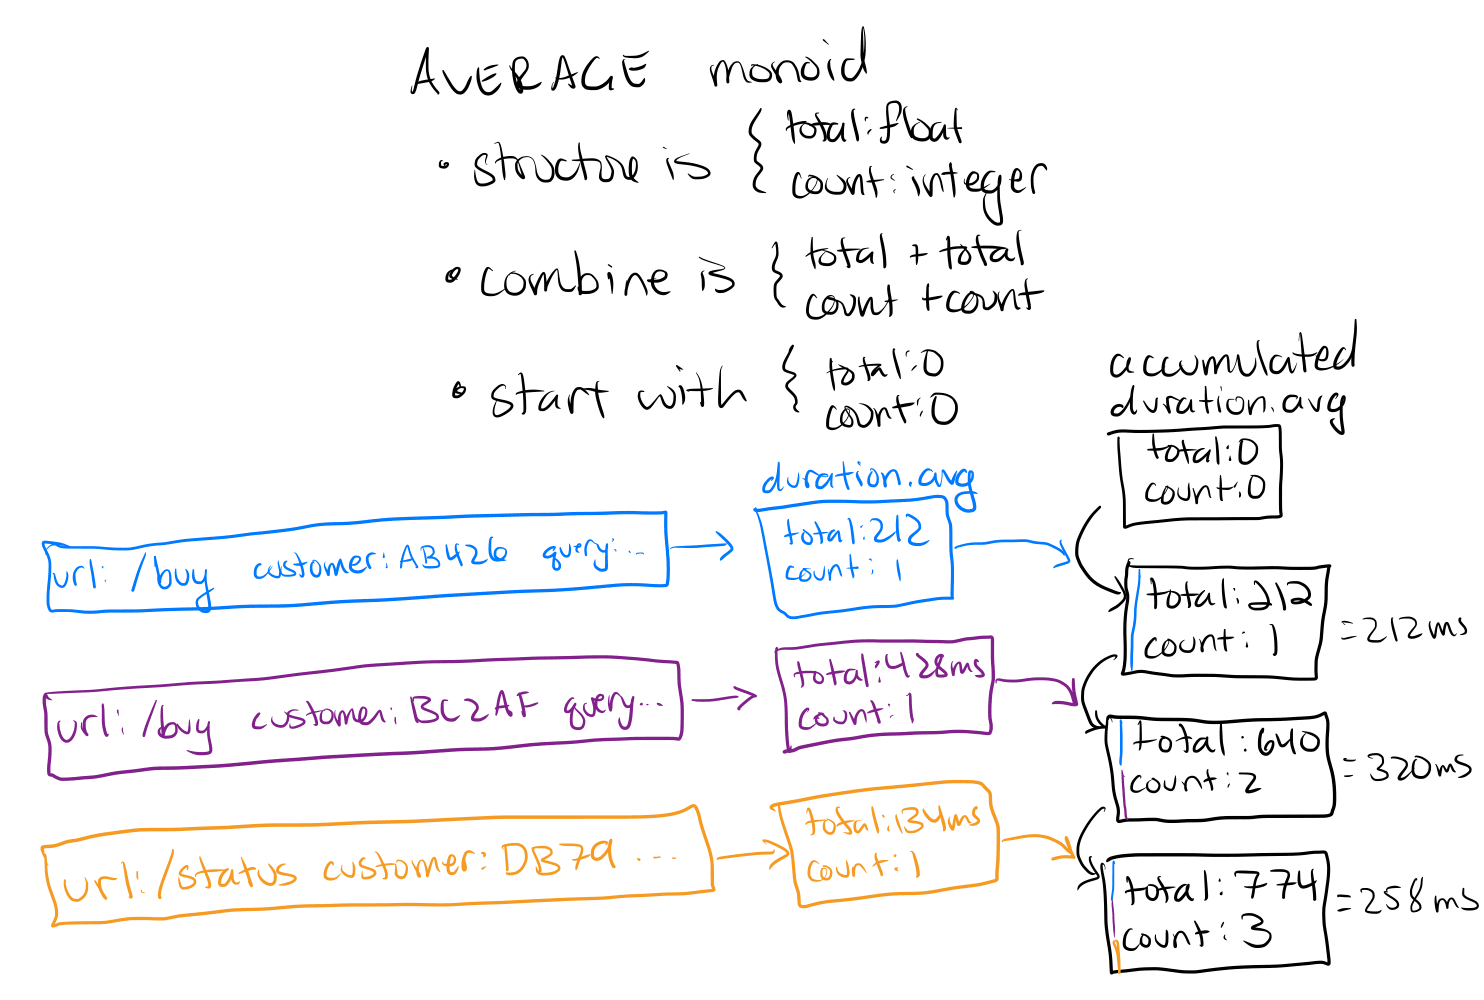
By storing enough information to let the monoid work properly, we get an accumulation of 774ms for 3 requests. To display that, we divide the total of 774ms by the count of 3 to get 258ms.
Monoids are amazing because their memory size grows sublinearly with incoming data volume. With count and average, each new value combined in does not increase the size of the data stored. Other metrics use monoids that increase in size a little. For example, a histogram might need to add a bucket.
For percentiles like P90 and P95, metrics use a more sophisticated data structure such as a q-digest. This doesn’t get the percentiles perfect, but the error is bounded and the maximum size is fixed.
How monoids turn into metrics
In addition to the monoid’s stored data, a metric includes metadata that speaks to the meaning of the number. Then each saved instance of the metric has a timestamp because we use them to represent system state over some period of time.
The beauty of metrics is each one has a fixed resource cost, regardless of our application’s scale. Transmission and storage costs don’t depend on data accumulation. The variable costs with metrics are collection interval (10 seconds, 60 seconds, 5 minutes, etc.) and how many different numbers are being accumulated (total requests per service, per url, per host, etc.). While each metric’s cost is fixed, the number of metrics may not be.
Metrics can only use their monoid magic when metadata is identical. For example, numbers can only be accumulated when each number describes itself as being a
“1-minute average cpu usage” for “host abc123” labeled as “serviceA-app” in region “us-west-1” as of timestamp 2021-09-09T00:24:02.
If we track CPU usage per host, then each hostname gets its own metric. If that “host” is a Kubernetes pod with distinguishing pod names, then each new pod creates a CPU metric when it spins up. If instead we label metrics with pod tags (for example, “serviceA-app”) then all CPU usage for pods with the same tags combine into one metric. There’s a fixed number of tag combinations, so we know how many metrics that will produce. We might have a fixed set of hostnames, so that’s still a fixed number of metrics. If we put pod names in the metadata and we spin up new pods whenever demand fluctuates, then we don’t know how many different metrics we will store. Attributes like this, which can have any number of different values, are also described as having “high cardinality.” These types of attributes break the nice fixed-size magic of our monoids.
If we add a high-cardinality attribute to our metrics (like a full request URL with query parameters), we get an explosion of different metrics, growing linearly with request volume. If we add two high-cardinality attributes, then we have as many metrics as different combinations of values—our metric volume can grow faster than the number of requests.
High cardinality undermines the magic. When using metrics, shy away from attributes with unlimited values. We like our monoids to combine with each other.
Where metrics and monoids shine
Monoids are amazing for making graphs because they combine any which way. This is the time to add request counts across hostname, to average duration across URL paths and status codes. Look at total requests with intervals of minutes, hours, or days. They’re so easy to graph!
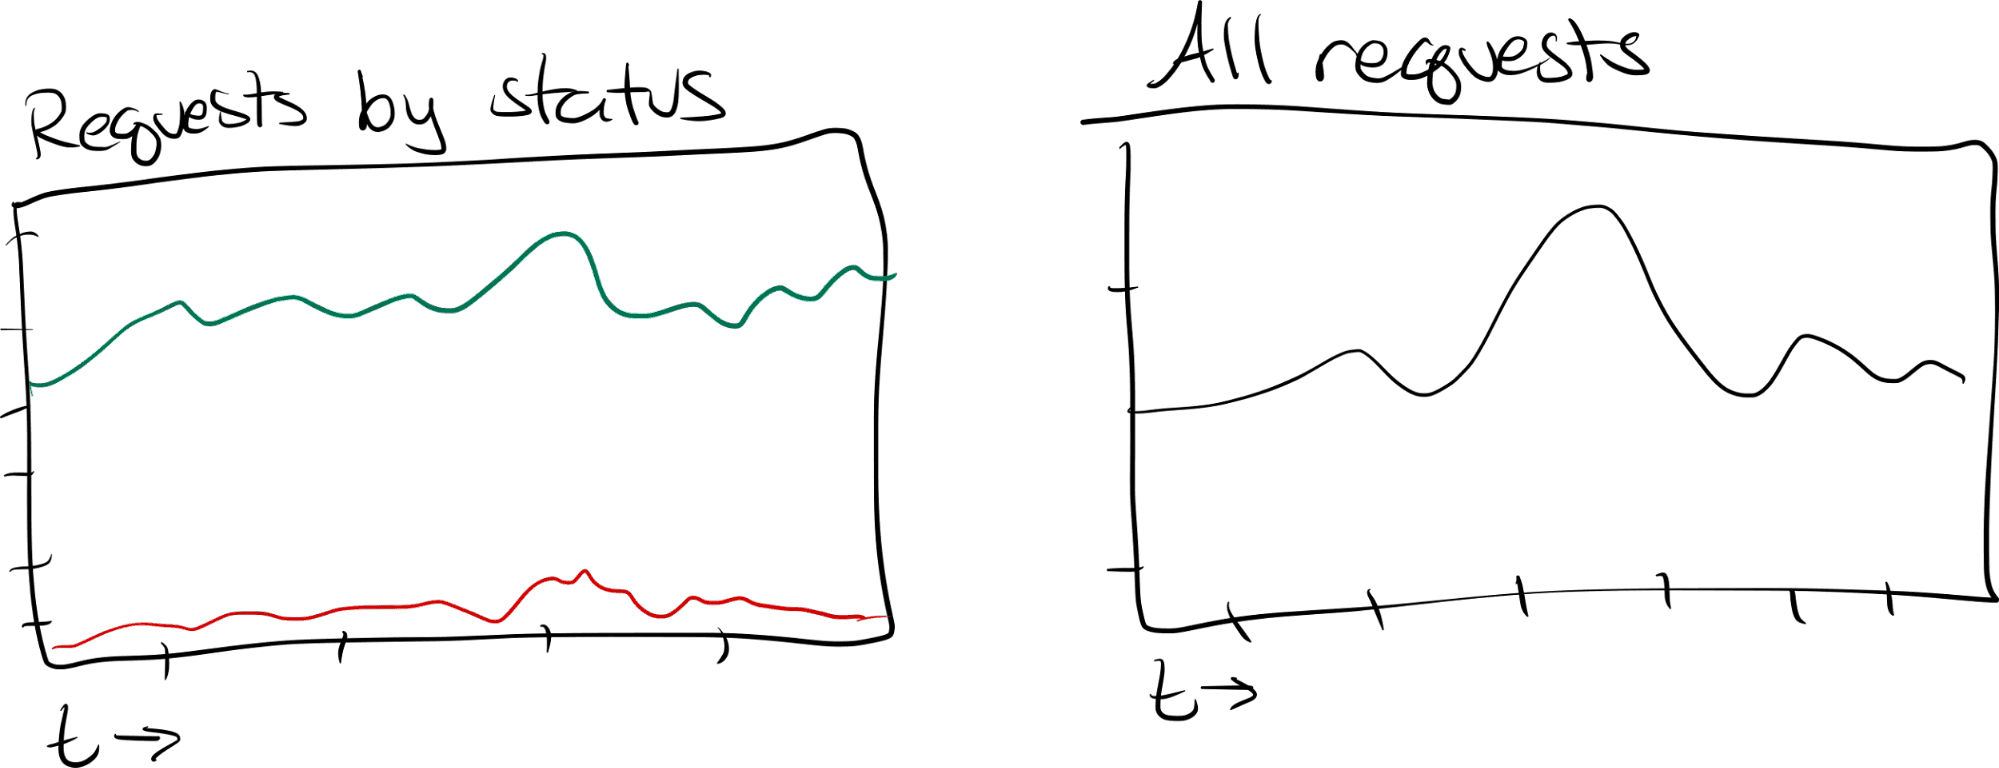
Metrics are stored as a series of numbers over time. So we can always visualize “when” a change occurred. We can see memory usage grow over time, or see that request duration spiraled above 2 seconds at 4 a.m. on Wednesday. Visualizing metrics as graphs lets us see when things became slow.
With metrics, we can know whether things are working in production and when problems occurred. But how are things working, and how are things not working? For these questions, we need to dive into details. Which requests are taking too long? Are they from a particular region, or a few important customers? Maybe they include queries that retrieved a lot of items or items from a particular partition?
Where metrics don’t shine
The catch to metrics is we can add them arbitrarily, but we can’t divide them arbitrarily. The granularity of the graph is limited by the metadata we’ve recorded. We can see the difference between failed and successful requests, if status was recorded separately. We can divide by region, if regions were recorded separately.
Should we record all of these metrics separately? Be careful! We get into that high-cardinality metric explosion.
Like every good abstraction, monoids strip away context. Metrics gain their efficient resource magic by stripping away any data that wasn’t specifically chosen as an attribute we cared about. Be stingy with metrics.
There’s a way to get any of the arbitrary graphs we need, a way to divide by any property on the request, without counting them every which way. It still uses a monoid, but it gets used later in the process.
The trick is to let each request tell its separate story, with all these attributes like full URL, customer ID, number of rows returned, and query duration. By emitting events for each request, we can store those requests whole.
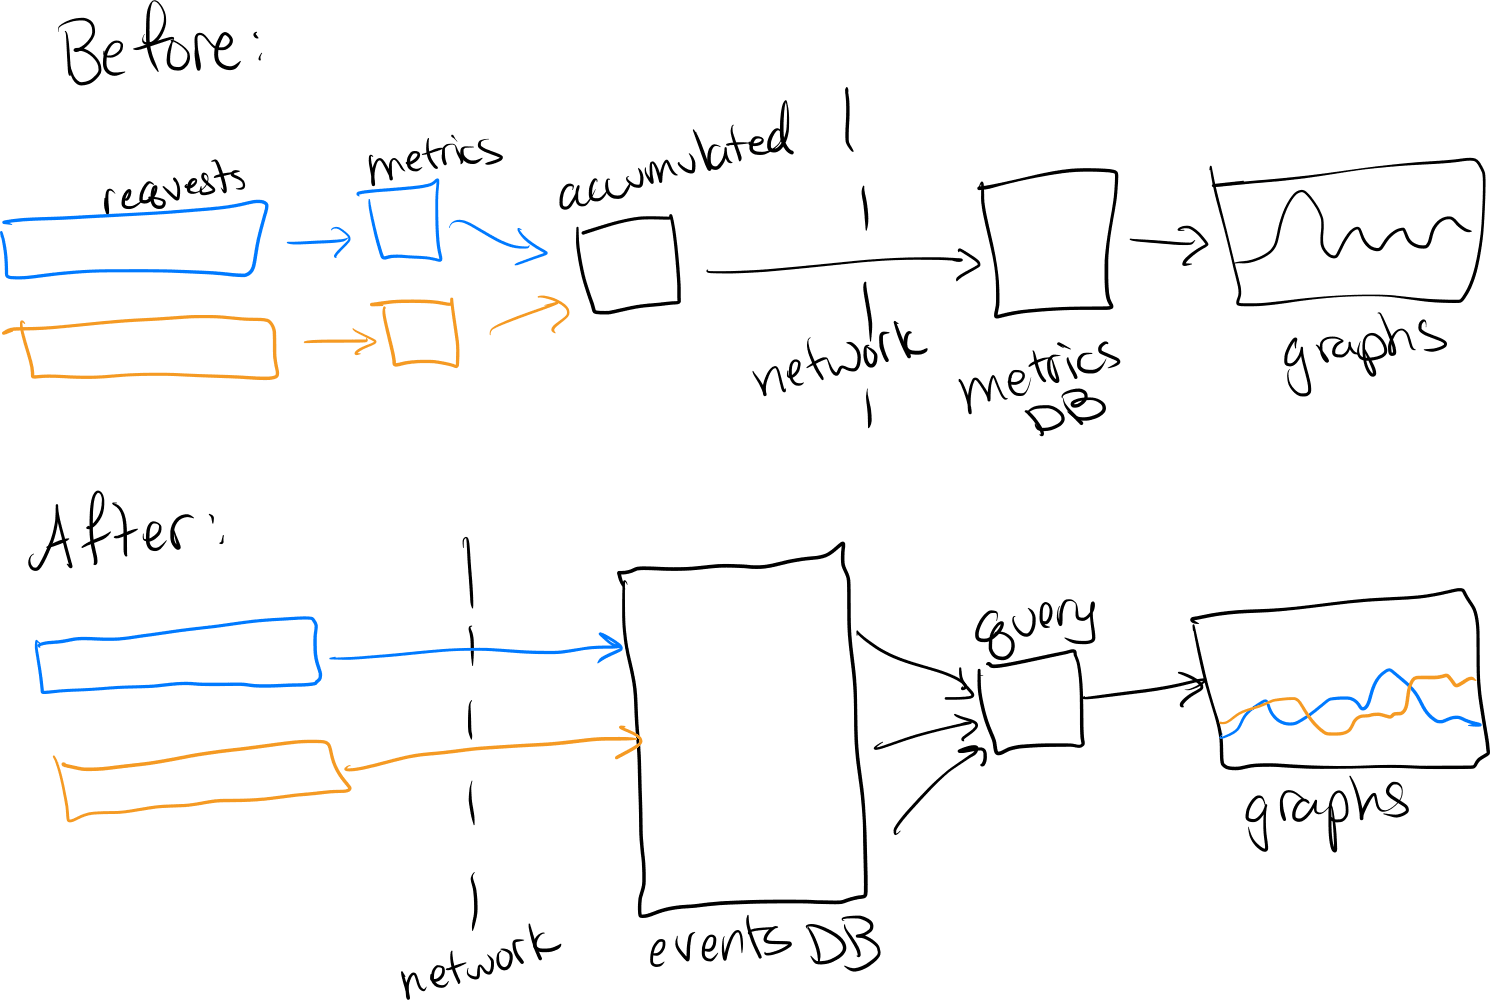
In that model, we do the counting, averaging, and histogramming at query time. From there, we get the same graphs that tell whether the software is running smoothly—like overall duration, request count, and failure count. We can also get that duration by customer ID, or where more than 10 rows were retrieved, or by any other attribute in the event.
If we store events instead of metrics, we can add them arbitrarily, and we can divide them arbitrarily too.
It doesn’t matter anymore how many different values each attribute can have. Events don’t care. Add on the full text of a database query! Then we can see which database queries are slower than expected.
Events (especially as traces) give us the story of each slow request. There’s no need to correlate with logs to piece together what happened. This way, the same events that show us when something is wrong can also show us why it’s wrong.
Twenty or 40 years ago, disk and network traffic were extremely limited. We needed to reduce our information footprint to a few small numbers before gathering it and storing it. Metrics were perfect for that.
Metrics are still perfect for numbers like CPU and memory usage. We don’t want an event at each memory allocation; we want a general idea of how memory looks in our runtime. These aren’t specific to our software, and customers don’t care about them directly. CPU usage might be relevant to the story of a request, so we can put it on the request event. Or record it regularly as a metric, or both. Metrics are good enough for infrastructure; our application’s work is worth events.
With modern disk and network capacities, we can afford to emit events full of attributes about everything that might matter to our application. We practice networked logging, so we can practice networked tracing too. And if that happens to become too much data, we have modern sampling technology to choose representative events; it allows us to choose which stories we need and want to keep.
When it comes to data about our applications—to requests that impact our customers—don’t throw away the story and context by reducing it to metrics. Send the whole event, then extract metrics as you need them.
We can do more than keep our software running. We can keep our product improving, growing more reliable and more useful all the time. As developers, we can put the code on our team: enlist the software to teach us about its problems and its inner workings. This is what a product team needs; this is observability.
To see more of how this works, check out Honeycomb’s take on balancing metrics and events. Or sign up for a free Honeycomb account and try it out for yourself.
Want to know more?
Talk to our team to arrange a custom demo or for help finding the right plan.