Metrics—the gateway to your systems
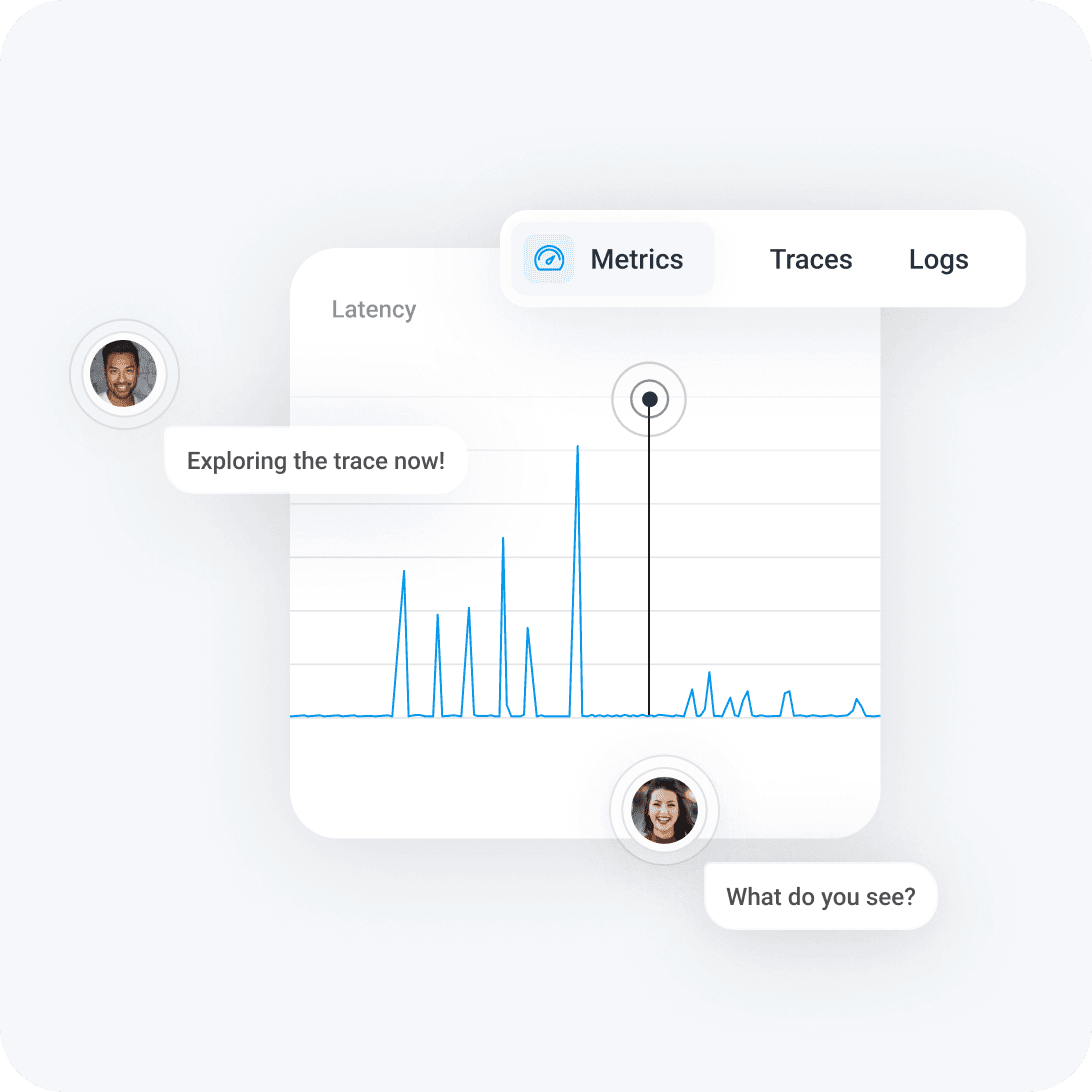
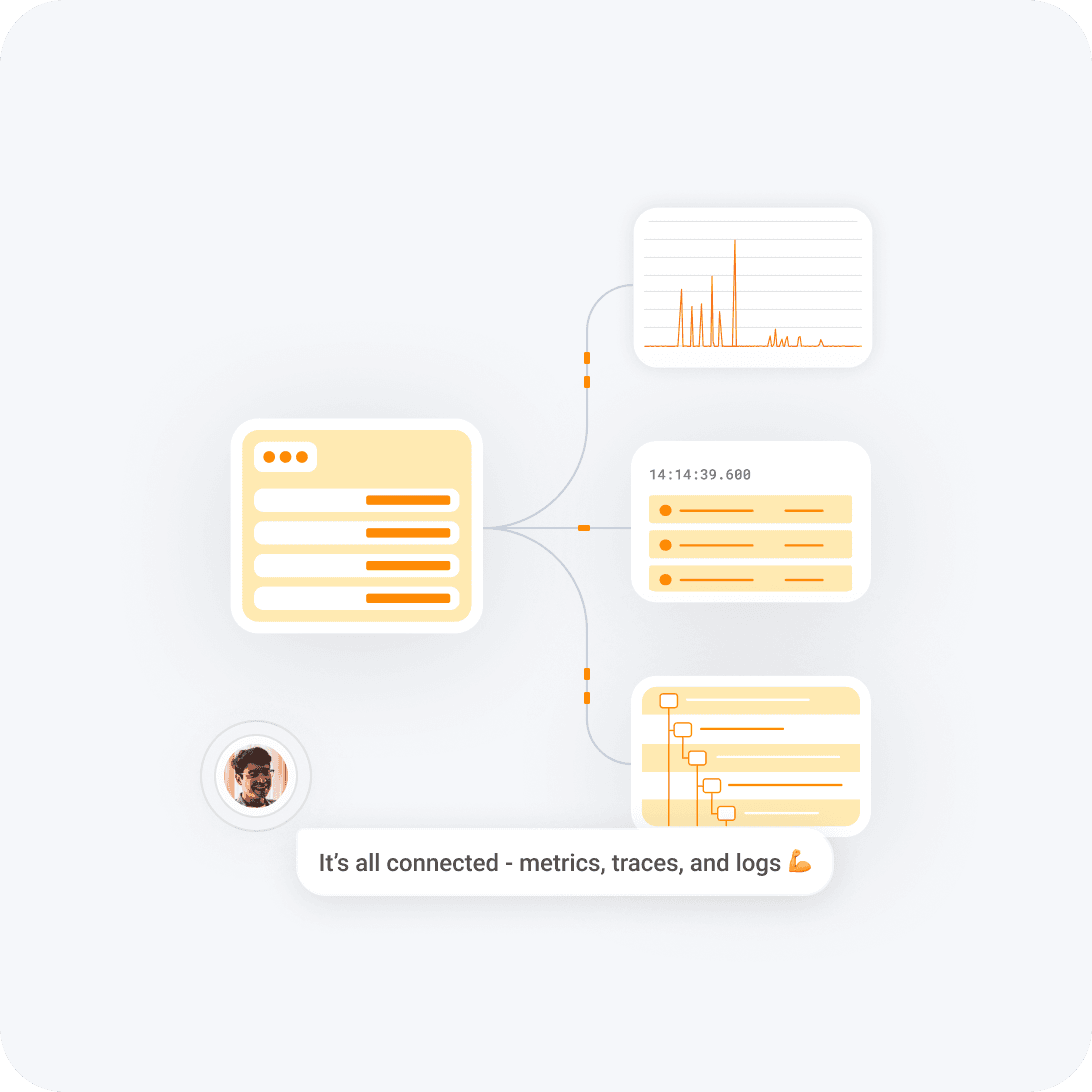
In Honeycomb, Metrics are more than just an alarm system. They are the starting point for understanding your systems. Connect key performance metrics to detailed logs and traces to get the full picture so you can stop issues from becoming emergencies.
Why you’ll love Honeycomb
End the cardinality tradeoff
Honeycomb Metrics uses two models: a time series database for capturing infrastructure metrics at scale, and an events-based model for capturing application and business metrics in full detail, with unlimited cardinality.
Fix issues faster
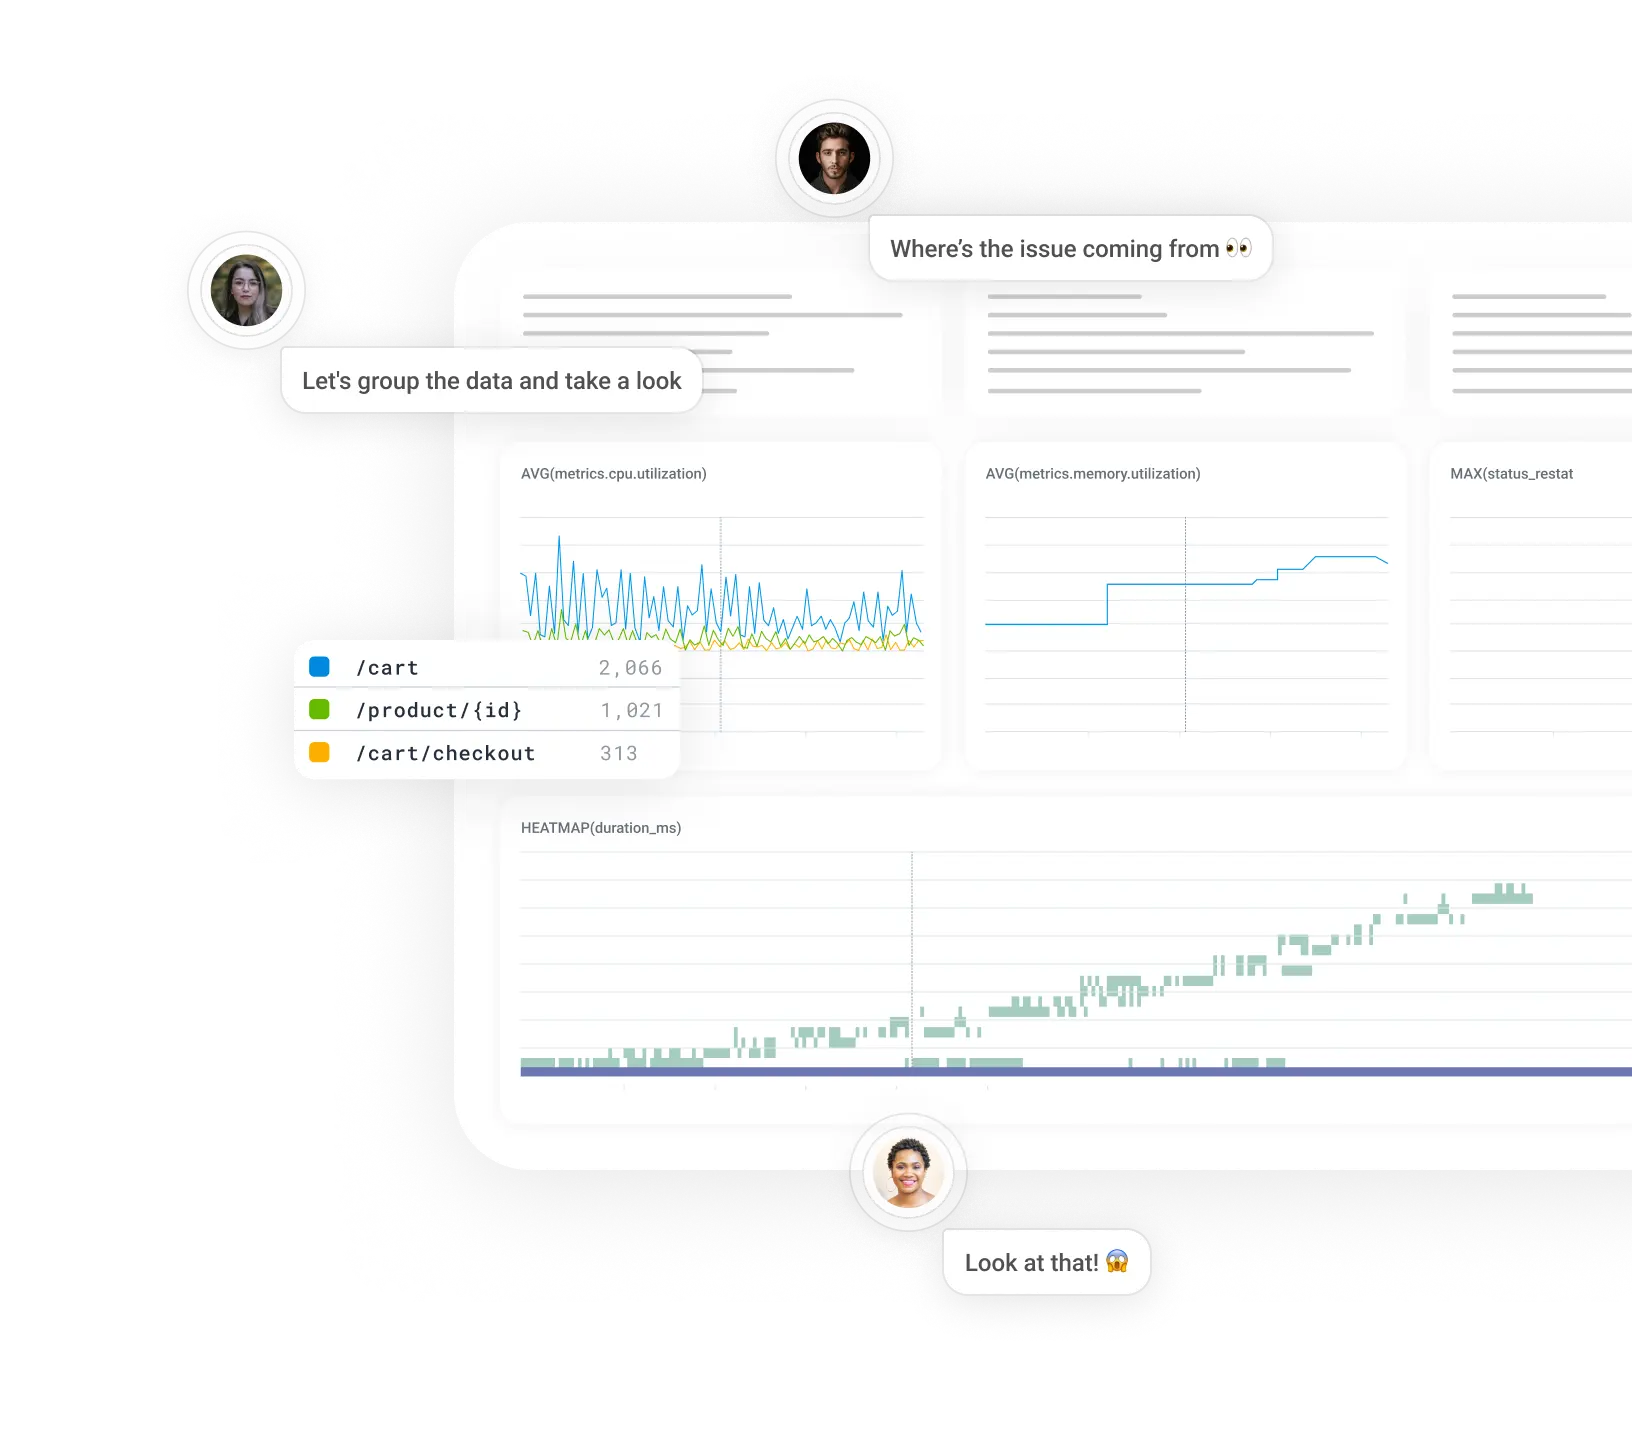
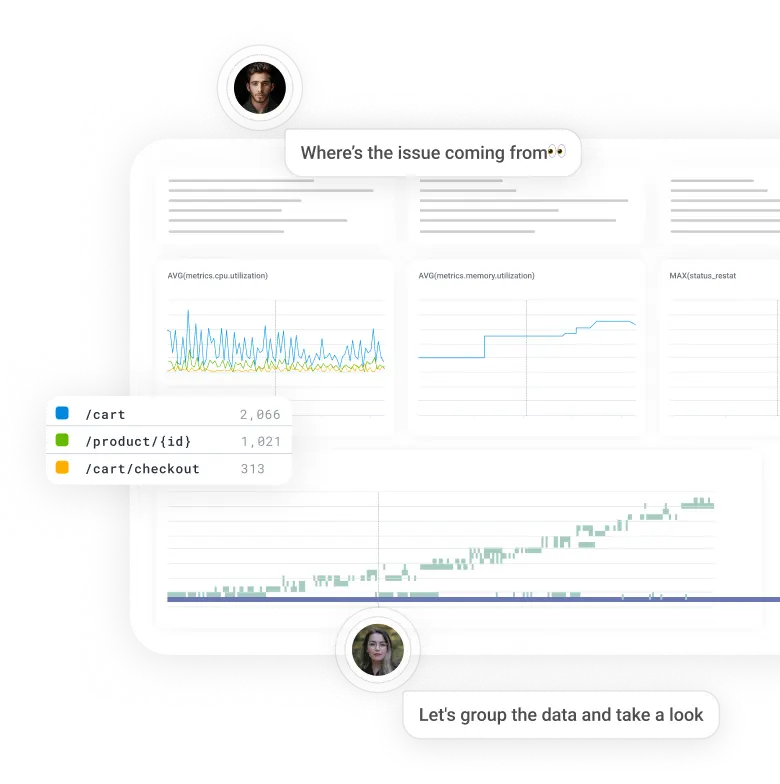
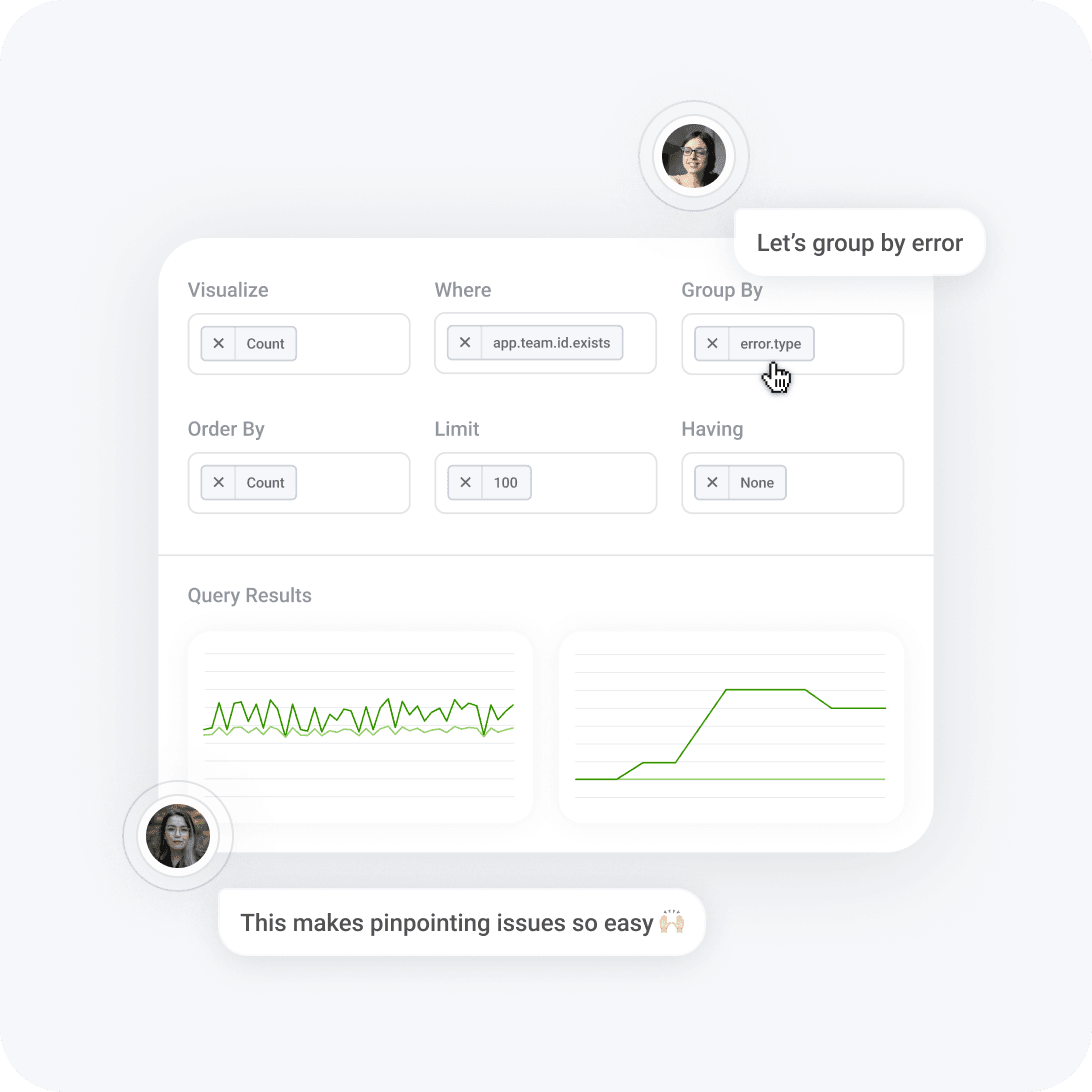
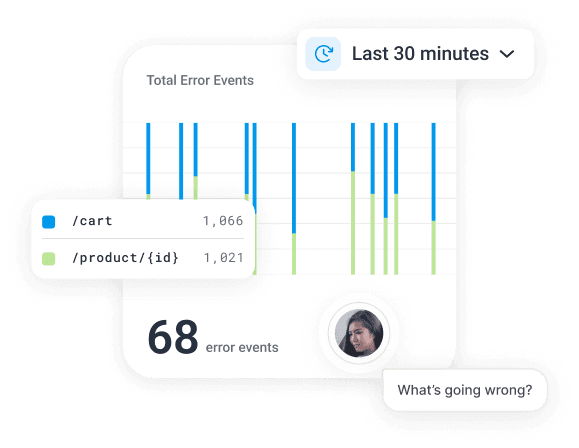
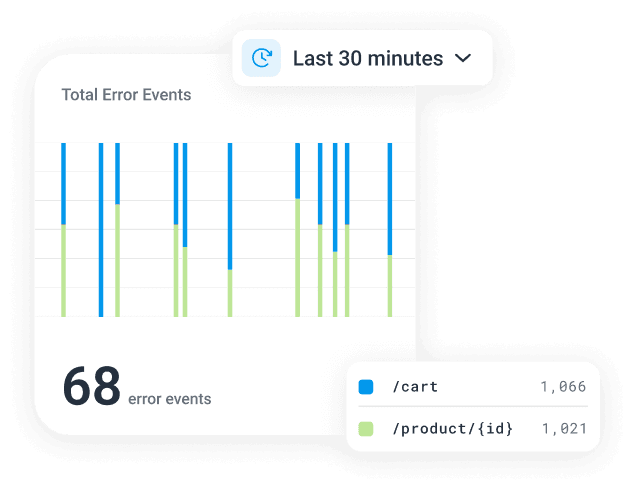
Don’t hop from metrics tools, to logs, to traces, and back. Go straight from an error count to the underlying traces. Then bubble up outliers to understand what’s different about the requests that failed.
Monitor and debug together
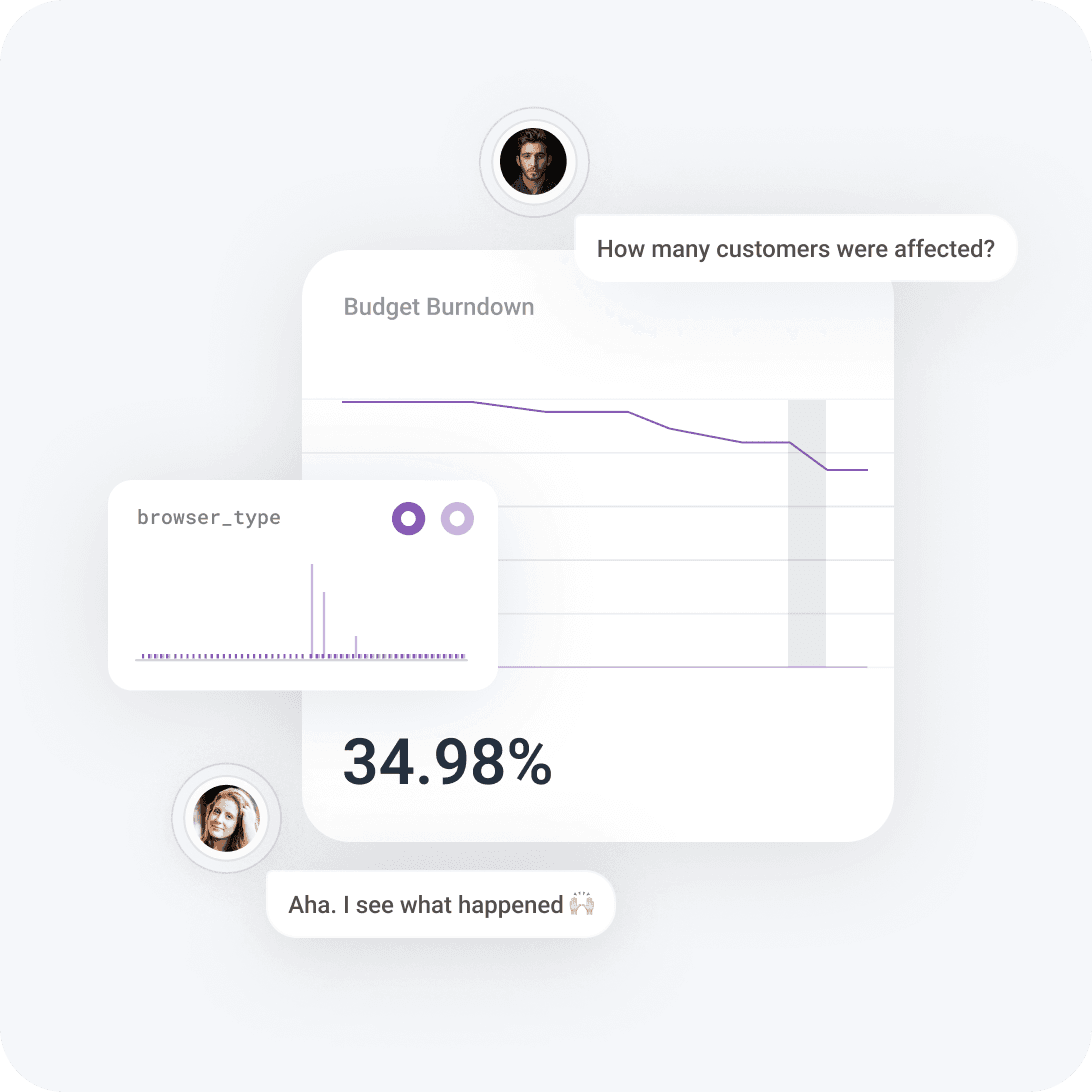
A problem shared is a problem solved. Every query result you view is sharable in Slack, and available forever for your incident histories.
See how it works
Watch a demo or try it for yourself in our sandbox—no registration required.
Why use Honeycomb for Metrics?
Agent-ready observability
Honeycomb preserves the custom metrics and high-cardinality details, like unique IDs, that can cripple other metrics platforms. Give your AI agents the best possible data foundation with metrics, logs, and traces in a single high-speed platform.
Free custom metrics
Every field that you log is automatically available as a custom metric. Which specific store is seeing the worst latency right now? Which customers cost you the most in database compute? Don’t let your metrics platform force you to choose between budget and data.
Modern approach designed for high cardinality
The cloud-native world is full of high-cardinality data. Want graphs broken down by service, pod, instance, app, git commit, browser version, UUID—or some combination of the above? Get your answers, superfast, and move on to the next problem.
Best-in-class Service Level Objectives (SLOs)
Set error budgets aligned with business goals so that you know when to prioritize problem solving, or focus on building. When an alert fires, action immediately—Honeycomb’s SLOs are calculated directly from the telemetry engineers use to debug.
Before Honeycomb, our engineers kept having to choose between getting the data they needed and keeping costs under control. Moving metrics to Honeycomb means we can continue collecting time series data for standard metrics, covering more than 100 million users. But we can also add the dimensions to events, like host IDs and container metadata, without worrying about cardinality-based billing blowing up.

Engineering Manager
Notion
Related features
Discover our full suite of features, giving you everything you need to easily solve problems.
Experience the power of Honeycomb
Jump into our sandbox to start exploring Honeycomb for Metrics.


Want to know more?
Talk to our team to arrange a custom demo or for help finding the right plan.