Monitoring Cloud Database Costs with OpenTelemetry and Honeycomb
In the last few years, the usage of databases that charge by request, query, or insert—rather than by provisioned compute infrastructure (e.g., CPU, RAM, etc.)—has grown significantly. They’re popular for a lot of the same reasons that serverless compute functions are, as the cost will scale with your usage. No one is using your site? No problem: you’re not charged.

By: Martin Thwaites

In the last few years, the usage of databases that charge by request, query, or insert—rather than by provisioned compute infrastructure (e.g., CPU, RAM, etc.)—has grown significantly. They’re popular for a lot of the same reasons that serverless compute functions are, as the cost will scale with your usage. No one is using your site? No problem: you’re not charged.
The general model of these systems is that you pay a minimum, with additional “burst” capabilities when needed. If you’re at or around your minimum for the majority of the time, you’re doing great. If you’re always hitting high amounts of “units” (the general currency of these databases), you’re probably going to have a bad day (or at least your bank balance will).
As we’re charged for each request, it’s more important than ever that we ensure we’re optimizing the queries as much as possible. Not only do we need to make sure that they’re fast, but they also have to be efficient (in terms of the charge from the provider). Gone are the days where you’d have a dashboard with your SQL Server Metrics on, looking at whether the average CPU was hitting 60-70% and then adding more. But don’t worry, that doesn’t mean we lose visibility. In fact, we now have a much better avenue for understanding, as we can correlate individual queries and operations to your actual cost.
In previous incarnations of databases (I’m looking at you, SQL Server—and the years I put into you), it was more important to optimize for response time and how much was loaded into memory. Optimizing to avoid full table scans (I still have nightmares that involve the query planner view in SQL Server) and returning only the data you need, hopefully from an index. Nowadays, we don’t “really” care what’s loaded into memory, or how many cores it’s using—that’s the provider’s job. We just want our data fast—to hell with the consequences! Well, not exactly.
Query-specific performance
Thankfully, the two main providers that I’ve used (AWS DynamoDB and Azure CosmosDB) will tell you the cost of the query when you create it.
For AWS DynamoDB, you can get granular information about the Indexes used and their Read/Write units, along with the totals at a table level.
For Azure CosmosDB, you can get the total RU (Request Unit) charge for the request.
This means that you can add all that information to your spans and do some interesting analysis within Honeycomb.
Here are two examples using .NET and the relevant SDKs.
DynamoDB
 using var activity = Source.StartActivity("Get data from DynamoDb");
        const bool ConsistentRead = true;

        var resp = await _db.GetItemAsync(TableName,
            new Dictionary<string, AttributeValue> {
                { partition, new AttributeValue(documentId) }
            },
            ConsistentRead);

        activity?.SetTag("dynamodb.read_units", resp.ConsumedCapacity.ReadCapacityUnits);
        activity?.SetTag("dynamodb.table_name", TableName);
        activity?.SetTag("dynamodb.partition", partition);
        activity?.SetTag("dynamodb.is_consistent_read", ConsistentRead);
        activity?.SetTag("dynamodb.document_id", documentId);

        var doc = Document.FromAttributeMap(resp.Item);
        return JsonSerializer.Deserialize<MyDbItem>(doc.ToJson())!;
}CosmosDB
public async Task<MyDbItem> GetCosmosData(string documentId, string partition)
    {
        using var activity = Source.StartActivity("Get data from Cosmos");

        var item = await _container.ReadItemAsync<MyDbItem>(documentId,
            new PartitionKey(partition));

        activity?.SetTag("cosmos.request_charge", item.Headers.RequestCharge);
        activity?.SetTag("cosmos.container_id", _container.Id);
        activity?.SetTag("cosmos.database_id", _container.Database.Id);
        activity?.SetTag("cosmos.partition", partition);
        activity?.SetTag("cosmos.document_id", documentId);

        return item.Resource;
}Querying in Honeycomb
Now that we have data pushing into Honeycomb, we can create interesting queries to see patterns in that data.
First, let’s do a heatmap of the charge data:
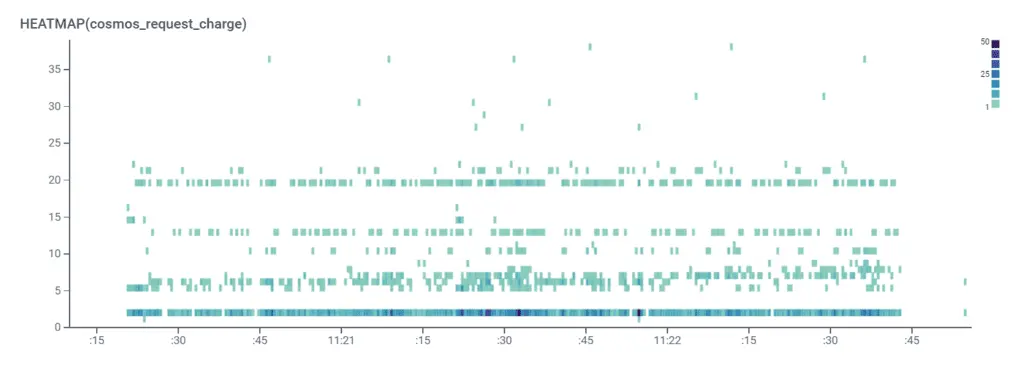
With CosmosDB and DynamoDB, we’re aiming for each request to be around one or two units. This signifies that we’re doing a “Point Read” on the data, which means that we’re passing the partition and the document ID. From this graph, we can see that the majority of our calls are around the one to two RU level.
We can see that there are trends around different tiers. From here, we can use BubbleUp to see what’s common about each of those tiers.
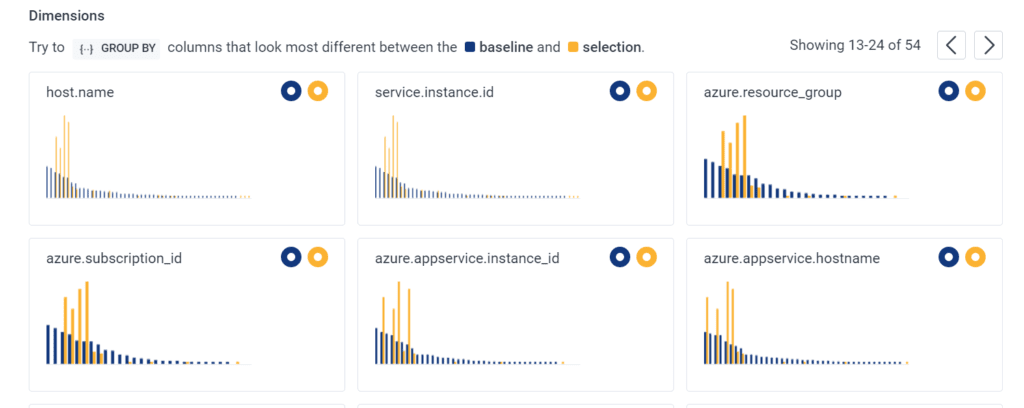
Let’s drill in further to work out where the big cost is coming from. More instrumentation around your functions in code will help. Maybe adding the context of the database call, hashed versions of the parameters if they contain PII, or the query if you’re using SQL. All of this will help BubbleUp provide you with interesting analysis of your calls.
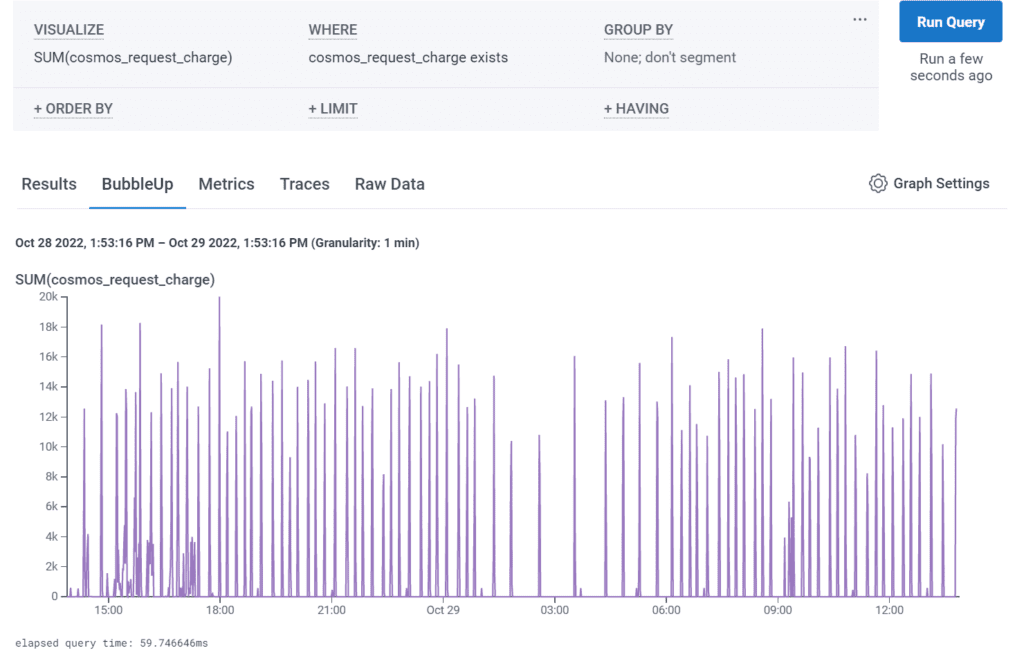
Further to a heatmap, perhaps, you want to work out the average Units by trace? We can do `SUM(cosmos.request_charge)` and `GROUP BY trace.trace_id`.

With this information, you can see:
- Traces that span multiple seconds, and have different calls to the database, with different costs in the graph view.
- The total cost of each of the traces in the results view.
How to reduce your database costs
One thing to watch out for is that both DynamoDB and CosmosDB charge based on document size, but they also charge on what indexing you’re using. For instance, if you have Global Secondary Indexes or Local Secondary Indexes in DynamoDB, your Write units will increase when you insert. For CosmosDB, the default is to index every field in the document, which massively inflates your RU costs for inserting.
Try to use Point Reads where possible. That means you know the partition/document ID or primary key. These have guaranteed throughput characteristics, meaning they’re easier to predict from a scale perspective, but they also have predictable costs.
If you need to do scans, try to do more within a single call. Bring back a dataset that includes all the properties you need for all the calls. You may end up paying marginally more on a single call, but you’ll end up paying less overall as there’s an initial cost for each query.
As you do these, you can monitor the ongoing costs in Honeycomb at a high level with a simple `SUM(cosmosdb.request_charge)` and group by the container. In DynamoDB, you can monitor the Read and Write Units by Index, and table.
You should also consider whether implementing CosmosDB cache—or DynamoDB’s DAX layer—will reduce costs if you’re on a Read-heavy workload.
Conclusion
There are lots of ways to optimize your usage of databases that charge by the request, from changing query patterns and document composition to caching. The constant, however, is monitoring request performance at a granular level. Knowing where your costs are, on an ongoing basis, is the single biggest lever you have to reducing those costs.
There are some really interesting visualizations you can make in Honeycomb for your request costs. Running heatmaps and using BubbleUp will get you some relevant data incredibly fast. Our very useful free tier provides 20 million events every month. Try it out today!
Want to know more?
Talk to our team to arrange a custom demo or for help finding the right plan.