Observability and the DORA metrics
The Accelerate State of Devops Report highlights four key metrics (known as the DORA metrics, for DevOps Research & Assessment) that distinguish high-performing software organizations: deployment frequency, lead time for changes, time-to-restore1, and change…


The Accelerate State of Devops Report highlights four key metrics (known as the DORA metrics, for DevOps Research & Assessment) that distinguish high-performing software organizations: deployment frequency, lead time for changes, time-to-restore, and change fail rate.
Observability can kickstart a virtuous cycle that improves all the DORA metrics.
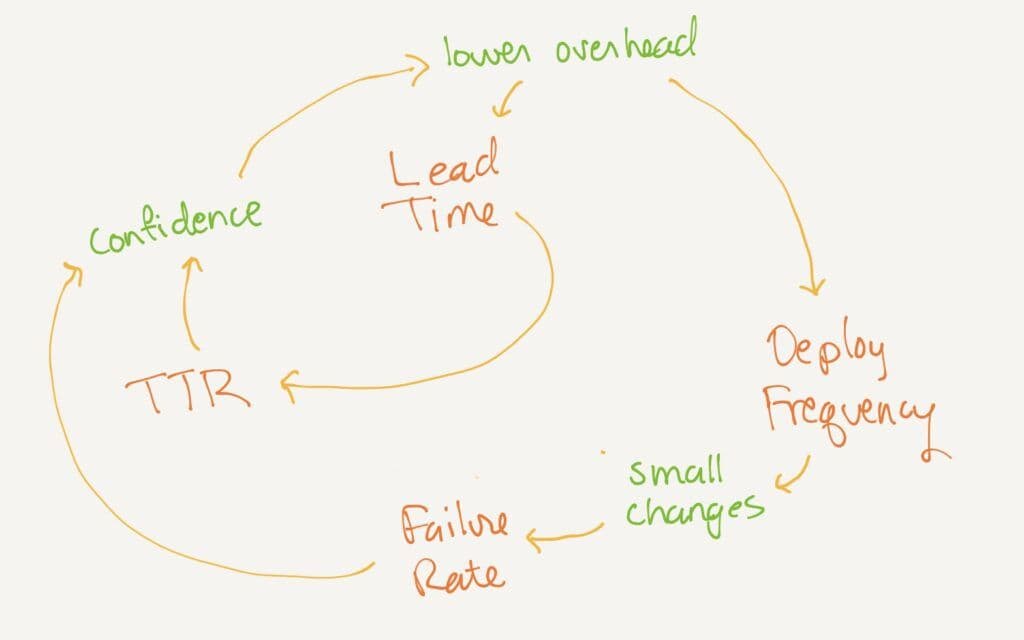
The DORA metrics reinforcing loop
Everyone wants a low failure rate and quick restoration in case of failure. Everyone also wants to ship software faster, so it helps to deploy quickly (low lead time for changes) and frequently.
The DORA metrics are powerful because it seems at first like there’s a tradeoff between them—if you deploy quickly with fewer checks, logically that would increase failure rate. However, the research says these things all improve together. The DORA metrics reinforce each other!
- If you reduce overhead to make deploys quicker (shorter lead time for changes), then the time-to-restore goes down, because people remember what they deployed. It’s still in their heads; they understand what changed and can fix it more quickly. Also, lower overhead lets you deploy more frequently.
- If you deploy more frequently, then each deploy has fewer changes. That means fewer surprising interactions between changes, which reduces change failure rate. Also, time-to-restore goes down, because there are fewer possible causes to check.
- When failures are fewer and time-to-restore is shorter, then the organization becomes less reluctant to deploy. This helps you lower overhead, therefore lead time. The organization also becomes willing to deploy more frequently (including on Fridays).
The DORA metrics form a reinforcing feedback loop: improving one makes it easier to improve the others.
Reinforce this loop with observability
When a deployment fails, we can understand the problem quickly if we understand the change that we deployed. Shorter lead time contributes to understanding change, and therefore understanding problems. Let’s add these to the diagram:
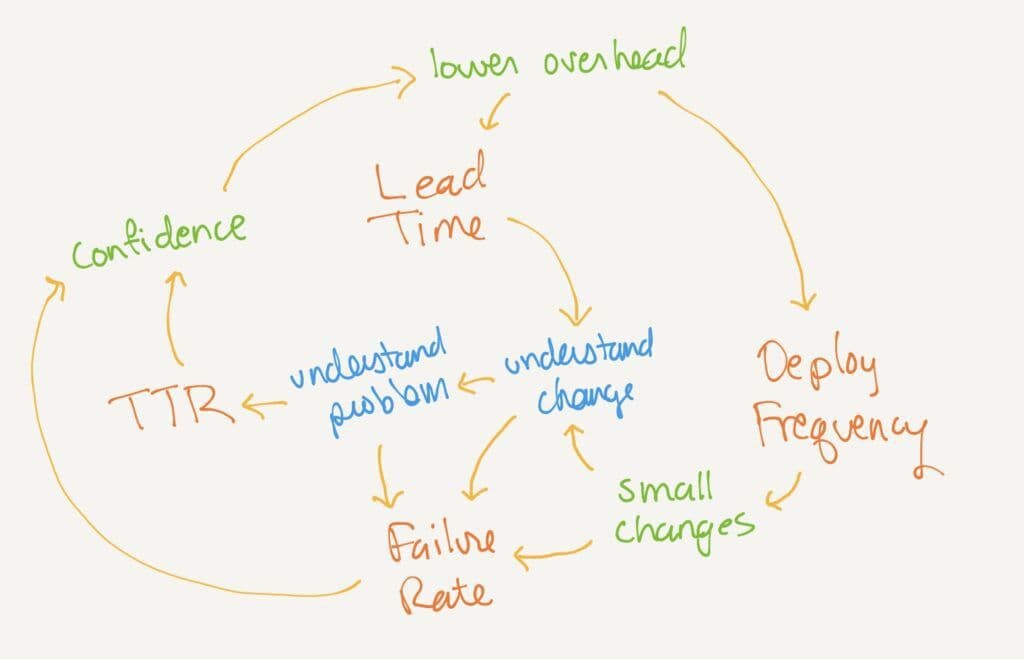
Understanding the problem reduces time-to-restore immediately. It also helps us reduce change failure rate in the future.
Understanding the change reduces failure rate, as developers know what to look for when integrating a change and in progressive deployment. For instance: at Honeycomb, we deploy to an internal-only instance of production first, and developers can stop the customer-facing deploy if they spot a problem. They’re more likely to understand the problem while they understand the change.
There’s one obvious tie-in to observability: observability helps directly with time-to-restore. But there’s a much deeper effect. With observability, the DORA metrics improve each other.
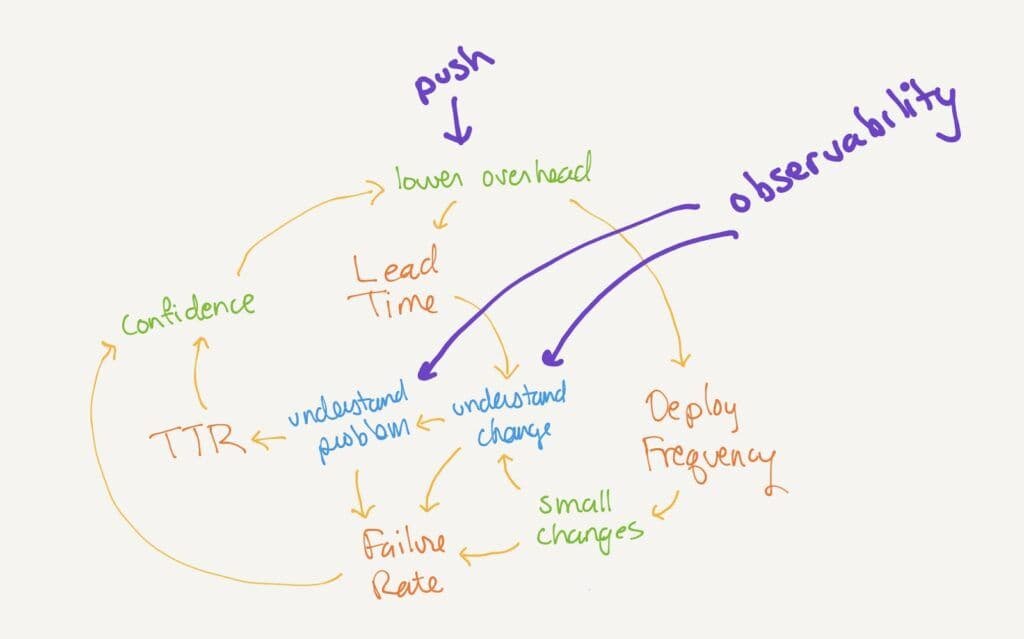
Observability feeds understanding
Observability affects each of these directly:
- When developers incorporate observability into the features they deploy, they can look at how that change operates locally, in test, and then in production. They can spot differences, including interactions with other new features. They understand that change not only in the code, but at runtime.
- Observability gives SREs and on-call developers a spotlight on what is failing, under what circumstances, and exactly where. They can drill into what is different about the failed requests and what a failed request looks like in a trace. They understand the problem quickly, and they can fix it (or call the right person). This also helps them prevent it from happening again.
Understanding our changes and the problems that occur raises confidence directly, as well. This helps us reduce deploy overhead. In all these ways, observability strengthens the reinforcing loop that improves all the DORA metrics simultaneously.
Kickstart the DORA metrics loop with observability
The trick with a virtuous feedback loop is getting it started in the right direction. If your organization has low confidence and high overhead for deployments, then you can remain stuck there. Every software change is expensive and slow.
One recommendation is to start by improving lead time. Reduce that overhead with careful automation, and then choose to deploy more frequently. That does require changes in organizational procedures (eliminating manual approvals), which can be politically difficult when confidence is low.
Observability is another place you can start. Implement distributed tracing and integrate that with your alerts; this addresses understanding the problem and reduces time-to-restore. Then, encourage developers to make new features visible in traces, helping everyone understand each change. Look at those traces after all changes are integrated to reduce the failure rate. As the organization gets more confident in making change, work to reduce the overhead of each one.
Ideally, do both! Make your build pipeline observable, and use those performance insights to improve lead time.
Improve your DORA metrics because they correlate with high-productivity, high-business-value development organizations (observability helps with that in other ways, but that’s a different article). Deliver quickly and more reliably.
Observability is an essential part of this, and Coveo is living proof. Read more about how they lowered time-to-restore with Honeycomb.
1 I use “time-to-restore” instead of Mean Time to Restore (MTTR). Outages are not described by a normal distribution, so the mean (average) does not mean what you think it means.
Want to know more?
Talk to our team to arrange a custom demo or for help finding the right plan.