OpenTelemetry vs OpenTracing | Understanding OpenCensus and Related Terms
This guide provides clarity on past and current projects, how they differ, and what you need to know to futureproof your observability stack.

By: Rox Williams

The Director’s Guide to the Future of Observability: AI, OpenTelemetry, and Complex Systems
Watch Now
Today’s applications are highly distributed and composed of dozens, sometimes hundreds, of microservices working together to deliver a single user experience. As the complexity in our systems has grown, so has the need for unified, scalable, and vendor-agnostic telemetry data collection, especially for microservices tracing. To meet this need, the ecosystem of observability has evolved.
Early standardization efforts, including OpenTracing and OpenCensus, eventually merged into a single industry standard: OpenTelemetry. Now the most widely adopted framework for traces, metrics, and logs, OpenTelemetry provides the unified model the ecosystem has long needed. Many systems still rely on OpenTracing, one of the earliest vendor-neutral API solutions for distributed tracing, which is now in maintenance mode.
This guide provides clarity on past and current projects, how they differ, and what you need to know to futureproof your observability stack.
What is OpenTelemetry?
OpenTelemetry is an open-source observability framework and one of the most active projects under the Cloud Native Computing Foundation (CNCF). It standardizes how applications generate, collect, and export telemetry data, enabling teams to gain visibility across distributed systems.
In 2019, the CNCF announced that OpenTracing and OpenCensus would merge into OpenTelemetry to eliminate fragmentation in telemetry standards and tooling. OpenTelemetry has since become the default choice for modern observability, supported by major cloud providers, APM vendors, and ecosystem contributors.
Core components of OpenTelemetry
Instrumentation libraries
These are language-specific libraries and auto-instrumentation agents that capture telemetry from applications and frameworks with minimal developer intervention.
APIs and SDKs
- API: Defines the interface for creating traces, metrics, and logs.
- SDK: Implements processing, batching, sampling, and exporting of telemetry.
Collector
A standalone, vendor-agnostic proxy for receiving, enriching, batching, transforming, and exporting telemetry to one or multiple backends.
Exporters
Exporters allow users to send data to an observability backend such as Honeycomb, or any system that supports OTLP or other supported formats.
Architecture overview
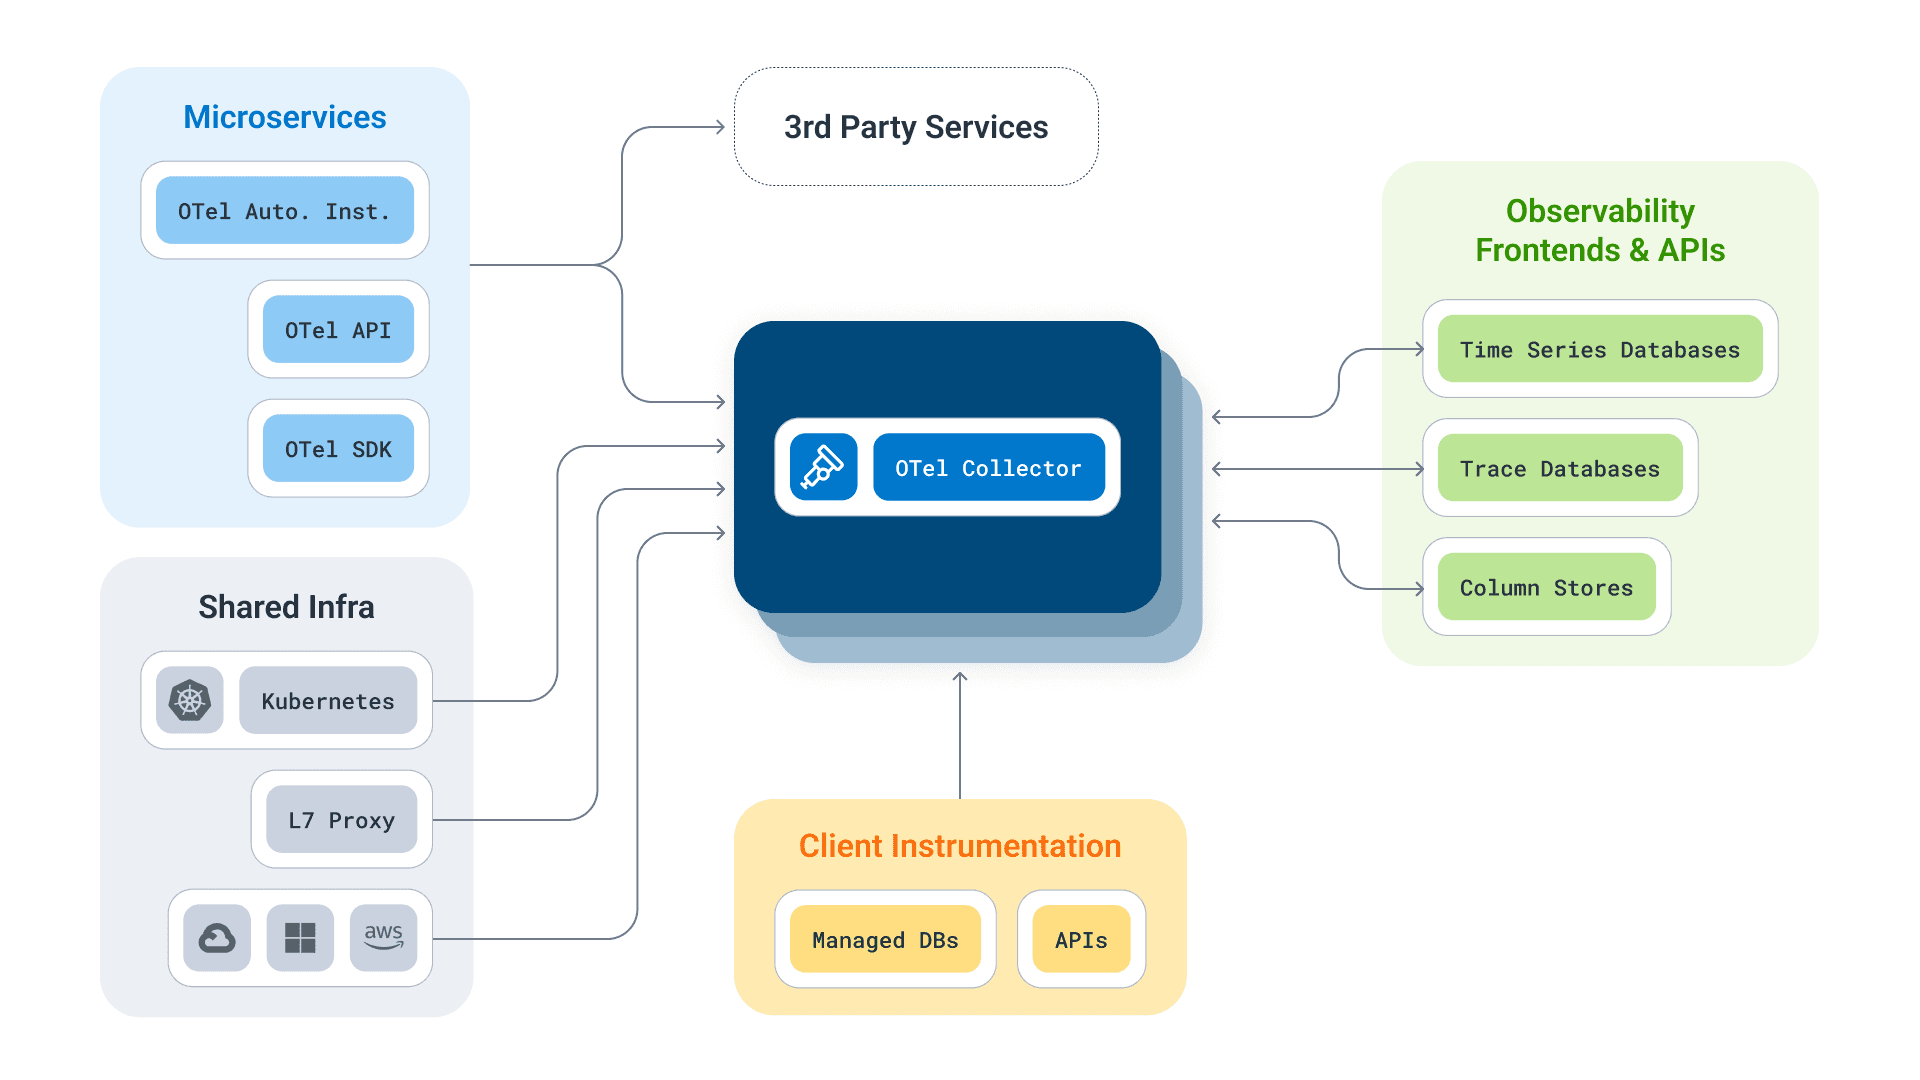
OpenTelemetry’s architecture is modular and signal-agnostic. It separates telemetry creation (via APIs), processing (via SDKs), and routing/management (via the Collector). This separation of concerns makes OpenTelemetry highly extensible, scalable, and suitable for complex distributed systems, regardless of language, framework, or vendor.
What was OpenTracing?
OpenTracing was an open-source, vendor-neutral API specification for distributed tracing. Before OpenTracing, tracing systems such as Jaeger, Zipkin, and Lightstep implemented incompatible instrumentation formats, creating fragmentation and high switching costs. OpenTracing introduced a standardized tracing API that allowed applications to be instrumented once and used with any compliant backend.
Launched in 2016 under the CNCF, OpenTracing played a key role in driving interoperability. It unified terminology, standardized tracing semantics across languages, and laid the foundation for today’s tracing ecosystem. Although influential, OpenTracing is now in maintenance mode and fully superseded by OpenTelemetry.
How OpenTracing works
OpenTracing provides a consistent API that developers use to create spans, propagate context, and describe what happens as a request moves across a distributed system. Any backend that supports the OpenTracing standard (such as Jaeger, Zipkin, or Lightstep) can process this data.
Key concepts in OpenTracing
Trace
A complete record of a request as it flows across multiple services or components.
Span
A single unit of work within a trace (such as an HTTP request or database query). Spans include timestamps, metadata, and relationships to other spans.
SpanContext
The identifiers that allow spans to be linked across process or service boundaries.
Context Propagation
The mechanism for passing SpanContext between components so traces remain connected.
Tags
Key–value metadata that adds additional context (called “attributes” in OpenTelemetry).
What was OpenCensus?
OpenCensus was an open-source project that provided APIs and libraries for collecting both distributed traces and metrics. It included exporters that sent telemetry to multiple backends, as well as a proxy component for transforming data before it left the system.
Compared to OpenTracing:
- OpenCensus supported both traces and metrics
- OpenCensus was more opinionated (SDKs, built-in defaults)
- OpenCensus included a proxy that functioned somewhat like an early, limited version of the OpenTelemetry Collector.
OpenCensus is also sunset and superseded by OpenTelemetry.
OpenTelemetry vs OpenTracing
OpenTelemetry incorporates the best aspects of OpenTracing and OpenCensus, but goes further by offering:
- Full specifications for APIs and SDKs
- Auto-instrumentation and unified libraries
- The OpenTelemetry Collector
- Support for traces, metrics, and logs
- A universal protocol (OTLP)
- Broad and growing vendor adoption
OpenTracing focused solely on tracing, which limited its long-term viability as organizations expanded their observability needs.
Why organizations should migrate to OpenTelemetry
For organizations investing in their observability, OpenTelemetry is the clear strategic choice. It has rapidly become the industry standard, offering a unified vendor-neutral approach to capturing telemetry data that stakeholders rely on for system reliability and user experience.
With broad adoption across all major cloud and observability providers, OpenTelemetry ensures seamless compatibility and future-proof technology investments. Its fast-growing ecosystem, modern capabilities such as auto-instrumentation and the OpenTelemetry Collector, and strong community governance make it the most scalable, cost-flexible, and sustainable foundation for enterprise-wide observability.
How to migrate from OpenTracing to OpenTelemetry
Here is a step-by-step guide for migrating to OpenTelemetry.
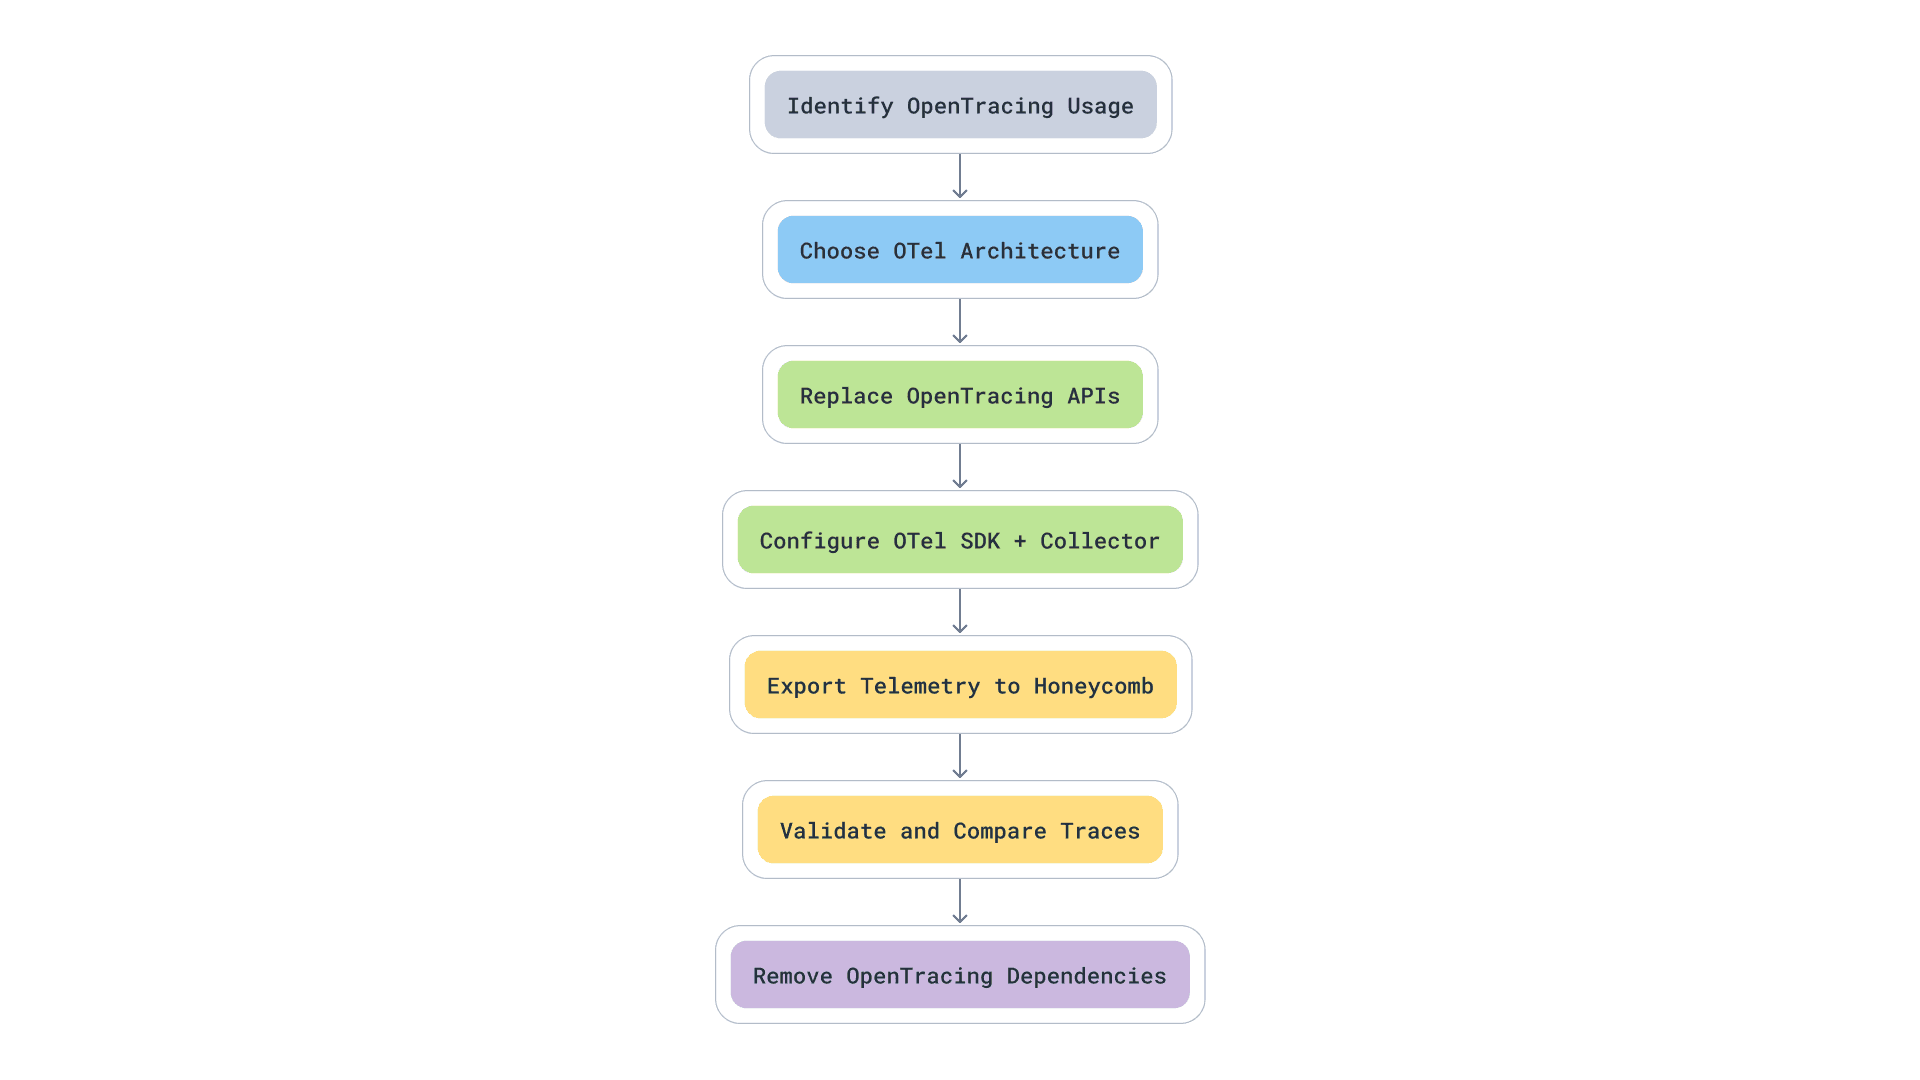
- Step 1: Audit existing instrumentation
Identify all OpenTracing API usage across services and frameworks. - Step 2: Choose your OpenTelemetry architecture
Decide whether to run SDK-only or use the OpenTelemetry Collector. - Step 3: Replace OpenTracing APIs
Use OpenTelemetry equivalents for Span, Tracer, and tags. - Step 4: Configure the OpenTelemetry SDK
Set up trace providers, exporters, and span processors. - Step 5: Deploy the OpenTelemetry Collector
Configure receivers, processors, and exporters. - Step 6: Validate telemetry
Check span structure, field parity, and service map continuity. - Step 1: Audit existing instrumentation
Identify all OpenTracing API usage across services and frameworks. - Step 2: Choose your OpenTelemetry architecture
Decide whether to run SDK-only or use the OpenTelemetry Collector. - Step 3: Replace OpenTracing APIs
Use OpenTelemetry equivalents for Span, Tracer, and tags. - Step 4: Configure the OpenTelemetry SDK
Set up trace providers, exporters, and span processors. - Step 5: Deploy the OpenTelemetry Collector
Configure receivers, processors, and exporters. - Step 6: Validate telemetry
Check span structure, field parity, and service map continuity. - Step 7: Decommission OpenTracing
Remove legacy libraries and update documentation.
OpenTracing and OpenTelemetry with Honeycomb
This blog post discussed OpenTelemetry benefits, OpenTracing implementations, and how to best plan your migration to futureproof your observability. Honeycomb fully supports OpenTelemetry as the standard for observability.
Honeycomb also offers:
- Migration guides
- Step-by-step adoption playbooks
- Advanced visualization and debugging tools
- BubbleUp for rapid outlier detection
- Powerful query-driven analysis for microservices environments
- AI-powered features to query in natural language
Explore Honeycomb’s OpenTelemetry quickstart to begin your migration today.
OpenTracing and OpenTelemetry FAQs
Can I use OpenTracing and OpenTelemetry together?
Yes. You can run both OpenTracing and OpenTelemetry together. OpenTracing instrumentation can be routed through the OpenTelemetry Collector, or you can use language-specific shims that map OpenTracing APIs onto OpenTelemetry under the hood. This allows teams to adopt OpenTelemetry incrementally without breaking existing distributed tracing pipelines.
Is OpenTracing still supported?
The OpenTracing project is officially in maintenance mode, meaning it receives security and critical bug fixes at this time, but no new features. While it remains functional, the recommendation is to migrate to OpenTelemetry for long-term support and access to more observability capabilities.
Is OpenTracing supported on Honeycomb?
Yes. Honeycomb provides OpenTracing legacy support through Honeycomb Beelines and compatibility paths in the OpenTelemetry Collector. This ensures that teams with existing OpenTracing instrumentation—across languages like Java, Go, Python, and JavaScript—can continue sending traces to Honeycomb while planning or executing a migration to OpenTelemetry.
Does OpenTelemetry support all the languages that OpenTracing does?
Yes. OpenTelemetry not only supports all major languages covered by OpenTracing, but in most cases offers broader ecosystem coverage (including more auto-instrumentation, semantic conventions, exporters, and richer community support). OpenTelemetry is now the actively developed standard for vendor-neutral observability.
Want to know more?
Talk to our team to arrange a custom demo or for help finding the right plan.