The Price is Right
Here at the hive, we’re working on something that isn’t code or new features(!), but is a big part of our business notwithstanding: figuring out the best way to help people understand how we…

By: Charity Majors

Here at the hive, we’re working on something that isn’t code or new features(!), but is a big part of our business notwithstanding: figuring out the best way to help people understand how we price Honeycomb and the built-in assumptions we make about how they use Honeycomb. There are some issues (pricing is hard, film at 11!), but we’ve found the challenges to be more about words than about technology or sales process. Let me explain.
We’ve heard from people who’ve been confused by the way we price and bounced without even trying Honeycomb because they think we are either too expensive or not scalable. What’s saddest about it is that both those things are false.
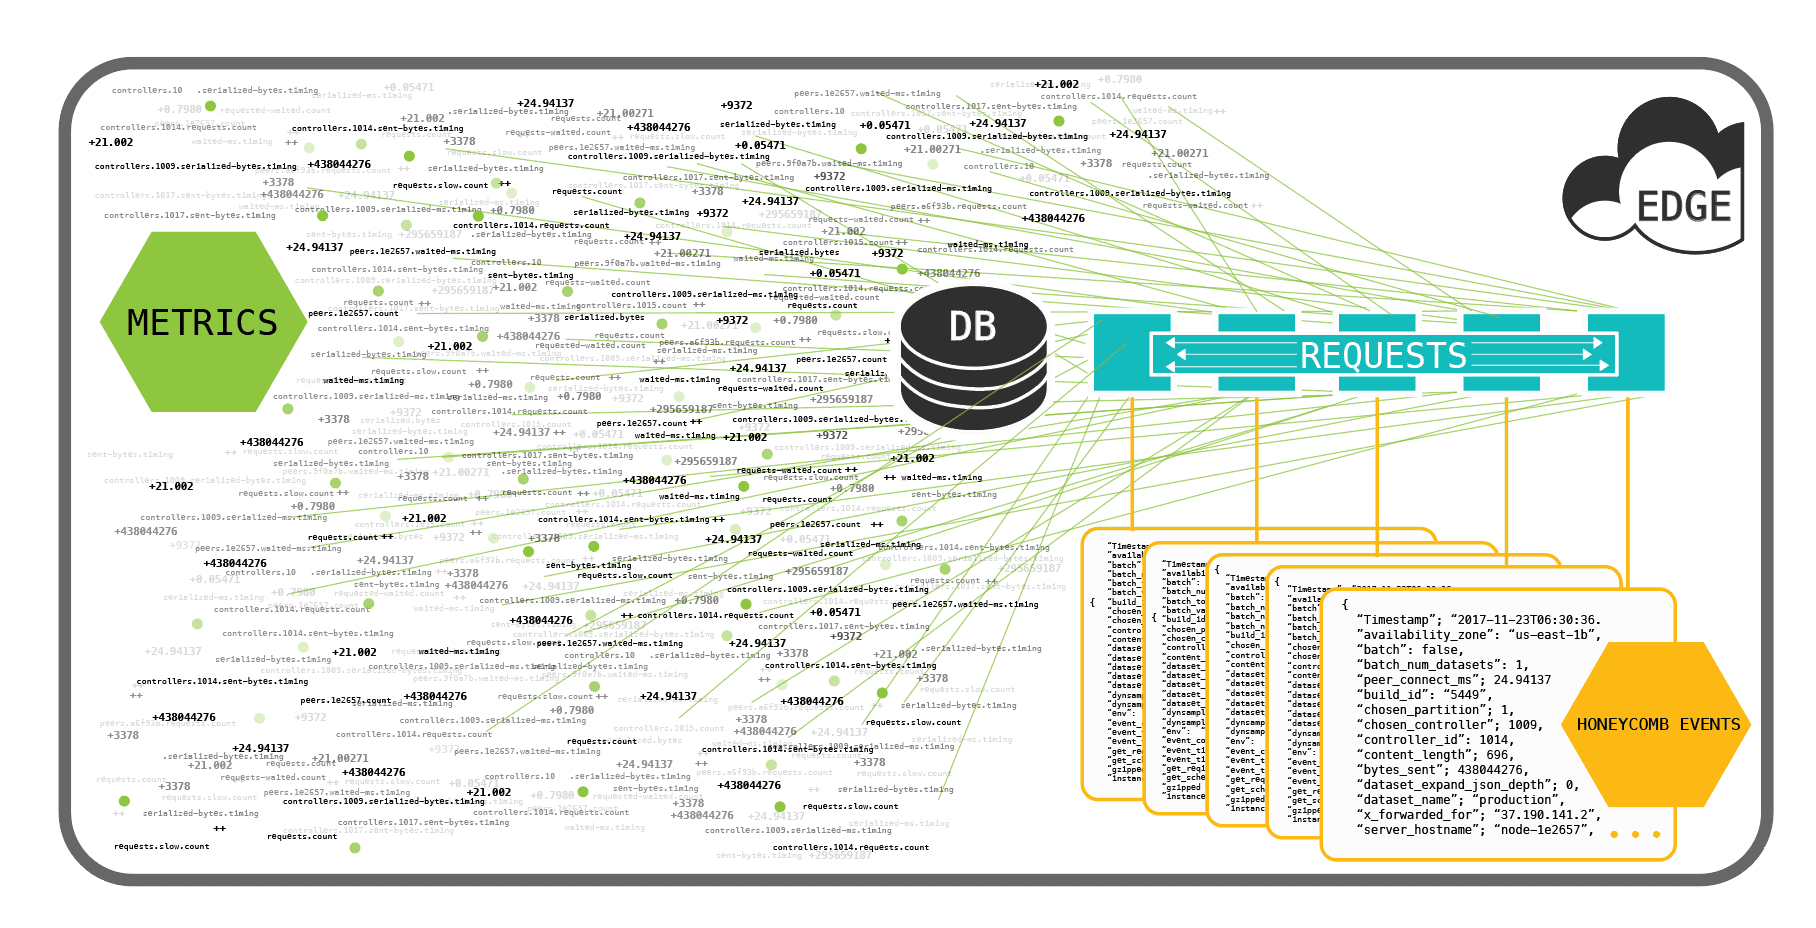
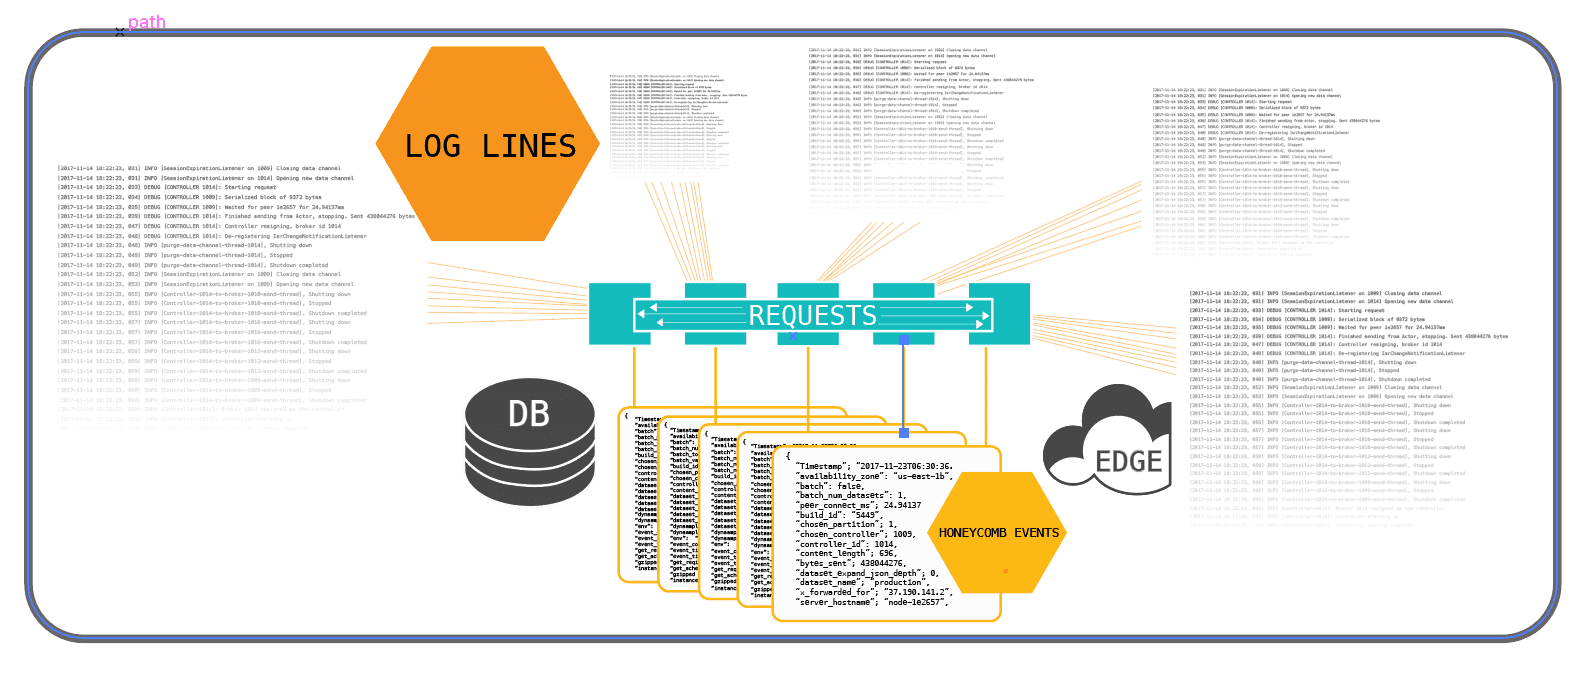
I think the source of the confusion is comparing how we’re trying to do things to two models that everyone knows well, metrics and log lines. But Honeycomb events are shaped and collected very differently than the logs and metrics you might be used to. (That’s why we call them “events”, not “logs” or “metrics”. They’re different.)
Why “events” are different
Honeycomb events are very wide. Typically, one event is submitted to Honeycomb for every time a request hits a microservice or database. When the service receives the request, an empty event is initialized. The service then passes the event along through the handling of the request (accumulating more and more rich detail as it goes — just toss another dimension on the pile whenever you feel like it along the way! — and submits the event to Honeycomb at the end, right before you exit the service. If the function exits prematurely, the event is submitted as part of the cleanup process.
Examples of useful dimensions/values you should stash in your events include: timings for any calls out to other services, fetches or puts or queries to data stores, any add/modify/delete from http headers, raw queries, unique request ids, user ids, host ip:port pairs, etc, etc. If in doubt, drop it on!
So, any single event usually has dozens or maybe hundreds of k/v pairs. Observationally, well-instrumented Honeycomb services tend to run in the low hundreds of dimensions per dataset. Honeycomb internal services have from ~50-300 dimensions per dataset. The technical upper bound to the number of dimensions is much higher than the tractable limit for humans, which seems to be less than 500.
It comes down to the write volume
When you’re dealing with metrics, those metrics must be numeric, and any other type of data must be stored as metadata either attached to the datapoints themselves or out-of-band in some way (“tags”, “dimensions”, etc). This is not the case with Honeycomb. Every value can be any data type, whether high- or low-cardinality (including nested JSON), and they can all be aggregated, broken down by, or computed at read time.
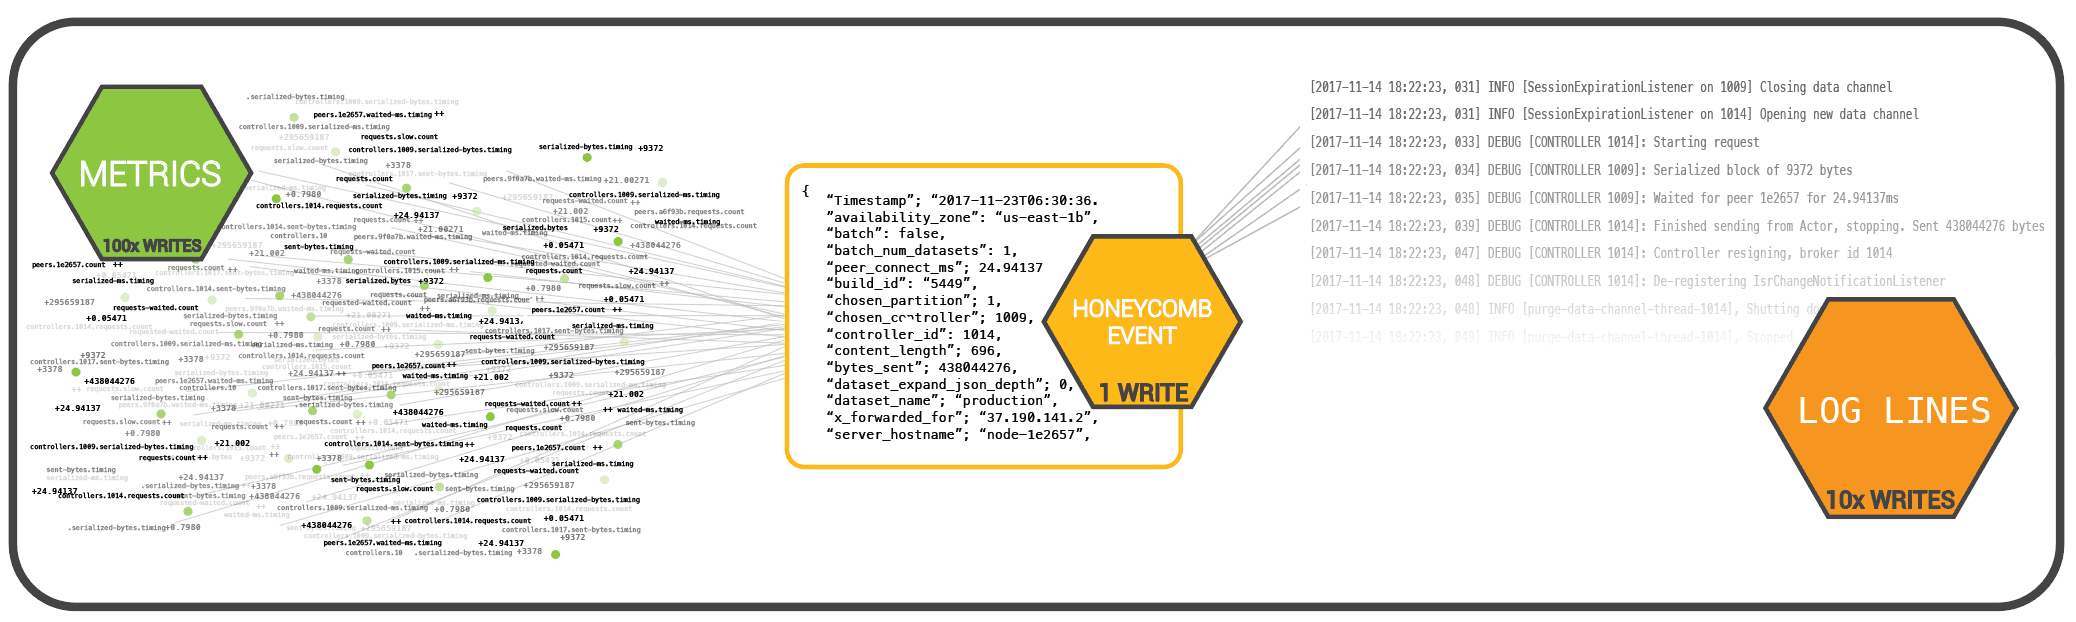
So let’s say you gather approximately 200 units of data (key/value pairs of strings, ints, nested data structures, etc) in this service. Your Honeycomb write volume is 1 write per service that the request hits along its path.
Contrast this to the write volume of metrics, where you (assuming that you could store all of these data types as metrics) will have a write volume of 200 writes per service, per request.
And for those of you who care about what actually happens on disk, the fan out of unique time series generated per combination of dimensions and datapoints could easily make that 1000+ writes per service, per request.
What about logs?
Or compare to logs, where you can capture complex data structures. But instead of compiling one large event, the convention there is to write a log line containing 1..n units of data out every time you want to print a value. You probably won’t emit 200 log lines to store 200 units of data. Instead, you’ll likely have combined and converged your code so you only emit one line with multiple values per function, which is a better practice. Still, you probably emitted about 50-100 lines with anywhere from 1-10 units of data per log line.
Let’s compare
If your average request hits 5 microservices along its path:
- Honeycomb will emit 5 writes, plus perhaps one write at your edge and another few for DB queries…let’s say one query per service: 11 writes to store approximately 1000 units of data.
- The metrics write volume would be 10,000 writes (5 * 200), one per unit (although remember, metrics aren’t even able to capture most of these data types), and
- Logs would write out 150-500 log lines (5 * 50-100) per request (although in reality, few systems can handle this volume of log lines, so it’s necessary to exert downward pressure to write out much less log volume).
Honeycomb’s efficiency with writes is why we price the way we do.
We don’t do 7000 writes/sec and store 7 terabytes/month. Instead, we store the same amount of information in just 25-50 writes/sec and a few gigs. We’re trying to make it exponentially more usable and valuable by enabling capture of all the context at once for a potentially much larger base of services and letting you perform read-time aggregations and calculations in any arbitrary combinations of dimensions.
Choose your knobs
If all that mattered was cheap storage, you could buy a handful of thumb drives and be done with it. But the value of your data is tied to the business value you can extract from it, and Honeycomb exposes more value than logs or metrics combined. And much of that value comes from the compactness and dedication to structured data from the very start.
Every way of storing bits on disk comes with its own tradeoffs, and a preferred knob for adjusting costs:
- Metrics have chosen to sacrifice rich context in exchange for raw performance, and the knob for them is pre-aggregation. You can never again get back to the raw event source of truth, which makes this a poor fit when you care about the health of the event above all else.
- Unstructured logs have chosen to sacrifice a bit of discipline up front for ease of development, and their knob is log levels or simply writing out less logs.
- We have chosen to put the event, in all its useful context and glory, first and foremost, and our knob is sampling.
Choose the tradeoff and knob that best fits your use case. We at Honeycomb believe that our approach is best for platforms, distributed systems, and frankly–most people ;)). Which is why you won’t see us gating basic features like the number of users, or the number of “sources”, or number of datsets, or number of indexes (no such thing in Honeycomb!), or triggers and notifications, or integrations, or parsers, or derived fields, etc.
We understand that apples to apples comparisons are hard to do. But we’re here to help! Bring us your questions.
Want to know more?
Talk to our team to arrange a custom demo or for help finding the right plan.