Understand Your AWS Cost & Usage with Honeycomb
First published in August 2019. AWS bills are notoriously complicated, and the Amazon Cost Explorer doesn’t always make it easy to understand exactly where your money is going. When we embarked on our journey…

By: Emily Nakashima

First published in August 2019.
AWS bills are notoriously complicated, and the Amazon Cost Explorer doesn’t always make it easy to understand exactly where your money is going. When we embarked on our journey to reduce our AWS bill, we wanted more than just the Cost Explorer to help us figure out where to optimize — and when all you have is a hammer, every problem sure looks like it can be solved with Honeycomb! We don’t claim it’s the perfect tool for the job, but using Honeycomb has some advantages for us:
- Engineers are in Honeycomb already, so they don’t need to figure out how to request access to data or a new tool — they already have everything they need to be able to correlate the impact of their infrastructure and engineering changes to our spend.
- We can set up Suggested Queries to help new engineers figure out how to start exploring.
- We can use Triggers to set up automated alerts on unexpected cost changes, and send those to places we already look at (like our infra slack channel).
Best of all, we can use the same iterative question → answer → question loop we’re use to for debugging our production systems. Here’s how to do it yourself.
Caution: We wrote this post when we were a smaller startup with less traffic. If you spend over $100,000 per month or $1M per year on AWS, we recommend using other techniques to understand your bill. Note that generating and interacting with Cost & Usage Reports via the AWS API also has associated costs!
1. Configure your AWS account to generate Cost & Usage Reports
With a few configuration steps, Amazon will generate a detailed CSV called a Cost and Usage Report that contains a row for each unique charge to your account. To set this up, you’ll first need to pick an S3 bucket where Amazon will deposit the reports. Then, turn on report generation. Wait a day or two to for your reports to generate, and then…
2. Download the reports
The reports are just files sitting on S3, so you can use your preferred tool for interacting with s3 to grab them. I’ve installed the AWS cli, so I use the sync command:
# Grab files from amazon (just do the last month)
aws s3 sync "s3://{your s3 billing report bucket path}" . --exclude "*" —include "*201907*"
The report files are bucketed by month, and then each individual report is in a directory with a unique name. CSVs generated later in the month also contain all the line items from earlier in the month, so you’ll need to find the last CSV file generated to send to Honeycomb. To do this, look for the manifest json file at the top level of each month directory.
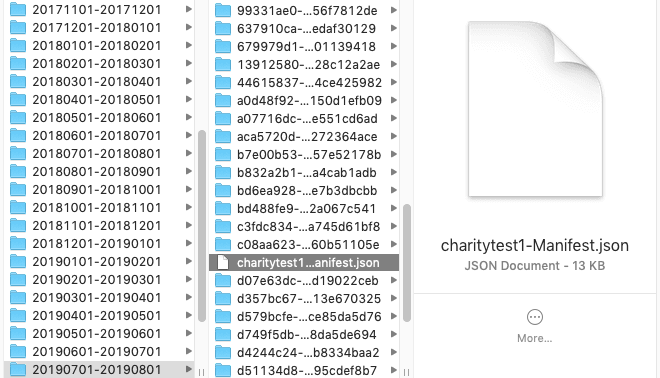
The manifest describes the schema used in the reports and gives you the s3 file path of the latest report file. Look for the reportKeys key:

Long reports can be paginated, so if you see multiple files there, grab them all. You might need to unzip the files:
# unzip latest report file
gunzip "20190701-20190801/f6661d55-c3c3-b1b1-a2a2-00bc8997c39b/myreport1-1.csv.gz"
Tada, now you’ve got a fresh report CSV waiting to send to Honeycomb. You can try to look through it, but the reports tend to be very long files with lots of fields.
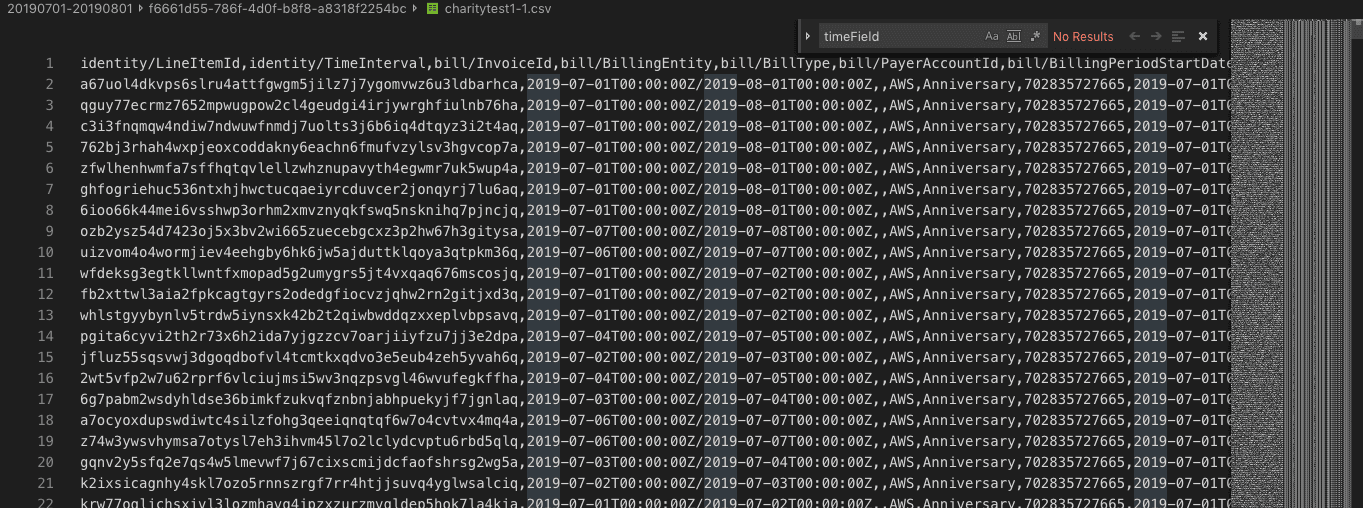
Better to send it to Honeycomb instead!
3. Send the reports to a Honeycomb dataset
One important thing to know: line items in Cost & Usage Reports are mutable! Line items cover varying time spans, and AWS will show an estimated cost for each line item that hasn’t finished yet, updating the amount later based on your actual usage. (The identity/LineItemId field and the identity/TimeInterval field together act as the primary key for each row.) If you want to do very accurate analysis, you may only want to look at reports from prior months to make sure all the line items reflect their final value.
The slightly tricky part is figuring out how to translate each line of that CSV into a Honeycomb event. For golang fans, here’s a gist of a go script you can adapt to use to send your report to Honeycomb. Run it like so:
go run main.go -k "{YOUR_HONEYCOMB_API_KEY}" -d "AWS Cost and Usage" -f "{report file path}" -V
The script will handle converting number fields into integers and floats, and has a command line option to ignore line items older than a particular time.
If you are not familiar with go or don’t want to install it, you can also install and use honeytail, our log tailer, although you’ll need to do a bit of work to remove the CSV header row first:
# Save first line of CSV as fieldnames, then remove this line from the CSV
# (honeytail doesn't want a header row)
fieldnames="fieldnames.tmp"
current="{report file path}"
head -n 1 $file > $fieldnames
echo -e "$(sed '1d' $file)\n" > $current
# Now send the CSV to Honeycombhoneytail --backfill -p "csv" -f "{report file path}" -d "AWS Cost and Usage" -k "{YOUR_HONEYCOMB_API_KEY}" --csv.fields="$(cat $fieldnames)" --status_interval=2 --csv.timefield="lineItem/UsageStartDate"
4. Add a derived column and start querying
If, like us, you use Reserved Instances to help reduce the price of your predictable infrastructure costs, you can set up a derived column to more closely approximate your amortized cost of reserved instances. Our column is called amortizedCost and we use a formula that looks something like this:
IF(EQUALS($pricing/term, "Reserved"), MUL(0.5, $pricing/publicOnDemandCost), $lineItem/UnblendedCost)
Replace the “0.5” with 1 – your average RI discount. For example, if you have reserved instances at a 40% discount, you would use 0.6.
Now you can start running some queries! To get a broad sense of what categories your spend falls into, Visualize SUM(lineItem/UnblendedCost) or SUM(amortizedCost) and Group By product/productFamily:
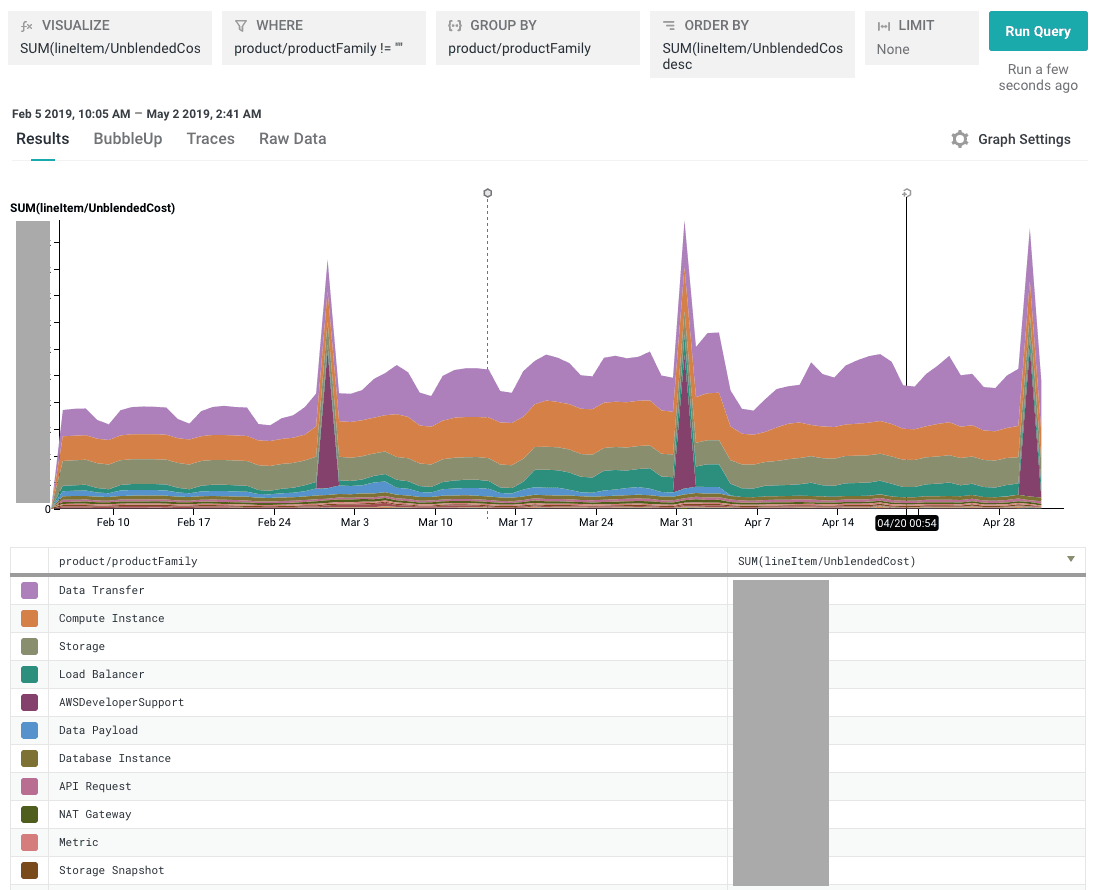
Tip: Because the billing period for many AWS charges starts at the beginning of a particular month, day, or hour, your data may appear very spiky at high granularities. We’ve found that it’s easiest to see trends in cost queries by setting the query granularity to “1 day” (look for this option in the time selection dropdown) and using the “Display Stacked Graphs” mode in the “Graph Settings” dropdown.
To see only your big expenses (did we forget to cancel our support package again??), you can Visualize SUM(lineItem/UnblendedCost) or SUM(amortizedCost) and Group By lineItem/LineItemDescription and product/productFamily.
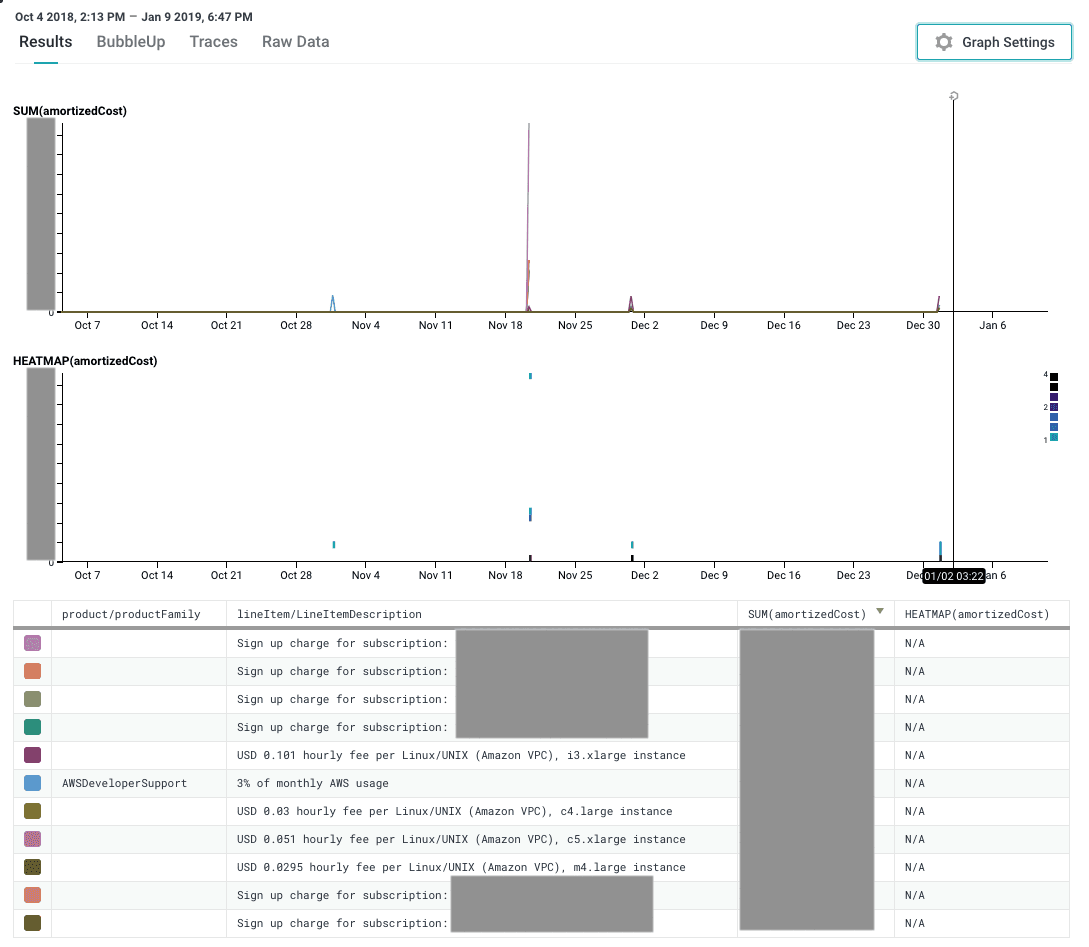
Yep, there’s that Developer Support package, still there. Sigh.
5. Extra credit: Boards and Suggested Queries
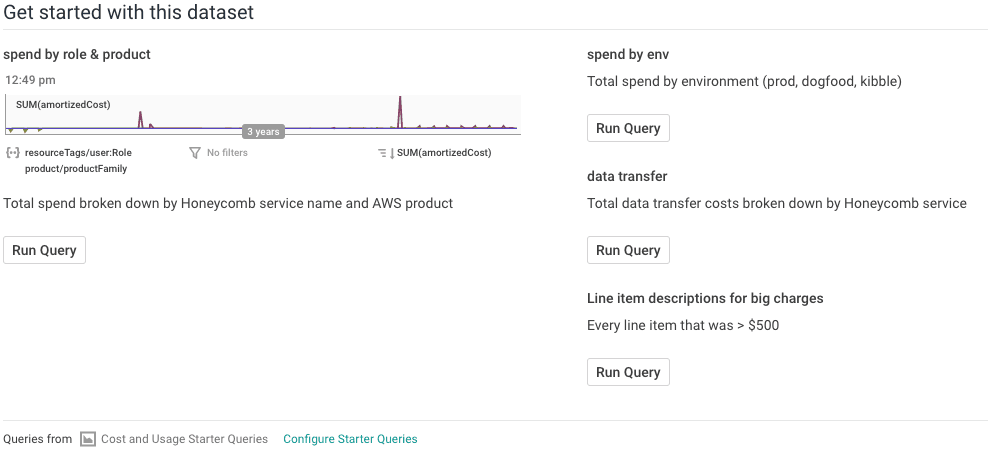
In a lot of organizations, only a small number of engineers and managers (maybe just one or two) look at the AWS bills often, but we want the whole team to be able to ask questions about cost and usage. We can make this a lot easier by saving useful queries to a Board and adding Suggested Queries to our dataset.
From the “Boards” item in the left sidebar, open the Boards page, then click “New Board.” We called our board “Cost and Usage Starter Queries” to keep it obvious.
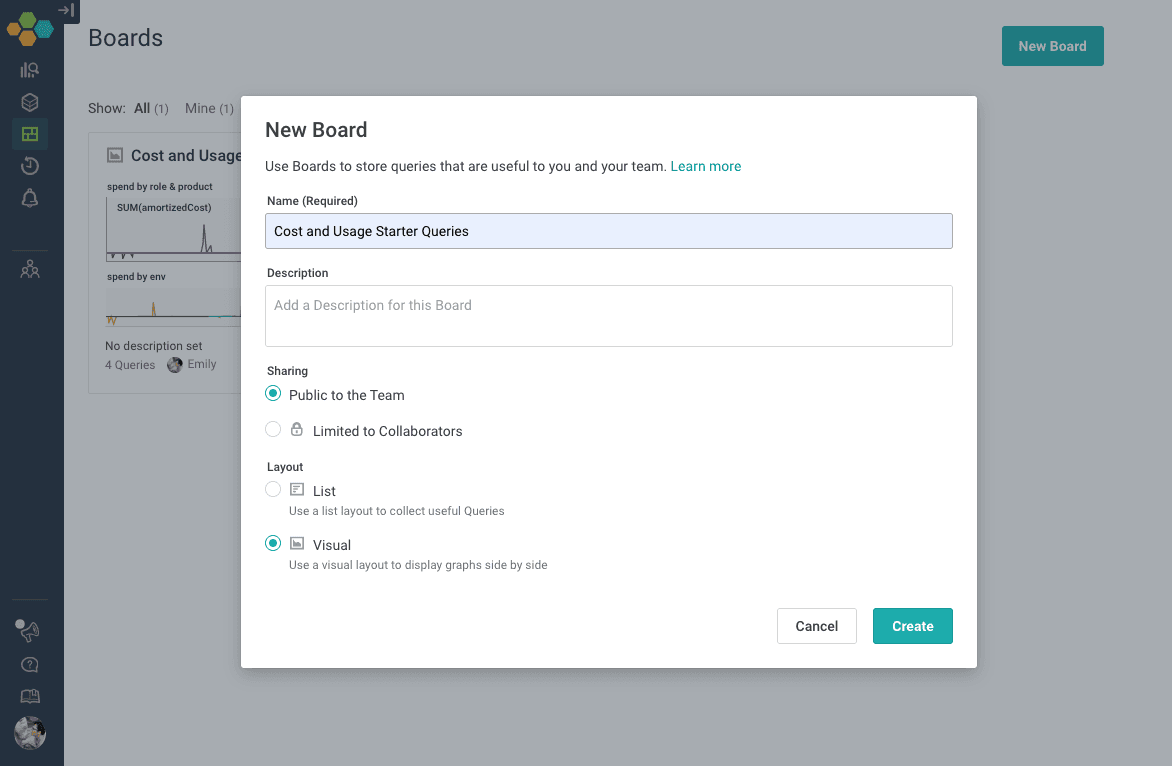
Add your favorite queries from this dataset to the Board you just created. Then, in your dataset’s settings section, choose this Board in the Suggested Queries dropdown:
6. Extra credit: Triggers
If you decide to use cron or another automated process to send these reports to Honeycomb regularly, you might want to do one more handy thing: set up Triggers to alert you to unexpected cost changes. Here’s an example of a trigger that runs once a day and alerts us if a particular type of cost (Compute) exceeds a particular dollar value ($1000 per day).
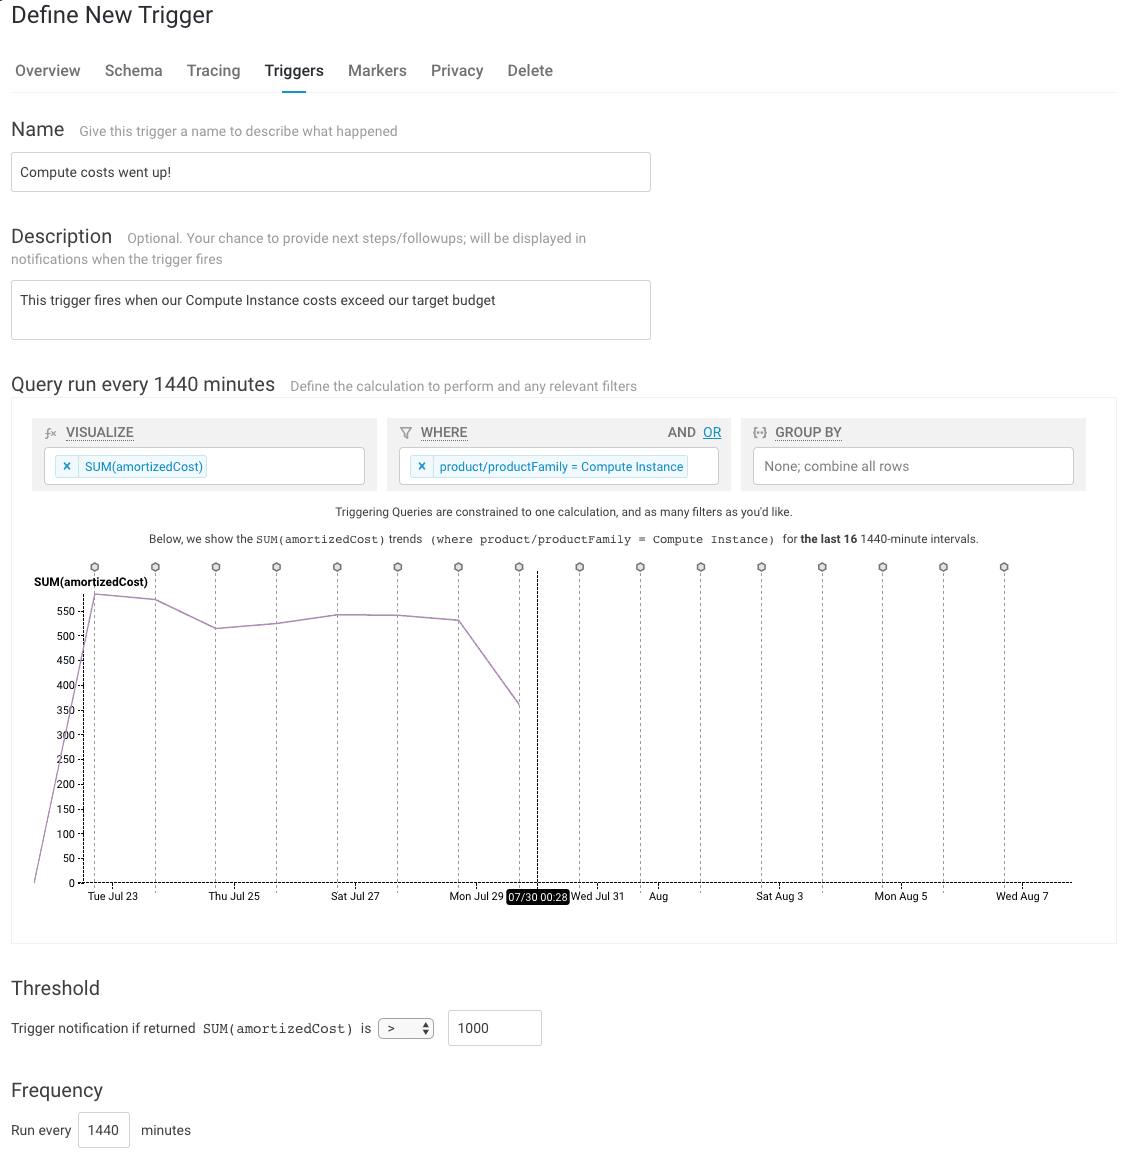
We’re currently doing a round of AWS cost optimization where we look at this dataset regularly, but when we get back to our regular roadmap projects and stop thinking as much about cost, it will be nice to know we’ll be notified if our bill does something unexpected.
Caution: Remember, line items in Cost & Usage Reports are mutable, and CSVs generated later in the month also include line items that appeared in earlier reports. If you use an automated process todownload your reports and send them to Honeycomb, you will want to set up your script to make sure you
- don’t re-send duplicate line items, and
- don’t send mutable line items before Amazon has finalized the line item amount.
At Honeycomb, our current approach is to use two different datasets: one dataset with longer retention that only receives the finalized report after the end of each month, and a second dataset with shorter retention that we send fresher (but potentially not finalized) data to. The Go script linked above supports passing in a starting timestamp to prevent re-sending old events, so for the second dataset, we automate sending new data every day but use the starting timestamp argument to only send the prior 24 hours worth of data. This approach lets us use the first dataset for more accurate historical analysis and the second for reacting quickly to large estimated cost and usage changes.
7. Extra credit: add more tags to your infrastructure
We use AWS tags to help us keep track of our resources, and these tags can also appear as fields in our Cost and Usage reports. As you query your dataset, you may find new types of tags you want to add to your infrastructure just to be able to break down your usage in different ways.
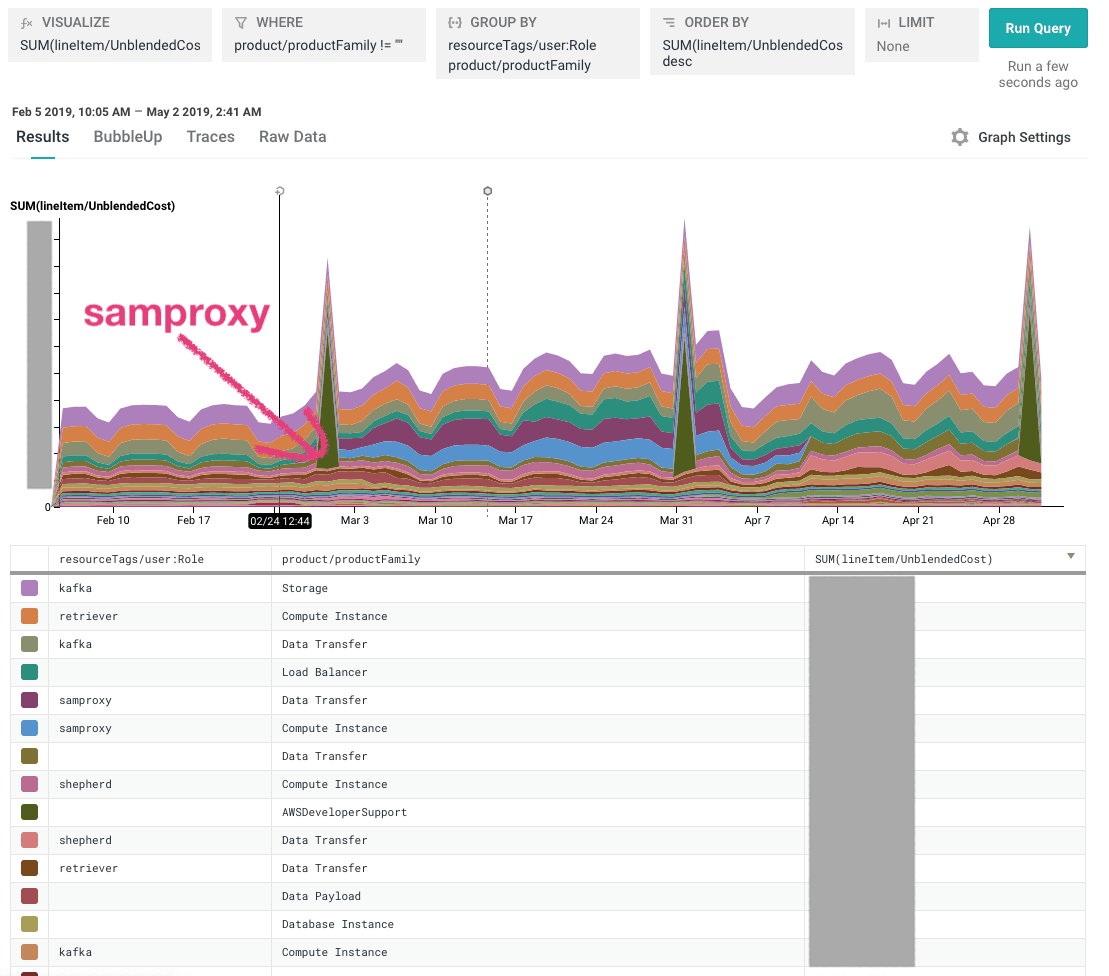
Our most useful tags are usually the role tag (which Honeycomb service) and the environment (prod, dogfood, etc.). For example, remember that graph I was looking at in step 4? It looks like our overall spend increased quite a bit for the month of March. When I just look by product family, I can see that our costs went up, but I can’t tell how much of that was increased customer traffic vs. a new service (samproxy) that we were testing out.
If I break down by role (service name), suddenly it’s very clear:
Success! Now you (hopefully) have everything you need to go find some unexpected expenses, like *cough* a staging cluster you never used but also never took down, or a Kafka broker instance that somebody meant to manually delete and forgot about, not that we did any of those things at Honeycomb. To hear more practical examples of how we actually use this data to optimize Honeycomb, take a look at Liz Fong-Jones’ excellent post, Treading in Haunted Graveyards.
Thanks to Charity Majors, who configured report generation for us back in 2016 and lovingly named our reports s3 bucket, “honeycomb-test-fuck-everything-motherfuckers”, to Eben Freeman, who set up the original Honeycomb AWS cost & usage dataset and taught me most of the tricks in this post, and to Ben Hartshorne, who wrote the CSV import script I cribbed from and helped dig me out of a few CSV-shaped holes along the way to this blog post.
Want to have this level of observability into your AWS spend? Try Honeycomb for free!
Want to know more?
Talk to our team to arrange a custom demo or for help finding the right plan.