Surface and Confirm Buggy Patterns in Your Logs Without Slow Search
Incidents happen. What matters is how they’re handled. Most organizations have a strategy in place that starts with log searches—and logs/log searching are great, but log searching is also incredibly time consuming. Today, the goal is to get safer software out the door faster, and that means issues need to be discovered and resolved in the most efficient way possible.

By: Michael Wilde

Incidents happen. What matters is how they’re handled. Most organizations have a strategy in place that starts with log searches—and logs/log searching are great, but log searching is also incredibly time consuming. Today, the goal is to get safer software out the door faster, and that means issues need to be discovered and resolved in the most efficient way possible.
We’re here to make the case that it’s time to rethink log search as the default problem-solving solution and instead start with log analytics. In comparison, the analytics-first problem-solving approach offered by Honeycomb helps you observe and gain a better understanding of production systems behavior. This approach allows you to get to the goal of your investigation in a faster, more flexible way. If “time is money,” it is very easy to spend way too much of your money on the time it takes to find problems in your production systems.
Where the heck do I start?
We’ve all been there: a problem crops up and we’re left wondering where to even begin to find answers. If we’re lucky, the incident we’re seeing is like one we’ve seen before, so we have a better idea of where to look. But what happens when we’re not lucky?
Based on our experience, it goes something like this: teams turn to an existing methodology, perhaps Brendan Gregg’s USE-based troubleshooting process (which is a popular and well-respected choice). Then, it’s time to check utilization saturation errors, create a checklist, and start asking questions… In fact, lots of time is spent crafting the perfect query so Google can help us know where to look.
But it doesn’t have to be that way. It’s possible to find out why an endpoint is slow without creating a complex search by using analytics first. Employing a tool that takes a deep dive into logs lets teams zoom in on the data, make comparisons, and cast the net broadly enough that suddenly the analytics are pointing to the right questions to ask.
Don’t believe us? You should, because—shocker—we use logs at Honeycomb, too. Yes, we are known for distributed tracing—but we do have some Amazon ELB logs in play. And we do send those logs into Honeycomb when we need to do some troubleshooting.
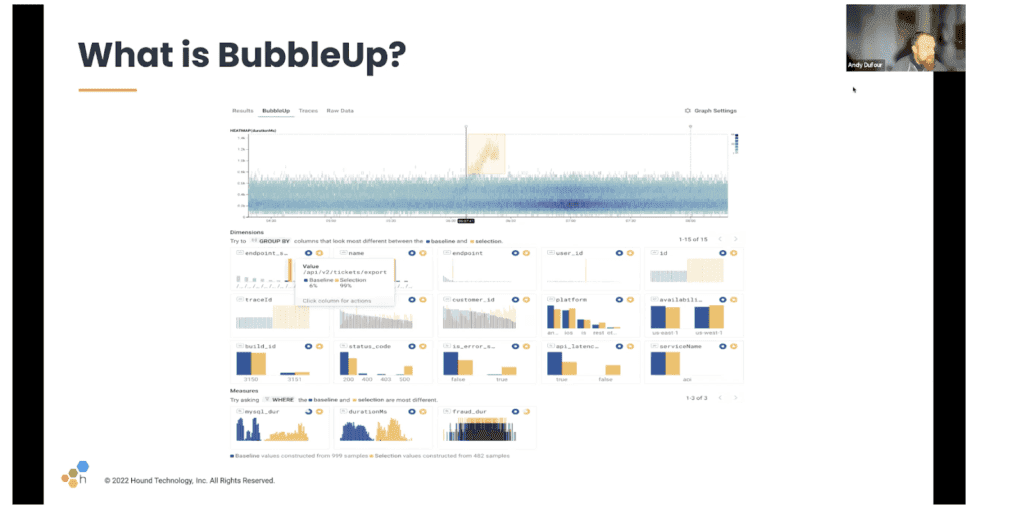
Why (and how) BubbleUp will change your relationship with logs
We know that a lot of people don’t think about using BubbleUp for logs, but we’re just going to put it out there: BubbleUp is as close to magic as most of us will get in real life.
Here’s why: as a human problem solver, you key in on something and start looking for good vs. bad, and you go down that rabbit hole until you have an answer. That might mean many many iterations and many many rabbit holes. BubbleUp lets you skip that because it’s possible to look at all the fields you’re interested in and compare and contrast them in one place. Even more genius is that BubbleUp will actually surface data you don’t know is there, and there’s no need to know or understand the particular schema either.
Continuously improving logs and reliability
While we’re of course bullish about tracing and think that’s the direction the world is headed in, we’re also realistic and know that many companies remain committed to logs and are even on a log journey from unstructured, to more structured, to perhaps eventually traceable. But in the meantime, we can help you make the most of the logs you have without forcing you to commit to tracing (yet, anyway). Bonus pro tip: if your organization is thinking of leveraging tracing eventually, an easy interim step is to attach the fields in an existing log event to trace spans.
While on that logging journey, it’s key to pay attention to some of the most important parts of observability, because of course that’s what all of this is about: how to easily see what’s going wrong so it can be more quickly fixed. One of the pillars of observability is a Service Level Objective (SLO). We know some teams shy away from SLOs because of a belief they might be too complicated or difficult, but we see them as critical for observability because they’re the window into reliability. And it’s also critical to create Service Level Indicators (SLIs) because they are essentially reliability measuring sticks.
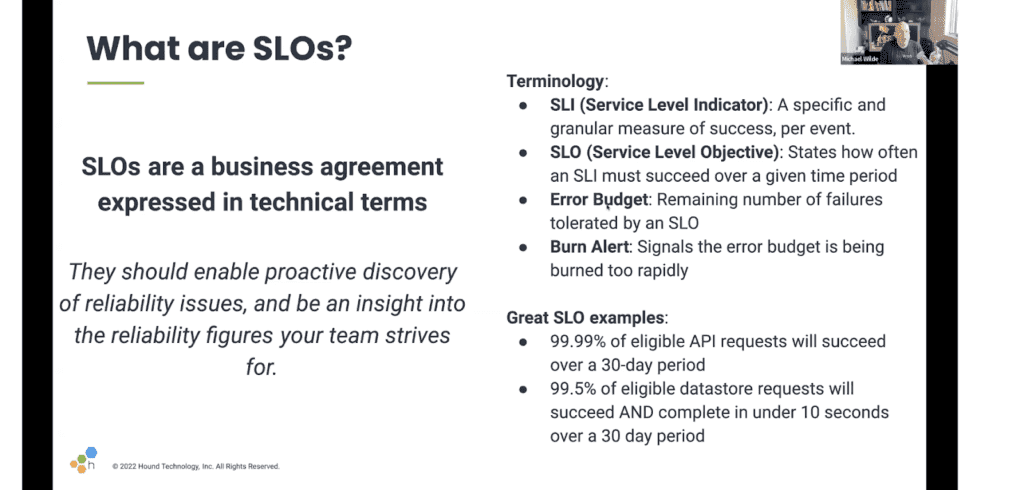
SLOs give teams guidance on reliability but also can highlight when it’s time to work on feature improvement vs. just problem resolution. And, if you’ve brought your logs to Honeycomb and set up SLOs, a BubbleUp will generate automatically. SLOs and SLIs are a really easy way to keep on top of everything going on, and it’s just one screen to check vs. email, messages, pages, or a networking diagram.
How to get logs into Honeycomb
By this point, you’re most assuredly so excited about logs and Honeycomb that you can’t wait to try it all out. But how to best do that?
For those with structured logs, it’s easy to use Logstash Grok or Splunk. Other options include setting up Honeycomb as a destination in Cribl, using our integration with FluentD, or setting up AWS CloudWatch.
But maybe, just maybe, all this talk about analytics makes distributed tracing even more tempting… If that’s the case, here are three ways to easily get started with distributed tracing.
And finally, because we’re fun on camera, watch our webinar on this topic.
Want to know more?
Talk to our team to arrange a custom demo or for help finding the right plan.