Getting Started With Distributed Tracing

By: Rox Williams
Teams working in complex and distributed systems need a better way to understand them, and it starts with observability tools that leverage the power of distributed tracing. Done right, distributed tracing provides a speedy diagnostic process that empowers teams to proactively find and fix bugs, even before they impact customers.
What is distributed tracing?
At its core, distributed tracing is a way teams can view exactly what is going on with every application request using a series of IDs/tags and timestamps to visually represent when requests begin and end, and the relationships between them. Because the tracing is “distributed,” it is an ideal observability solution for organizations using microservices, or wherever an application is broken into independent components and widely dispersed. However, even traditional legacy applications can benefit from distributed tracing. In fact, distributed tracing is a modern observability solution for anywhere developers and operations need a clear view of how code is performing—with an eye to fixing problems quickly.
How distributed tracing can help your team
The benefits of distributed tracing are many. With distributed tracing, teams can jumpstart instrumentation, lessen dependence on logs (and the time spent poring through them), and slash time spent debugging. Reducing MTTR is an enormous benefit, of course, but there are many others—including faster release times, happier developers, and improved customer satisfaction.
- Faster debugging because you can see what is actually happening as requests traverse application components.
- Better development of new code because teams can see how the systems connect and where the dependencies and vulnerabilities are.
- Democratizing system knowledge as without distributed tracing, teams rely on the most seasoned engineers for knowledge of how components fit together.
Distributed tracing components
In 2010, Google told the world about its experiment with distributed tracing in what is now known as the Dapper paper. Since that time, a number of other open source efforts around distributed tracing have launched, including OpenZipkin and Jaeger. Distributed tracing has grown dramatically in popularity since then, and today’s modern solutions are far more efficient, with standards like OpenTelemetry and tools like Honeycomb ingesting your trace data and giving you the tools to find the right trace for any given issue.
In general, distributed tracing systems require the following components to be added so the code is traceable:
- A trace ID: a name that is tied to an application request.
- A span ID: a “span” is work that happens during a trace, and each span needs a unique name.
- Parent or child IDs: these make the nested relationships between spans in the trace clear, as in a child span would nest under a parent span, etc.
- Timestamps/duration: each span needs a timestamp and a way to track how long the event took place.
How does distributed tracing work?
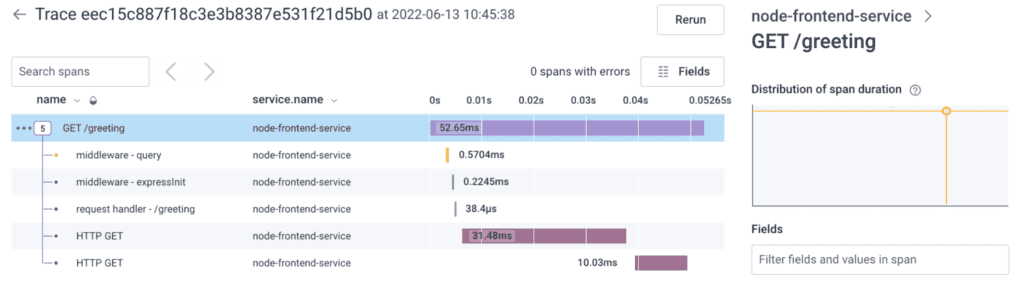
Distributed tracing helps track how requests move through different parts of an application, which is crucial for understanding performance and finding problems. When a request starts, a unique trace ID is assigned. As the request passes through different services and components, each service logs information about its part of the process, attaching it to the same trace ID. This creates a detailed map of how the request traveled through the system, allowing you to see how long each step took and where things might have gone wrong.
With distributed tracing, you can pinpoint performance bottlenecks and errors by visualizing the entire path of a request. This is especially useful in complex systems where requests touch multiple services. For example, if a user is experiencing slow load times, distributed tracing can help you identify which specific service or component is causing the delay by showing where the most time is spent.
Tools like Honeycomb take distributed tracing to the next level by offering a powerful interface to explore and analyze trace data. Honeycomb collects all the tracing information and presents it in an interactive, user-friendly way.
How does distributed tracing compare to metrics and logs?
To understand the value of distributed tracing, it’s helpful to look at how issues have been identified and diagnosed in the past, and where existing approaches haven’t worked as well. Traditionally, metrics were used to benchmark performance trends and formed the basis of early monitoring solutions. Logs, conversely, have been a valuable resource for granular diagnosis of bugs and uncovered problems.
When do logs and metrics fall short?
The problem with logs and metrics in modern, massively distributed applications is that they represent two extremes, each with unique challenges at scale. Metrics are at best indirect and aggregated data points which provide information that is either too generalized to isolate the source of a problem, or too late to address customer issues. While logs can make up for this with detailed, tunable diagnostic data, even finding the right log to look at can be a difficult task in modern applications. It can be expensive to scale due to logging’s hefty storage requirements.
- System metrics are indirect, trailing indicators of health: When monolithic applications ruled the data center, system metrics were a decent indicator of the health of your application. For example, if your memory usage is spiking, the engineer who owns the service gets a page, they then restart the service, and that service is promptly restored. The thing is, these solutions were often so straightforward that we soon had access to the means to address them programmatically.
- Application metrics are as useful as your problems are predictable: Application metrics evolved to address the indirectness outlined above. While applications are endlessly varied in how they function, the frameworks and languages they’re built upon are much more finite concerns. Thus, framework by framework plugins, modules, and agents were developed to capture some universally useful metrics. How long did a request take to resolve? How many threads is a particular application process using? These became more relevant indicators of health due to their increased specificity to the code being executed.
- Logs are too verbose for humans and too inconsistent for machines: Logs are great for digging into what’s really going on in an app, but as systems get bigger, it becomes harder to sift through because of all the noise. They can also get pretty pricey to store, and trying to cut costs by reducing detail or changing how they’re saved can actually hurt their usefulness. With large distributed apps, logs only show one piece of the puzzle and don’t give a complete view of the user experience. Plus, since logs often come in different formats, it’s difficult to match up data from different sources.
Where does traditional monitoring fall short?
If there’s a problem with an application, DevOps teams need to know what it is, and that’s where application performance monitoring (APM) metrics come in. APM data can clearly show the “what” but can’t go deeper into the application to show the “why,” which is critical for fast and successful debugging. Distributed tracing is the detailed dive into all of an application’s requests, showing the journey and where conflicts arose. There can be 100 reasons—or more—why an application’s latency is too high, but only distributed tracing can help developers quickly see which part of the app is struggling.
To put it another way, traditional monitoring tells you that there is a problem but not where and why that problem is occurring, and without that insight, debugging and problem resolution is too time consuming for the DevOps team and the end user.
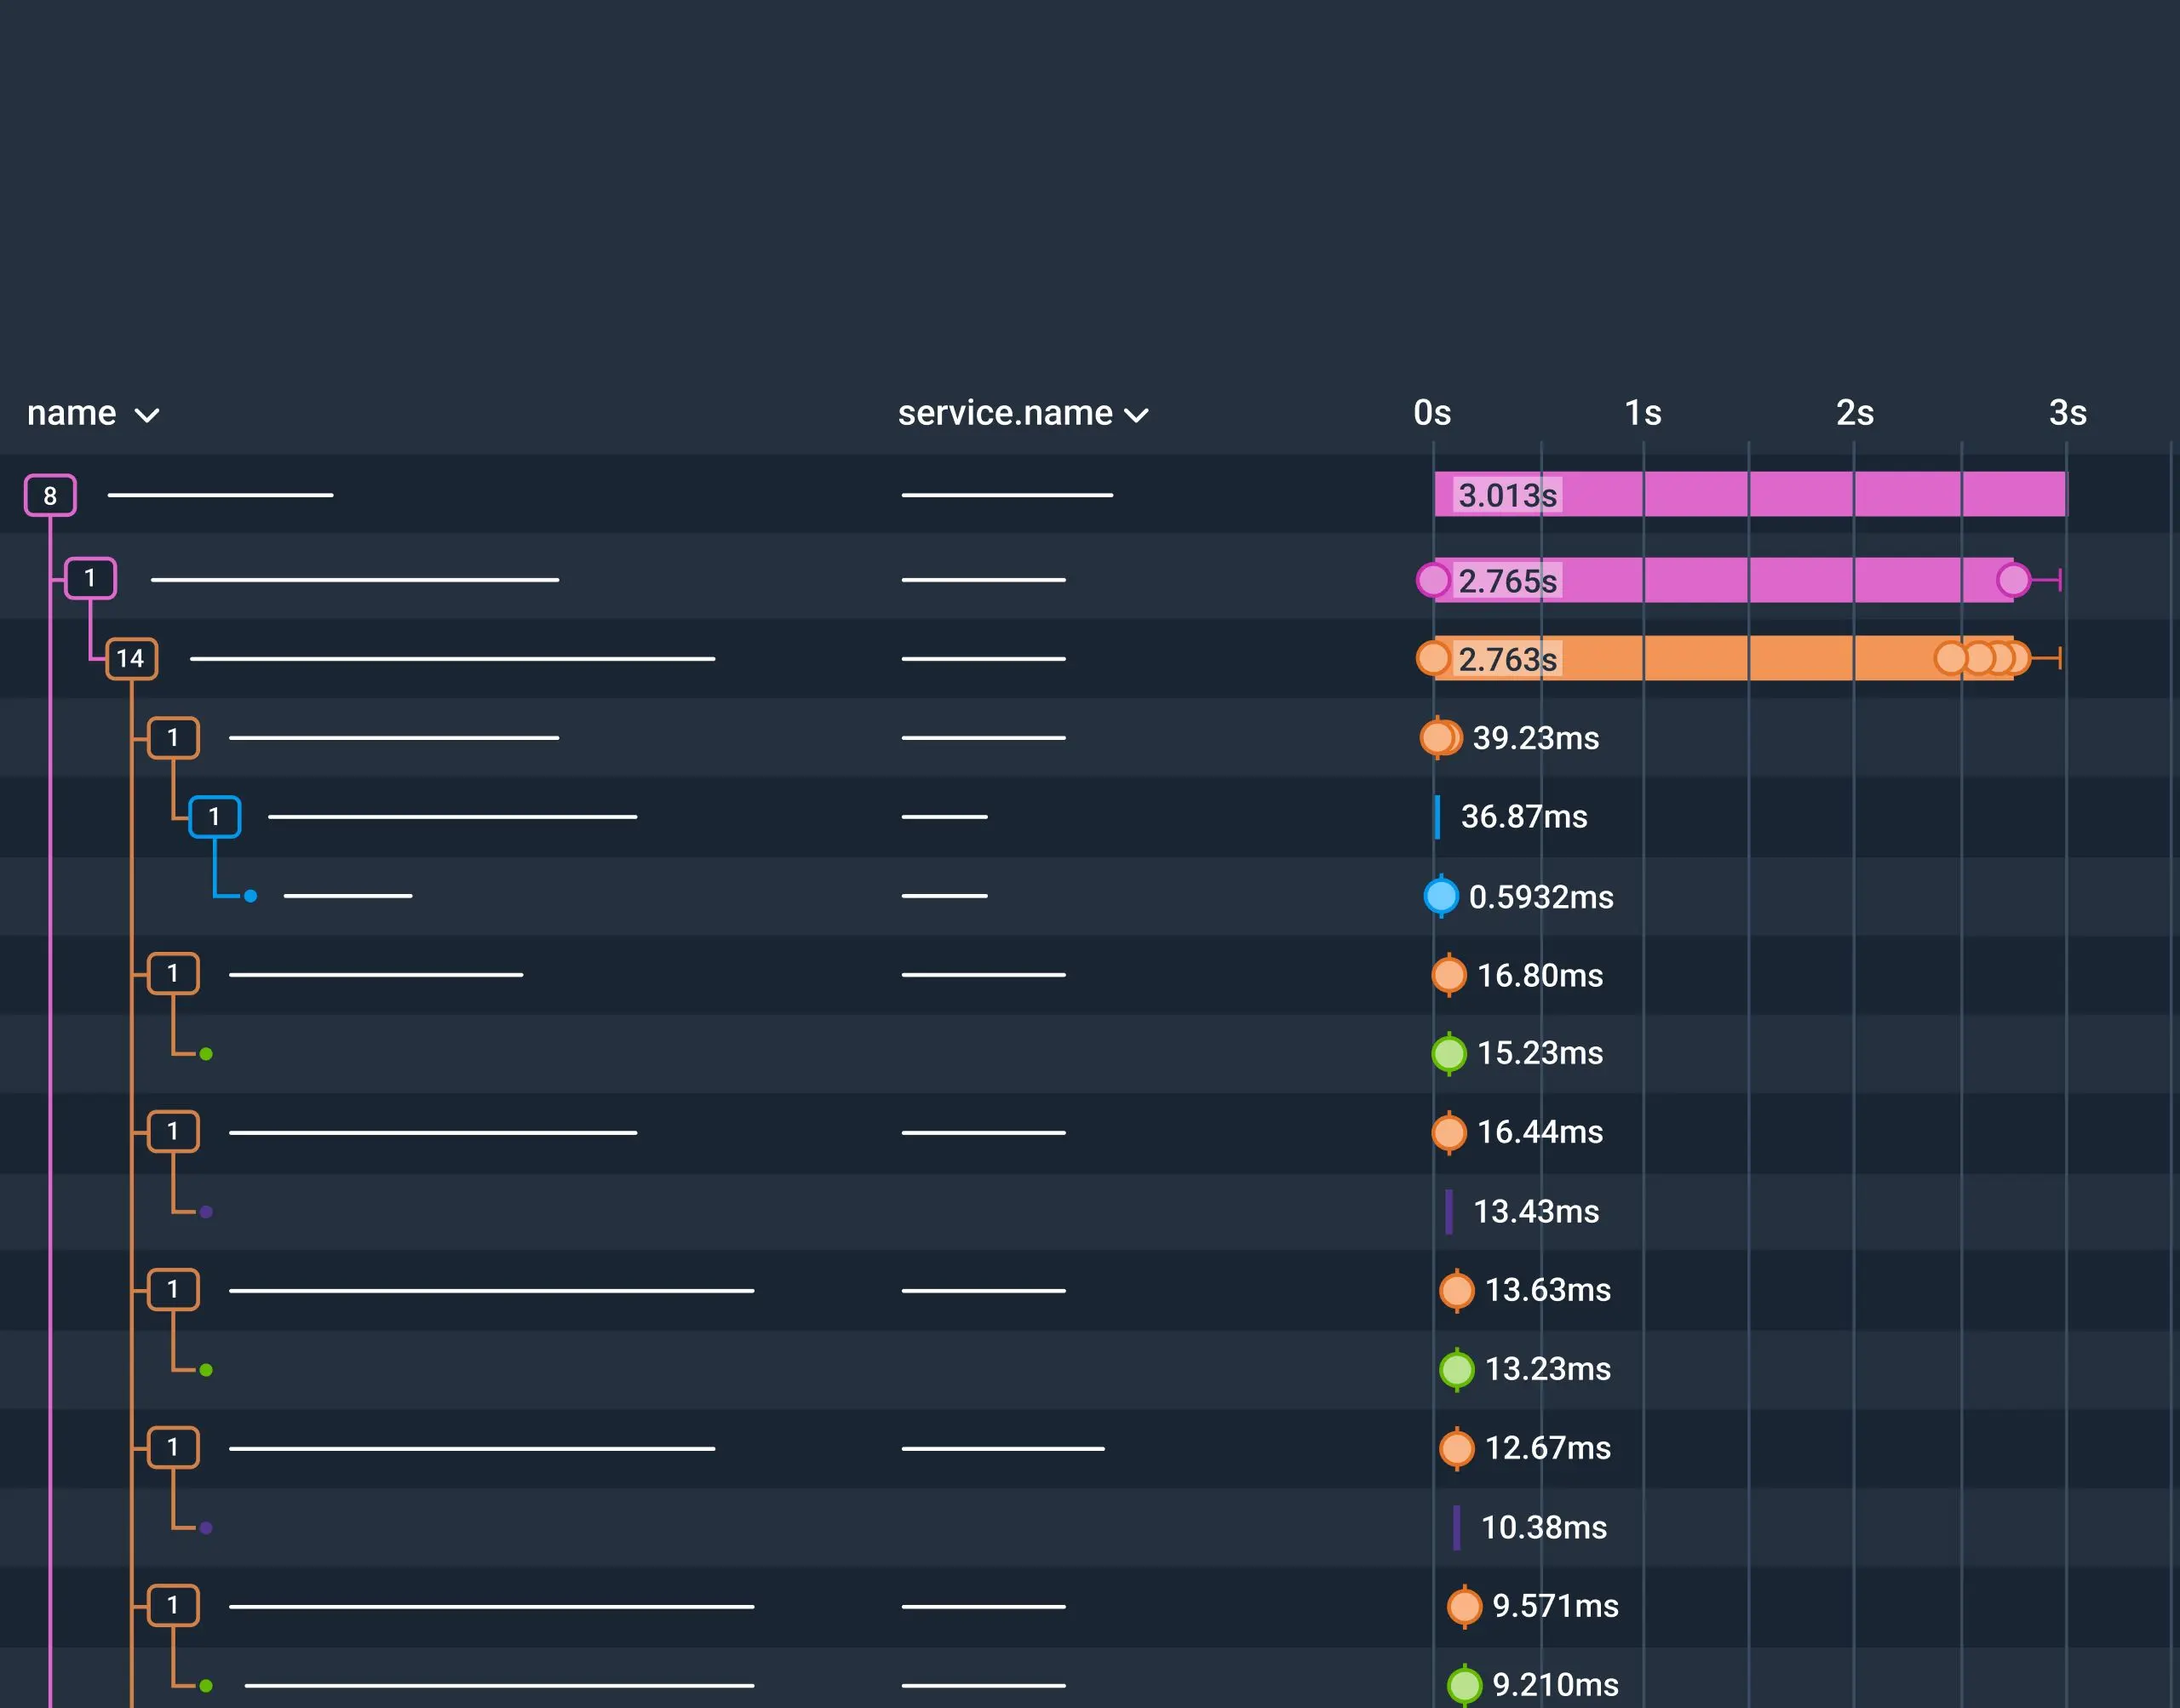
Distributed traces provide the best of both worlds
Distributed traces are designed to address all of the challenges outlined thus far. Each service can be instrumented with awareness of its upstream parent, resulting in a visually legible waterfall diagram of the end-to-end details for a single request. Each trace is composed of spans which describe each individual event along the way. Each span, in turn, is augmented with as much metadata as possible for use in later diagnosis. These “dimensions” can be used to capture important configuration parameters that would normally be confined to logs, and crucial performance data that would normally be provided by metrics. But, unlike either of those solutions, traces provide additional context to track and correlate that data from one service to another.
Instrumentation is easier
By providing an open standard backed by the Cloud Native Computing Foundation (CNCF), OTel was embraced by APM and observability vendors alike as a way to standardize tracing configs. This results in a significant reduction in vendor lock-in, and makes implementing OTel a safer long-term investment.
A growing stable of language, format, and framework support have similarly made the cost of that initial implementation much easier to bear by combining a solid foundation of auto-instrumented telemetry with custom instrumentation tailored to the needs of each individual app and team. This allows teams to reap benefits immediately while iteratively improving and refining the telemetry they collect over time.
Observability and distributed tracing is for everyone
No performance issue was ever made better in a silo, which is why distributed tracing offers truly distributed performance data. Teams across an organization can access the same query results, streamlining debugging and creating a common ground for discussion, investigation and more.
The compounding challenge of instrumenting distributed systems
As apps become more complex and spread out, setting up monitoring tools has become trickier—and not just because the apps themselves are more complicated. With more services to track, you often face the problem of using tools that are tied to specific vendors or platforms. This can be a hassle if your services use different languages or your company ends up with a codebase that sends data to various vendors.
Evaluating or switching to a new solution can be expensive, so many companies use less effective tools. Open-source solutions like OpenTelemetry help with this by offering a vendor-agnostic way to track all your apps. This means you can instrument once and send your data to any platform you choose, without needing to redo everything when you switch tools.
Distributed tracing best practices
Here’s how DevOps teams should set themselves up for success with distributed tracing.
1. Start with why
Although nearly every software development practice can benefit from distributed tracing, organizations with particular needs will see an immediate benefit. DevOps teams using microservices architectures are obvious candidates for distributed tracing, but that’s not the only factor. Companies with extremely complicated monolithic code can benefit, as can distributed teams trying to improve the speed and quality of debugging.
But it doesn’t stop there. Does your application generate high-cardinality data, meaning there are attributes that can have many possible values? High-cardinality data is hands down the most useful information to have when debugging, and the best tool to tackle that detailed data is distributed tracing.
And, at the risk of sounding simplistic, teams that don’t know what they’re looking for when debugging would clearly benefit from distributed tracing.
2. Choose OpenTelemetry
The advantages of open source technology solutions are well-known, and that’s equally true when it comes to distributed tracing. Jumpstart the tracing process using OpenTelemetry API libraries and choose tools that will support it.
3. Set up for success
Establishing distributed tracing as part of the software development process means keeping track of lots of moving parts. To ensure teams aren’t missing anything, cover the basics, including:
- Everything must be end to end.
- Implement SLOs based on acceptable latency thresholds in your most important traces.
- Set up a system that will track feedback on response, error, and duration metrics.
- Put a serious focus on duration (because that’s a way to judge how effective the distributed tracing process is).
- If custom tracing spans or business metrics are created, it’s important to have a way to report the data.
How Honeycomb does distributed tracing
Typically, vendors treat traces as a discrete complement to logs and metrics. Honeycomb’s approach is fundamentally different: wide events make it possible to rely on traces as your only debugging tool, consolidating logs and metrics use cases into one workflow. And unlike metrics, tracing in Honeycomb models how your users are actually interacting with your system, surfacing up relevant events by comparing across all columns.
Over time, we’ve made updates to distributed tracing that make it easier to navigate traces and find the insights you need—quicker:
- The new trace summary highlights long-running spans and issues at a glance, so you can jump straight to problem areas with a single click—no more hunting.
- Navigation is smoother too. Now, you can open span events and links directly from the trace waterfall. Just click on an event to view its metadata or use the link icon to explore related spans, keeping everything at your fingertips.
- With trace zoom, you can focus on a subtree by expanding a span’s duration across the whole trace. Plus, you can share this zoomed-in view via permalink, making collaboration effortless.
- Lastly, span link attributes are now visible in the span details sidebar. Click on the link icon next to a span to expand its attributes.
These updates make tracing faster and more intuitive, helping you troubleshoot errors, optimize performance, and get insights without the hassle.