Ask Miss O11y: Not Your Aunt’s Tracing
Dear Miss O11y, How is modern observability using tracing, such as Honeycomb, different from the previous distributed tracing software I’m familiar with, like Dapper, at my company? I haven’t really been able to wrap…

By: Liz Fong-Jones

Dear Miss O11y,
How is modern observability using tracing, such as Honeycomb, different from the previous distributed tracing software I’m familiar with, like Dapper, at my company? I haven’t really been able to wrap my head around Dapper. Does “advanced” observability mean that it’s even more complicated than Dapper is?
Auntie Alphabet
Hey Auntie Alphabet,
It’s always great to hear from a former colleague! You’re right that in the beginning, there was distributed tracing software like Dapper (Google/Alphabet), Zipkin (Twitter), and Jaeger (Uber), each created by a big tech company for its own needs at the time. And at the time, that need was to have something to augment their existing monitoring on a hyper-scale system. Thus, they designed tracing systems to aid the most advanced users in understanding complex relationships between many services by allowing Site Reliability Engineers (SREs) and especially production-minded software engineers to inspect individual requests flowing through the systems.
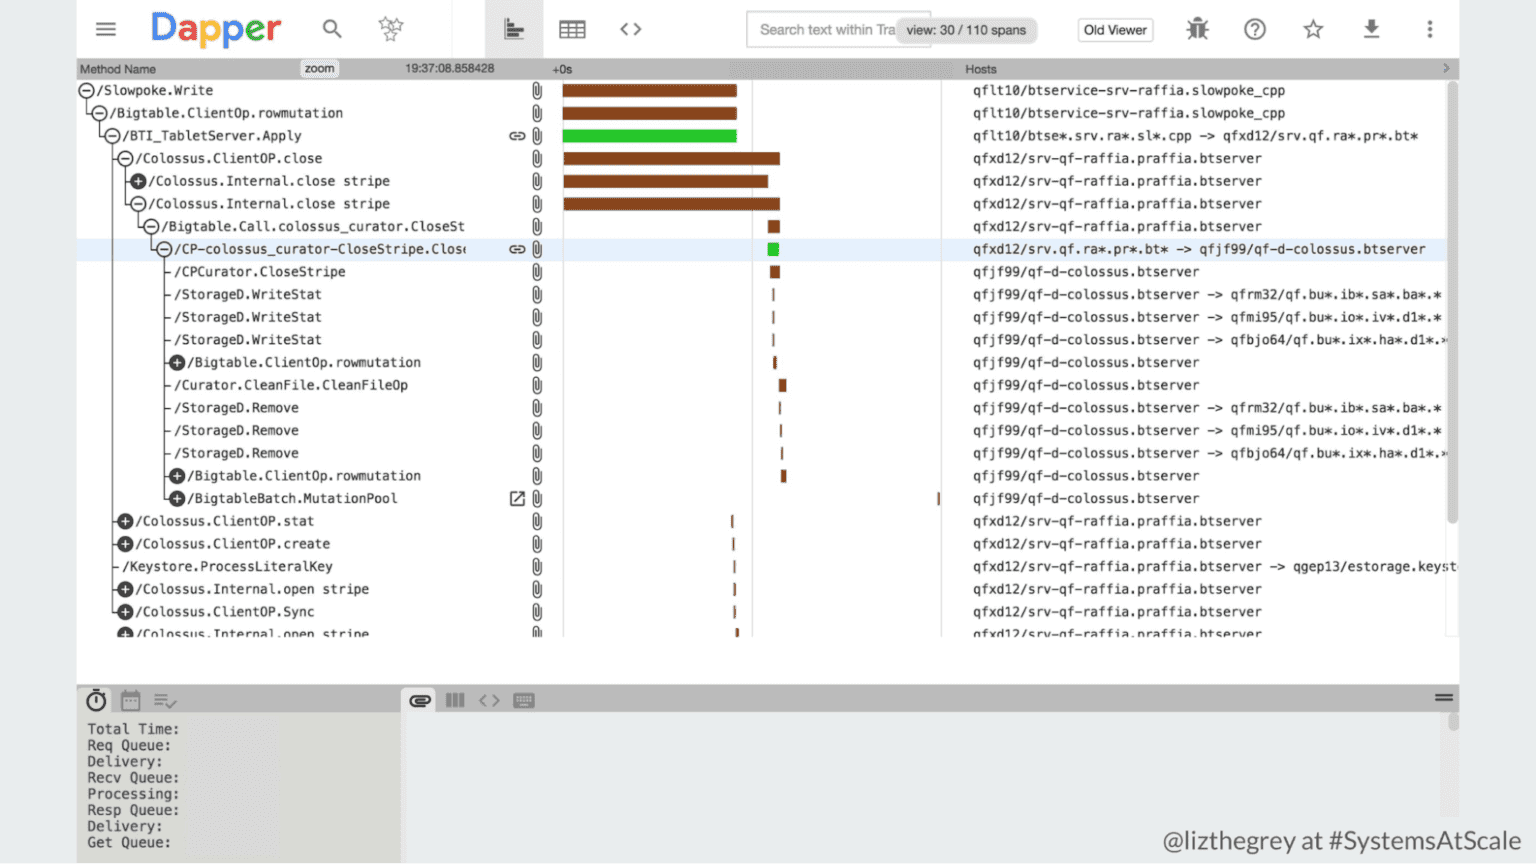
Because of the challenges of scale, these systems were designed to sample only a very small percentage (less than 1/100,000) of requests. And the typical entry point to tracing was starting from a single misbehaving server (having already narrowed things down to that server) and looking for a few of the slowest requests that had already passed through and been chosen for sampling. You then had to know how to read the waterfall graph to find out where your service was and how it related to the trace as a whole!
Because tracing was doing head sampling only and at 1/100,000, a trace exemplifying the 99th percentile latency would be only 1/100 of the samples, and thus you’d have to get lucky and have the 1/100 align with the 1/100,000 for a cumulative probability of one in ten million! Doable if your service is serving hundreds of thousands of requests per second; less likely if your service is merely serving hundreds of requests per second.
Thus, you’re entirely right that your past experiences with distributed tracing with Dapper may have been suboptimal or as a tool of last resort, rather than a default for you and your teams to work with. What separates these older tracing systems from more modern ones like Honeycomb is not only the level of sophistication—it’s also the ease of initial adoption.
A trace-first tool starts with collecting a weighted proportional amount of raw trace data from your systems, ensuring that you’re able to more easily dig into the tails of your latency distribution. It ensures that any kind of data you need to see is rendered from that raw trace data, whether you’re looking for a heatmap of request latencies for a particular service, or a trace waterfall like Dapper’s, or if you’d like to just dive in and look at the fields of the data as raw events.
That way, you can use the same data to power all your debugging, rather than having to hope that there’s a trace that represents that weird spike you saw on your metrics graph. And we make finding the right trace easy when you do need a concrete and specific example. Oh, and one more thing: You don’t have to trace the whole system end-to-end to see value. Because you can filter and search your traces by any value and group by any value to produce visualizations, you can see value from instrumenting just one service and seeing the gremlins hidden in the cardinality. And the value increases exponentially with each service you wire together.
Miss O11y
Want to know more?
Talk to our team to arrange a custom demo or for help finding the right plan.