How to Avoid Paying for Honeycomb
You probably know that we have a generous free plan that allows you to send 20 million events per month. This is enough for many of our customers. In fact, some have developed neat techniques to keep themselves underneath the event limit. I’m going to share one way here—hopefully no one at Honeycomb notices!

By: Martin Thwaites

You probably know that we have a generous free plan that allows you to send 20 million events per month. This is enough for many of our customers. In fact, some have developed neat techniques to keep themselves underneath the event limit. I’m going to share one way here—hopefully no one at Honeycomb notices!
A lot of people opt to simply reduce the amount of spans they create in their code, removing instrumentation that would add value if kept. This will definitely help, but it’s at the expense of a level of observability. Some of this instrumentation would aid in debugging, like SQL spans with understanding the queries that were run as part of the request. If you go too far with this, you’ll feel like you’re not actually seeing the benefit of tracing over logs and metrics.
I’ll show you how you can deploy a container in your infrastructure, with a small amount of config, that will implement a technique called tail-based sampling. This reduces the amount of data (spans) you send to your backend, which means you pay less. We have a container-based solution called Refinery that does this for you.
The executive summary here is that while you can do this, it’s mostly useful when you have significant volume. You can certainly get results at smaller volumes—however, this risks your queries providing results that might not be as accurate. This is all to do with the complex math involved in providing effective samples, which gets more accurate the greater the size of the original dataset.
What is trace sampling?
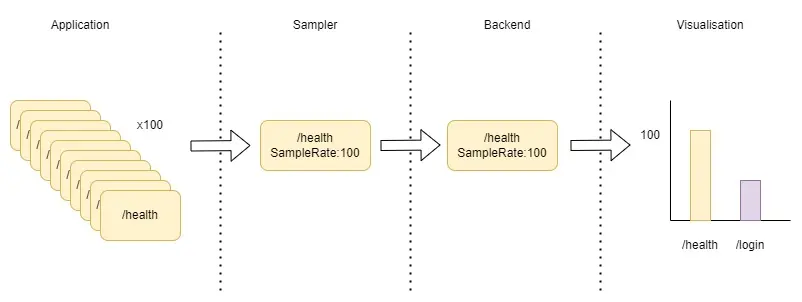
Sampling within tracing is the idea that we keep a certain amount of full traces (the sampled traces) and discard the rest. However, we note what percentage those sampled spans represent of the whole, so that when we’re querying the data later, we can account for that.
An example would be sampling of calls to the health check endpoint in your application. We can decide to sample (keep) one of every 100 calls so that we can see what they look like. We don’t care about seeing the other 99, as they’re likely identical. So we would send one trace to the backend, then add an attribute to each span that says, “This represents 100 spans.” This is known as a few different things, from sample percentage to sample rate. In Honeycomb, we add this in an attribute called SampleRate, and this contains the total number of spans that this span represents.
There are two methods of sampling in applications and systems: head, and tail. You can read about each in my post on how to reduce observability costs—it also goes into when to use each method.
The key part here is that we also want to keep any of the health checks that were slow/errored, and that’s where sampling intelligently is crucial. That’s what our Refinery service does, as you’ll see in the next section.
How do I implement Refinery to do tail sampling?
Until recently, our tail sampling proxy felt inaccessible to anything but seasoned SREs and infrastructure engineers. However, it’s now incredibly easy to set up and run. You can get started with a single container, which is enough for a lot of organizations, then scale to a distributed cluster later as your needs outgrow what a single instance can do.
You’ll need:
- A place to deploy a container in your infrastructure.
- A place to store config files used by the container (i.e., a mounted volume from a persistent store, like S3/Azure Files).
In this example, we’ll use docker-compose to run Refinery and an OpenTelemetry Collector with a very basic configuration to act as a proxy. There is an example repository for you to try it out.
Docker-compose file:
version: "3.9"
services:
  collector:
    image: otel/opentelemetry-collector-contrib:latest
    volumes:
      - ./collector/config.yaml:/etc/otelcol-contrib/config.yaml
    ports:
      - "4317:4317"
      - "4318:4318"
    environment:
      - HONEYCOMB_API_KEY=${HONEYCOMB_API_KEY}

  refinery:
    image: honeycombio/refinery:latest
    volumes:
      - ./refinery/config.yaml:/etc/refinery/refinery.yaml
      - ./refinery/rules.yaml:/etc/refinery/rules.yaml
    environment:
- REFINERY_HONEYCOMB_API_KEY=${HONEYCOMB_API_KEY}You’ll notice that Refinery doesn’t expose any ports. That’s because we communicate with Refinery by sending the spans to the Collector. This way, we can use the features of the Collector, such as enrichment of span attributes, authentication, SSL, redaction etc. It also allows you to use Refinery in situations where you’re not using OpenTelemetry, like Jaeger and Zipkin, as the OpenTelemetry can act as a receiver for them.
A minimal OpenTelemetry Collector config is needed:
receivers:
  otlp:
    protocols:
      grpc:
      http:

processors:
  batch:

exporters:
  otlphttp:
    endpoint: "http://refinery:8080"
    headers:
      - "x-honeycomb-team": ${HONEYCOMB_API_KEY}
    tls:
      insecure: true

service:
  pipelines:
    traces:
      receivers: [otlp]
      processors: [batch]
      exporters: [otlphttp]
  telemetry:
    logs:
level: "debug"Here we’re exporting to Refinery using HTTP. You can enable gRPC for Refinery, which will expose a separate port. In this example, we’re only using HTTP so that we can keep our config simple.
Finally, we’ve added the tls.insecure flag. This is because Refinery doesn’t have an SSL-enabled endpoint. That’s why we suggest using the Collector as the ingest that your application sees.
Now we have the Collector set up, let’s get to Refinery. There are two required configs. The first is the refinery.yaml, which controls the functioning of Refinery, not how it samples data:
General:
  ConfigurationVersion: 2

RefineryTelemetry:
  AddRuleReasonToTrace: true
StressRelief:
  ActivationLevel: 85
  DeactivationLevel: 50
  Mode: monitor
Traces:
  SendDelay: 10s
TraceTimeout: 10sThere are a lot of defaults under the hood, but these are the settings I think will be important to you.
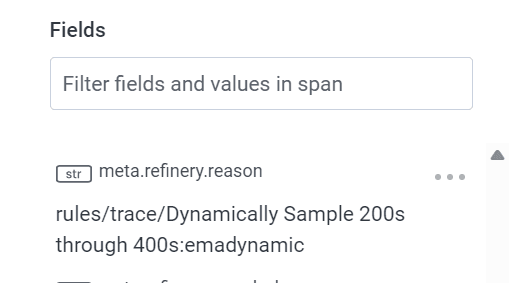
- RefineryTelemetry.AddRuleReasonToTrace: Ensures that when a trace is sampled, the rule that it’s part of is added as an attribute to all the spans in that trace. This means that you’ll be able to see what rules are used when you’re querying your data. It’s added as a meta field called meta.refinery.reason.
- StressRelief: An important function of Refinery. For instance, if your span buffers get too big, Refinery will sample at a default sample rate of 100 using deterministic sampling until things get under control. Honeycomb offers burst protection that should hopefully protect your event quotas.
- Traces.SendDelay: This is the amount of time, once a root span has been received, that Refinery will wait before it makes decisions. This allows for a distributed system to have all services report their spans for a trace. Sometimes, a child service may have a delay in sending spans, and the spans may be received after the root span comes in. The default here is two seconds, which will accommodate the majority of use cases. However, in asynchronous workloads like distributed messaging systems (or event-driven architectures), this can be increased to include time for those processes to complete.
- Traces.TraceTimeout: Allows Refinery to work when it doesn’t receive the root span. This setting defines how long Refinery should wait to receive the root span for a trace before starting the decision.
This is a very basic config that exposes the most useful settings, in my opinion. It will set up a single Refinery instance that listens for OLTP-formatted span data on port 8080. There are a lot more settings, such as sending metrics about Refinery to Honeycomb for monitoring purposes.
Defining dynamic, intelligent sampling rules
Next come the rules. This is how we decide what traces will be sampled, how much, and most importantly, how we decide which traces are considered to be the same. This is a minimal config that will provide a starting point for you to tailor to your specific system.
RulesVersion: 2

Samplers:
  __default__:
    RulesBasedSampler:
      Rules:
        - Name: Keep 500 status codes
          SampleRate: 1
          Conditions:
            - Field: http.status_code
              Operator: '>='
              Value: 500
              Datatype: int
        - Name: Keep Type 2 GRPC Status Codes
          SampleRate: 1
          Conditions:
            - Field: rpc.grpc.status_code
              Operator: ">="
              Value: 2
              Datatype: int
        - Name: Keep where error field exists
          SampleRate: 1
          Conditions:
            - Field: error
              Operator: exists
        - Name: Keep long duration traces
          SampleRate: 1
          Scope: span
          Conditions:
            - Field: trace.parent_id
              Operator: not-exists
            - Field: duration_ms
              Operator: ">="
              Value: 1700
              Datatype: int
        - Name: Dynamically Sample 200s through 400s
          Conditions:
            - Field: trace.parent_id
              Operator: not-exists
            - Field: http.status_code
              Operator: ">="
              Value: 200
              Datatype: int
            - Field: http.status_code
              Operator: "<="
              Value: 400
              Datatype: int
          Sampler:
            EMADynamicSampler:
              GoalSampleRate: 5              # This is a sample rate itself
              FieldList:
                - service.name
                - http.target
                - http.status_code
                - http.method
        - Name: Catchall rule
          Sampler:
            EMAThroughputSampler:
              GoalThroughputPerSec: 25
              FieldList:
                - service.name
                - http.status_code
- status_codeThe first thing to mention here is that the Samplers section’s first key is the name of the environment in Honeycomb. Refinery looks this up based on the API key you send, and it needs to match what you called your environment.
This file has an element called __default__, which means that if Refinery can’t match the API Key to an environment, these settings will be used. I’d recommend deploying separate instances of Refinery based on the environment they’re receiving data from, instead of relying on that lookup. It will result in a cleaner config. You likely want to keep that data separate from a compliance perspective anyway.
Let’s walk through this rules configuration. These rules are evaluated in the order they are defined, so if a rule is triggered based on the Conditions element, no further processing happens.
Note on FieldList
Where we use a dynamic sampler, we provide a FieldList. This is how we identify if traces are similar: by finding the value of all attributes in any span in the trace that match those names, sorting them alphabetically, and concatenating them together. This is known as the sample key, and it is added to the spans when we enable the RefineryTelemetry.AddRuleReasonToTrace setting.
- Keep all the traces with a 500 error: This means that any trace with a single span where the http.status_code attribute is set to 500 will be sampled (kept) 100% of the time (as the SampleRate element is set to one out of one traces).
- Keep all gRPC errors: Same as Rule 1, using the rpc.grpc.status_code attribute.
- Keep all traces with an error: Same as Rule 1, using the error attribute. This covers scenarios where it’s not an HTTP-level error.
- Keep slow traces: This will keep all traces where the root spans (trace.parent_id doesn’t exist) and the duration_ms attribute is over 1700ms.
- Sample 200-400s: Here, we identify root spans that have a 200-400 status code (essentially successful requests or user error) that are less than 1700ms (due to the previous rule filtering those). Then, generate the sample_key and sample at a rate of one in five (send one, drop four). Note: this isn’t exact—it’s a goal.
- Sample everything else dynamically: This is a catchall that generates a sample key, then samples at one in 25 (send one, drop 24). Again, this isn’t exact—it’s a goal.
That’s it. You should now have a tail sampling setup that you can point your app to.
Refinery is stateful
This is the biggest concern that I’ve heard from people when thinking about tail sampling. But what does it mean?
It means that the instance you’re running keeps all the spans in memory in a buffer. Therefore if your instance gets killed, you will lose the spans/traces that were held in that specific instance, but not yet sent. Given that the config only stores and processes data over a 30 second window (due to the timeouts and processing), you will potentially lose around 30 seconds of trace data. Whether or not that’s acceptable for you is a personal/business decision.
I honestly don’t see a problem if you’re using tracing for production debugging. There is a chance that in a particular 30 second window, you’ll lose some visibility. But that won’t be because of an outage in your application. More than likely, that’s an infrastructure issue with Refinery. In the event you get a high load, Refinery will revert to deterministic (random) sampling at a default rate of 100 (see the setting we discussed above called StressRelief).
If you use Honeycomb for accurate representations of traffic or for KPI reporting, then you should consider whether sampling affects those results. Specifically, sampling provides a statistically accurate representation of the original dataset, which gets more accurate as there is more data volume. That means accuracy can vary. This wouldn’t impact production debugging, as trends in the data are more important at that point.
In those scenarios, we recommend you send all telemetry data to a long-term persistent store, like S3/Azure Blob (using the OpenTelemetry Collector), as well as sending sampled span data to Honeycomb. You get the best of both worlds: fast production debugging in Honeycomb, and long-term analysis using persistent storage. This can, however, prove to be very costly as there may be a lot of span data to store (and query), so make sure you analyze the cost implications upfront.
So why should I pay for Honeycomb?
The free tier is a good start and offers most of the functionality of the platform. The Pro tiers, however, bring in features like SLOs and more triggers. That’s where you start to see even more value from raw tracing data as your single source of truth. You also get Single Sign-On, which reduces security burdens on your teams.
You need to think about the total cost of ownership (or TCO) of observability pipelines like Refinery. Think about how long you spent reading this article and how much it costs to employ you for the day. Then, think about the ongoing maintenance, support, reliability work—on top of the compute costs. Is it worth the time investment to save $130/month? $1,000/month? What about $10,000/month? At some point, it will become worthwhile and only you know that.
Finally, as your solution generates more data, the size of your Refinery instance will grow, eventually into a cluster, all of that then impacts the cost of running it. Perhaps that makes an argument to send more data to Honeycomb over sampling. Once you do get to a size where Refinery is useful, our support and customer engineering teams give hands-on support to make sure things run smoothly and are configured properly.
That’s also an ongoing commitment to a partnership with you and your teams. We grow by you getting value from your data, not by you sending us more useless data. Our teams have a vested interest in you getting the right insights at the right times.
Conclusion
You can use Honeycomb, at scale, without paying anything—or even just paying a small amount. Using the free tier at 20 million events with Refinery could mean that you end up with 100 million events represented—or more, depending on your appetite for sampling. If you’re paying $130/month for 100 million, you could jump to 500 million events. However, keep in mind the statistical accuracy issues, and also the TCO of building this out.
You should definitely think about sampling more spans (i.e., keeping more of the data). However, keep things manageable from a cost perspective using Refinery so that the cost scales with your product.
Are you ready to get started yet? Get your free account today. Otherwise, our very own Kent Quirk is speaking at Kubecon on dynamic sampling, which forms the basis of how Refinery works—a good opportunity to learn more on the topic.
Want to know more?
Talk to our team to arrange a custom demo or for help finding the right plan.