Don’t Let Observability Inflate Your Cloud Costs
We saw a shift this year in how the technology sector honed in on sustainability from a cost perspective. In particular, looking at where they’re spending that revenue in the infrastructure and tooling space. Observability tooling comes under a lot of scrutiny as it’s perceived as a large cost center—and one that could be cut without affecting revenue. After all, if the business hasn’t had a problem in the last few months, we mustn’t need monitoring—right?

By: Martin Thwaites

We saw a shift this year in how the technology sector honed in on sustainability from a cost perspective. In particular, looking at where they’re spending that revenue in the infrastructure and tooling space. Observability tooling comes under a lot of scrutiny as it’s perceived as a large cost center—and one that could be cut without affecting revenue. After all, if the business hasn’t had a problem in the last few months, we mustn’t need monitoring—right?
Our CTO posted an opinion: you should dedicate 20-30% of your total infrastructure spend to observability. I believe it is accurate to achieve a healthy environment. The question is, what can we do if what we want from an observability perspective exceeds this amount?
There are a few areas within your observability stack where small tweaks can help reduce costs, and I’ll go through them in this post.
Trace locality
In all environments, network bandwidth is a big cost factor. When you’re working in the cloud, this is broken down into:
- Within an availability zone
- Within a region
- Cross-region
If we can reduce the traffic in each of these, we can reduce that cost burden. This is where trace locality can help.
Imagine you’re running a monolith, where all the spans for a trace are encompassed within a single application. You can make decisions on whether to send the trace within the application (or a sidecar). This means that you have zero costs from transferring spans that you don’t actually want.
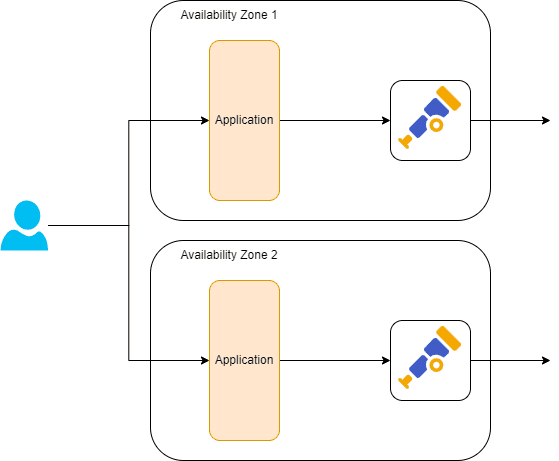
Now imagine you have a microservice application. If you can ensure that a single request (trace) only encompasses one availability zone, you can do all your filtering within that availability zone. This is generally free. If your system sends requests across multiple availability zones, you need to send all telemetry to a single zone for processing. This gets even worse if your request can go across multiple regions.
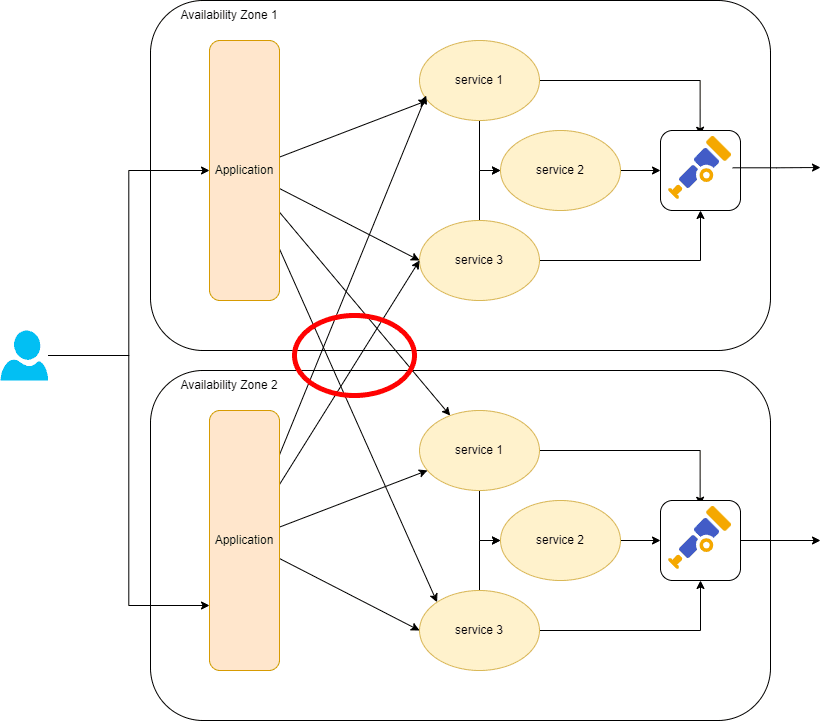
There are other benefits to keeping requests inside a single availability zone, in that you won’t pay for the bandwidth of the individual requests between services too.
You may need to run more instances inside individual regions/availability zones. There’s a cost tradeoff here that you’ll need to calculate—bandwidth is expensive, and at a certain level, it may become cheaper to pay for the compute or vice-versa.
Sampling
There are different techniques and algorithms for trace sampling. This is an entire topic of its own that we’ll cover in a later post. For now, you should know that there are two main mechanisms for sampling that can help with costs.
Head Sampling
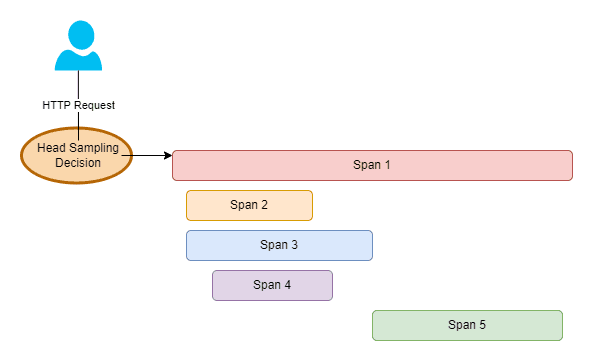
Head sampling happens inside your application when the root span is created, so therefore at your edge/routing layer like a BFF (Backend For Frontends), an API gateway, or your application that serves customer requests.
This method is great when you can make the decision based on very little information such as the URL, the user-agent, the origin, etc. It’s the most efficient way to save costs with sampling as it reduces the bandwidth going out of your application, and the processing overhead of generating spans inside your application.
The downside is that you have very little information to make the decision. You don’t know if the trace will result in an error, or whether it’s going to be slow, which are two of the most important traces not to discard as part of your sampling decision.
Some useful head sampling rules:
- Discard most of your healthcheck endpoint traces, keep a few samples
- Discard large amount of bot traffic (by leveraging user-agent) if you’re not as interested, keep some samples of different ones
Tail Sampling
Tail sampling happens in a location central to your services, or more specifically, centrally to where a single trace will occur (see point one about trace locality).
With this approach, you have a lot more control over what you’re discarding and why as you can analyze all the spans in the trace before you make a decision. You can use information such as the overall duration of the trace and whether an error or retry happened.
The downside is that you need additional compute resources in order to run a service to do this aggregation, which means additional resources to pay for and manage.

Peering
It’s very common to have self-hosted observability platforms separated from core infrastructure concerns, sometimes providing public endpoints to receive that data. This is the same when building central observability pipelines using the OpenTelemetry Collector, and will inflate costs as you’re essentially paying twice for the data.
If you are putting centralized OpenTelemetry collectors in place, consider peering and transit gateways. Pre-sampled trace volumes can be very high and that’s the volume that is potentially transitioning out of one isolated network into another. This means that you’re paying your cloud provider for costs such as NAT Gateways, and basic transfer costs.
Don’t forget to contact your observability vendor!
If you use a vendor for your observability platform, you can ask if they support services like AWS PrivateLink or Azure private endpoints. Honeycomb supports these in some regions, and they’ve saved our customers tens of thousands of dollars in cloud costs.
Don’t forget that using Honeycomb in and of itself can also save you money. Read this blog, in which we’ve outlined six ways Honeycomb can save on your cloud costs. Honeycomb also provides a service called Refinery which provides tail sampling inside your network that can greatly reduce the cloud costs incurred by some of the things mentioned in this post.
Further reading:
Want to know more?
Talk to our team to arrange a custom demo or for help finding the right plan.