Defensive Instrumentation Benefits Everyone
A lot of reasoning in content is predicated on the audience being in a modern, psychologically safe, agile sort of environment. It’s aspirational, so folks who aren’t in those environments may feel like the path there includes doing “the new thing” or using “the new tool.” If you write software and your employer hasn’t caught up to all the newest, best ways to work, I hope this pragmatic post helps you sleep better at night.

By: Mike Terhar
A lot of reasoning in content is predicated on the audience being in a modern, psychologically safe, agile sort of environment. It’s aspirational, so folks who aren’t in those environments may feel like the path there includes doing “the new thing” or using “the new tool.” If you write software and your employer hasn’t caught up to all the newest, best ways to work, I hope this pragmatic post helps you sleep better at night.
The basic premise: if you add some telemetry that shows how your app is doing, when something goes wrong somewhere in the system, your node will communicate whether it is the problem or not.
The advanced premise: if your organization doesn’t follow every best practice and cascading failures emerge when multiple downstream systems act oddly but none report errors, your app could be to blame—or, it could be a confluence of other issues making it fail.
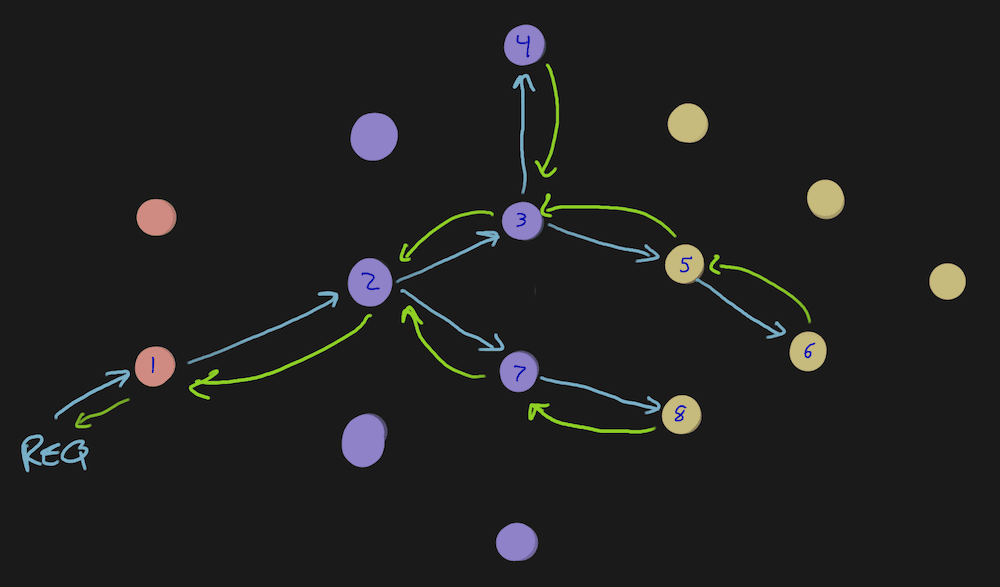
Here’s a graph of nodes that represent services. This is what a successful request looks like, where each green arrow is a successful response.
I’m doing my part
If you’ve studiously followed auto-instrumentation guides and added business context, user intentions, and other attributes to your span, that’s fantastic. Now, when something goes wrong, your app says “something is wrong” and you get paged while the incident plays out.
This can be good if your app is the source of the problem and you need to be there to patch it or diagnose the issue.
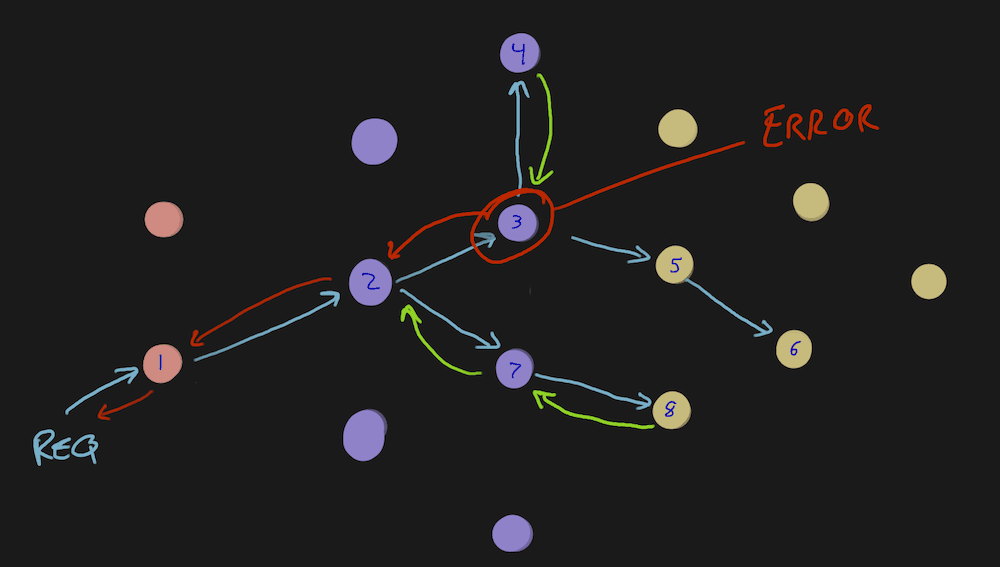
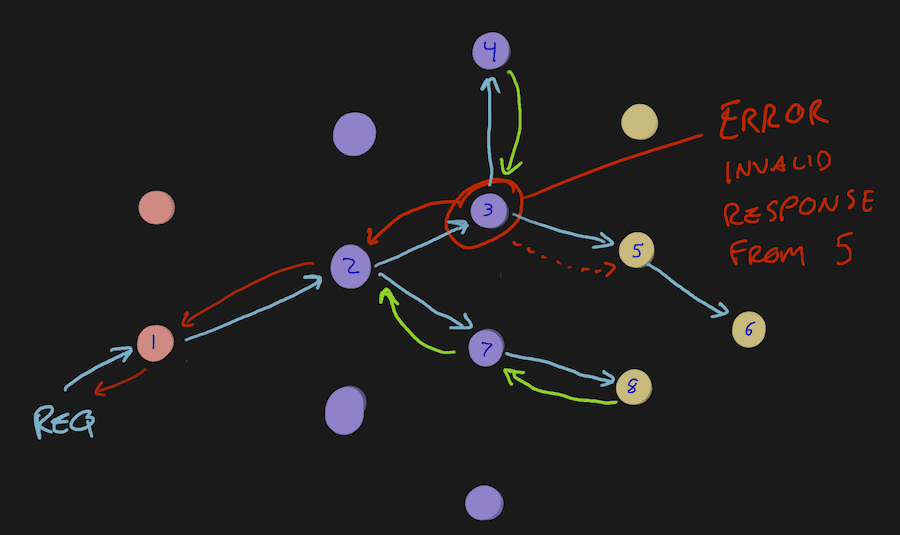
But, this can be bad if downstream systems failed and yours is just the deepest that has good instrumentation. In this diagram, what if the response from 4, though green “success” is, in actuality, an error? Maybe the request to 5 caused an error and never responded. Node 3 knows what’s going on and needs to share with the rest of the class.
Tragedy of the commons
In the case of applications that have been in service for decades, the ways that they behave as implemented become the ways dependent systems interact with them. A REST API that returns http.status_code: 200 with a body error: cannot communicate with database may have caused calling services to distrust the status code. If this service is auto-instrumented, the 200 status shows ‘all good here’ when interrogated, or for SLO reporting. In reality, the squashed error and inappropriate response code now makes the calling service look like the source of the error.
These things aren’t maliciously done. The majority of the time, the author of the code was also its only consumer, so using the error-in-the-body approach was how they wanted to handle it. After that service became a part of a dozen other business logic components, the way it deviated from the norm became the implementation pattern that any service needing its data would follow.
Fix it fix it fix it
Back to the aspirational message: when these things are surfaced, go set the status code. Problem solved. No need to read on!
It’s not on the roadmap
Oftentimes, these systems are already acknowledged as problematic and no further investment will be made because the “next thing” will do it differently. The “next thing” that is two years behind schedule also relies on another system that depends on this busted service.
It could also be an external API. The vendor management team would receive this feedback so they can escalate or find a new vendor for that service. These third-party folks are unlikely to participate in traces, so the request and response info is all you have to go on.
The best defense is a good defense
The best thing to do now is put up some defenses. Default instrumentations assume an error that was captured and squashed was handled by a retry and should not propagate up the stack.
These things will take literally minutes to implement entirely. The huge drag on this is agreeing to a standardized naming convention across the organization. You don’t have to wait for that since, once you add the attributes, you can get in and rename them very easily later.
Just as we validate inputs from an untrusted source, we need to validate responses from what should be a trusted source. If there’s something wrong with the response, add some attributes to your span—or a span event—saying what the problem is and which service the response came from.
You won’t be able to change the service.name attribute since it’s a resource attribute and is added to every span emitted from the service. The query showing the error will still be your service, but if the team is accustomed to a second step, you could add an error.external.service attribute which points toward the problem.
When this happens, to help troubleshoot further, including information about the request will help. Adding exception-like fields is good. If the response includes any error information, that will also help, as it could be a further-down-the-stack dependency creating issues and the service you’re calling is merely another victim.
If you’re not sure where these things should go, the best place to look is at recent incident reviews or runbook steps that reference specific dependencies. Then, open a trace and see if auto-instrumentation already picks it up and where that might be. OpenTelemetry lets you add attributes to existing auto-instrumentation traces so you should be able to get the current span context and add attributes. If it makes sense to make it a span event (i.e., it needs a timestamp and its own attributes) you can do that from the same span context.
Defenses all the way down
Once we get into the habit of consistently adding the right fields and attributes to our little corners of the whole application suite, two things will happen:
- Developers elsewhere will start adding these and sleep better since the correct system owners will get paged.
- Developers will start using these in the wrong places to avoid being woken up and it won’t be clear until an incident—aaaaand then we’re back where we started.
The good news is that in a very complicated graph of service dependencies, the more people employ this, the clearer the problem’s origin will be. If a dozen consumers point to the same producer and the producer points to a consumer, the producer is likely the issue and needs to either be fixed or instrumented better. Either way, it’s clear where the action needs to be taken. Only a couple of teams need to be dragged into the call, instead of 13.
In some cases, auto-instrumentation will capture these things in part of a stack trace—or, by looking a few layers up in the trace, you can find where it sent an HTTP request. The point of these defensive attributes is that you can make sure they all end up in the same place. They’re added deliberately, which helps build trust across the teams.
If you suggest other people dig through stack traces or hunt around for http.targets, you’ll most likely annoy the recipient of these suggestions. If you show them that you’ve crafted a beautiful span full of insights and reasoning, it’ll show that you respect their time and energy and it’s much more cooperative.
Taking the offense
The other thing we can do to be more active is reporting a “status response mismatch” with a span event or special attribute. If there’s a pattern in the organization of “failed successfully” outcomes in service interactions, there’s no better time than now to raise visibility to these patterns.
If any service that returns a success status with errors or invalid junk has a validation check that retries and keeps things working but also emits a span or span event with some information, that will come in very handy before things break.
Default fields like service.name, timestamp, and duration would be there, but you could add:
- the business intention: what was the customer trying to do?
- error.external.service for the service target
- error.external.action for the attempted action
- error.external.response_type for the expected response
- error.external.response for the actual response (or a truncated and redacted part of it)
- error.external.failure_count for the quantity of retries at this point. You can only add this once, so leverage this field in a span event—or count up and add after the entire thing works or breaks
Try to match the error.external.service with the service.name so if multiple places reference the same thing, it’ll be consistent.
Once all of this information shows up in Honeycomb, you can aggregate it to find places that are particularly fraught. BubbleUp will point to them as the source of delays or other problems. You could exclude these situations from SLO burn budgets. You could make a specific SLO burn budget for an allotted quantity and use that as the negotiation platform to justify budgeting fixes for these issues.
The Andon Cord attribute
I really want to give developers the ability to point to supply chain failures with actual data about the impact so they feel empowered to make it better. In software, it’s hard to know if one annoying service interaction is really worth investing in a fix.
You may know your service is hit 2,000 times per day and only a few of those call to the busted service for information, so it’s not a big deal. You may not know that several other services are doing the same thing, but they’re insanely high volume and have a lot more trouble with retries. Seeing the same problematic service show up in dozens of places, accounting for thousands of failures any given day, would make it a lot easier to say, “Stop! This thing needs attention.”
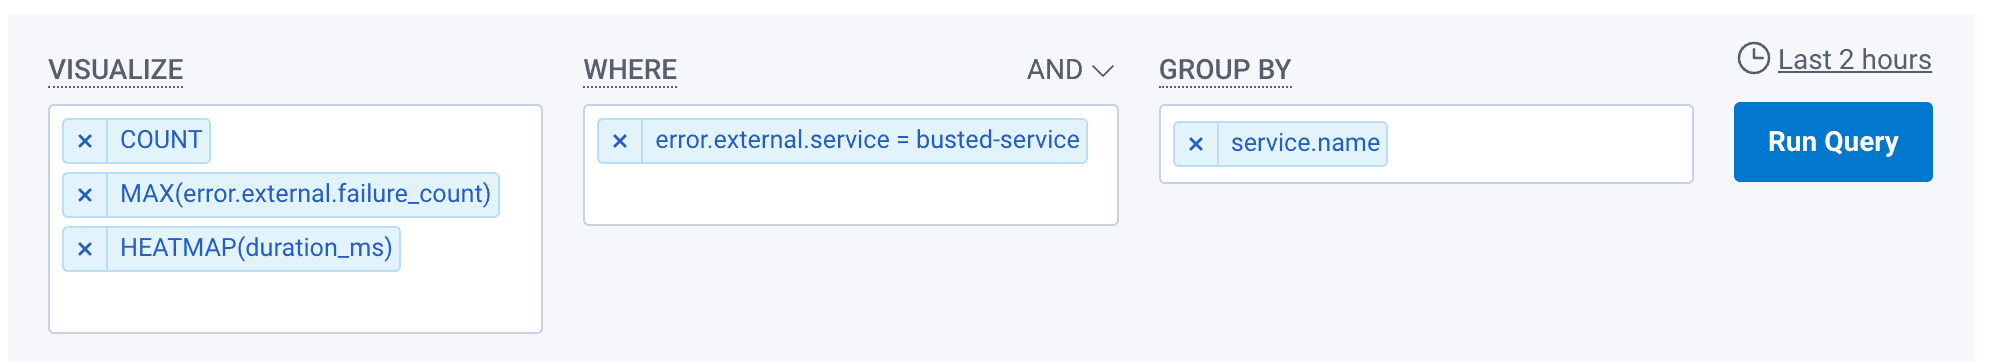
A simple query can show how many services are impacted and how severely. If you have retries, you could include that and a heatmap of durations:
After the organization lives with this for a while, it may be worth having a more severe escalation option with an app.andon_cord attribute that triggers alerts to hit a mythical, cross-functional team that can jump in and fix the supply chain issue before its quirks become an implementation detail for a bunch of other services.
Where to start
Realize that it’s okay to defend yourself and your time. Realize that instrumentation can help you make your case that your work is good and your software is resilient. And finally, add some defensive retry logic that includes alarm bell telemetry to nudge incident investigators toward the real source of the issues, rather than always landing on your impeccably-instrumented service.
Also, know that everyone struggles with these sorts of problems. If your company has more than one team, there’s most likely friction between teams that would benefit from clarity around where handoffs and dependencies are.
Join us in our Pollinators Slack to commiserate, or to share suggestions and successes in this area.
Want to know more?
Talk to our team to arrange a custom demo or for help finding the right plan.