Where Does Honeycomb Fit in the Software Development Lifecycle?
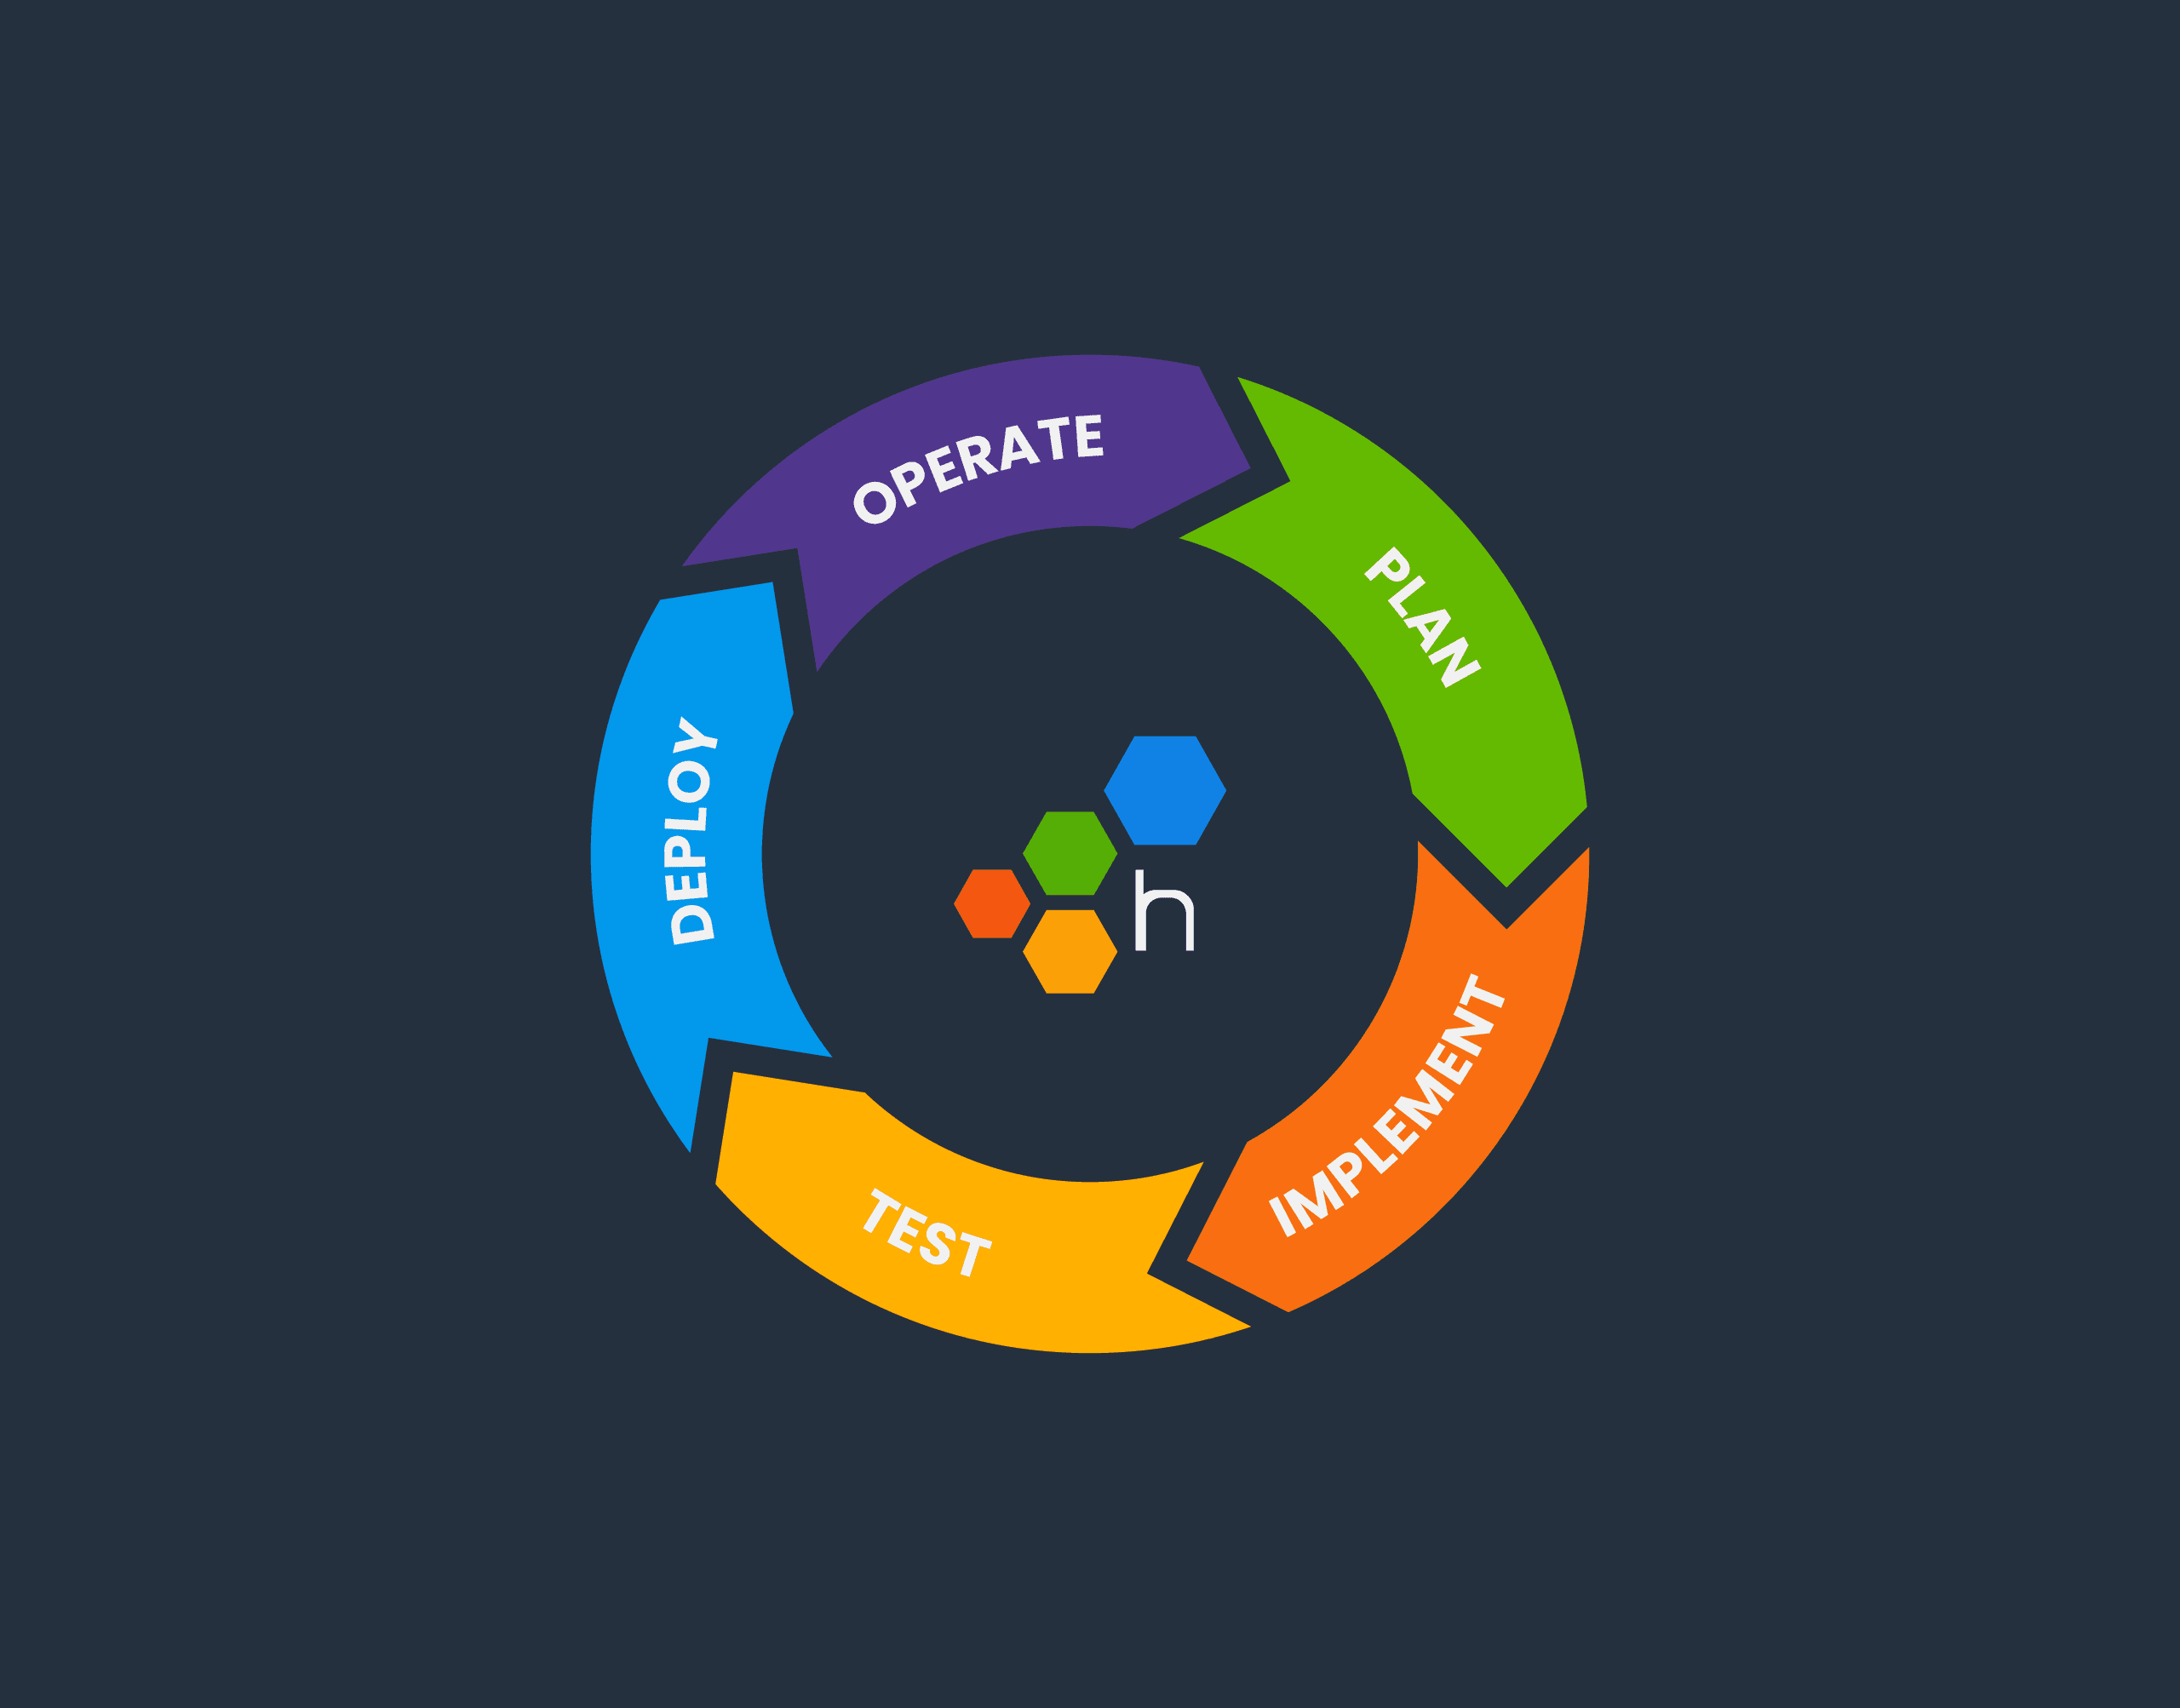
The software development lifecycle (SDLC) is always drawn as a circle. In many places I’ve worked, there’s no discernable connection between “5. Operate” and “1. Plan.” However, at Honeycomb, there is.

“Mommy, where does software come from?”
“Software grows in a circle, just like this!”
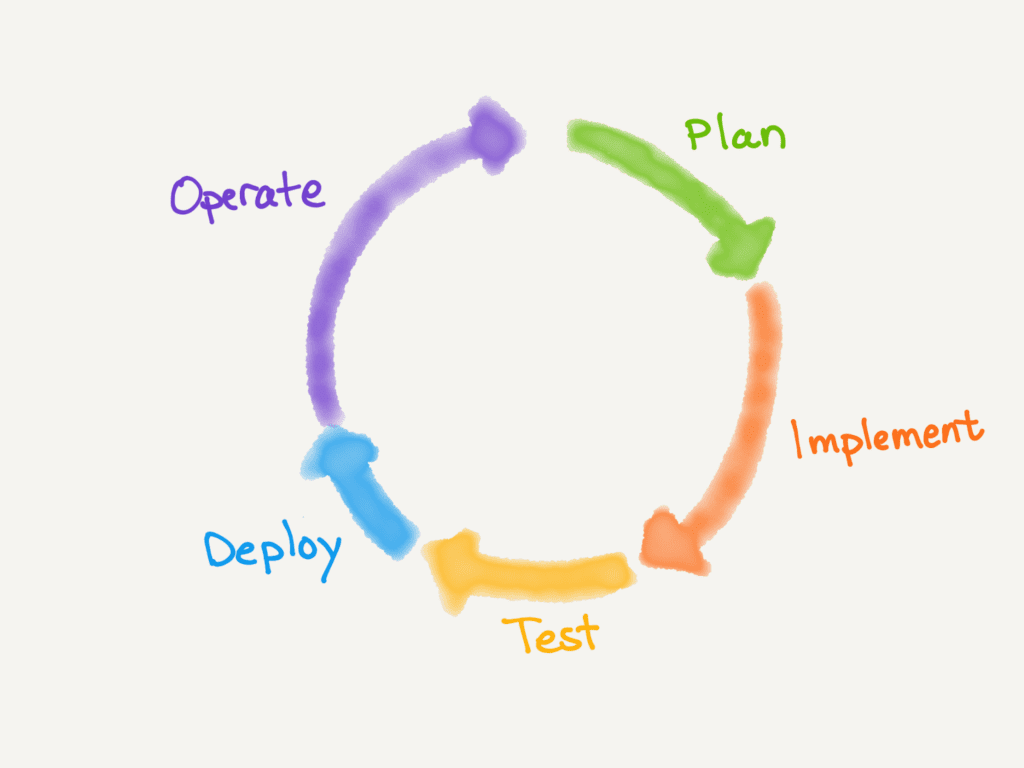
The software development lifecycle (SDLC) is always drawn as a circle. In many places I’ve worked, there’s no discernable connection between “5. Operate” and “1. Plan.” However, at Honeycomb, there is. More on that later. First, let’s add Honeycomb to this diagram.

The most obvious place to include Honeycomb is in the “Operate” phase, where you want the software to work, work well, work fast, and keep working. During an incident, our fast dynamic queries—linked to trace waterfalls and BubbleUp analyses—give unmatched access to the root cause of a particular error or slowness. Honeycomb lets you answer, “What is broken (or slow)? Where did that error start? What is different about the requests that failed?”
Understanding what is happening in your software, especially across services and teams, is a challenge in every part of the SDLC. Let’s see how Honeycomb fits:
Implementation: Honeycomb shows where to make a change
As a developer, writing code starts with reading a lot of code. What does it do now? How will it be different when it does the new thing, and how will I prove that?
In the past, I was limited to unit tests and a few difficult, fragile automated integration tests.
Now that I have distributed tracing, I start in Honeycomb. I look at a trace to find out where the code needs to change. From there, I can query for which other services call that code, because they might be affected. Then, I decide how the trace should look after I make the change.
As I’m developing, I look at the traces to see that they tell me the code works. Instrumentation (code that makes traces or logs) is part of implementation, just like unit tests.
Test: Honeycomb brings it together
In this phase, we plug the changed code into the wider system and make sure it works. Some organizations automate this; many supplement with active clicking to smoke test the whole system. Is it working as expected? If not, who can fix it?
When a new feature takes work from multiple teams, problems usually emerge when you start running integration tests. Something breaks, and the teams push the defect back and forth. It can become “my logs vs your logs” for where the problem is.
Not anymore! When your organization consistently sends data to one place (Honeycomb), constructing one distributed trace, then all the teams are looking at the same picture. It becomes clear where communication broke down—we can skip the blame and go right to fixing the problem.
Deploy: Honeycomb inspires confidence
Deployment can be a source of fear, or a source of job satisfaction. Is it going to break anything? If it does, how will I restore service?
Observability addresses this directly. Deployment goes from Fear of the Unknown to confidence that if production holds surprises, we can notice that and fix it directly.
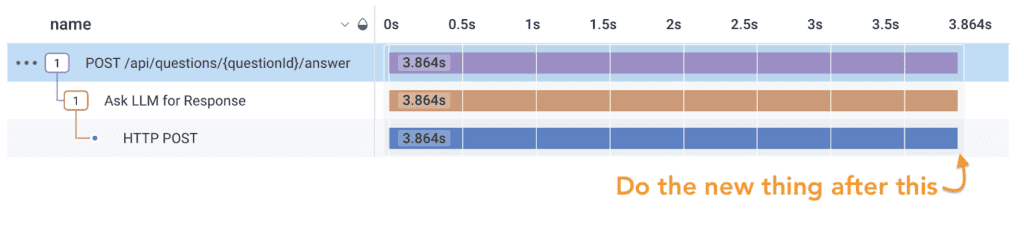
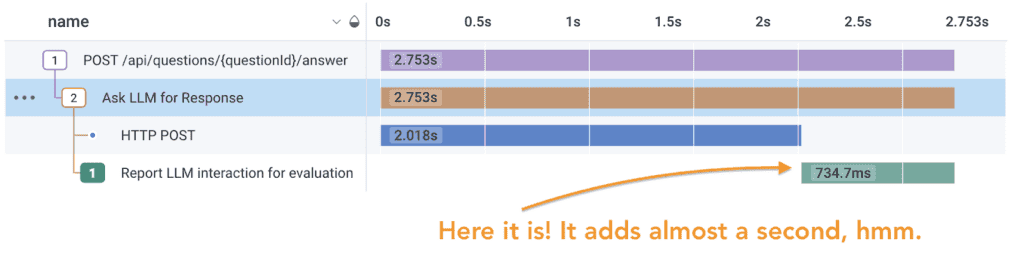
As a developer at Honeycomb, when my change rolls out to production, I watch it. I look at the traces to see that my feature is working as expected. Then I can aggregate: is my code being reached? How much time is it adding to our latency? Is anything failing?
Operations: Keep it smooth
There’s a lot written already about how Honeycomb is great for fast troubleshooting during incidents. It’s great for noticing—and fixing—problems before your customers do.
At the same time, Honeycomb’s SLOs reduce alert fatigue. Instead of alerting on all past root causes of problems—low disk space, high CPU, fluctuating errors in a constituent service—alert when customers are impacted. Then, drill down to a whole new root cause that you haven’t seen before.
Link Operations to Planning: Data-informed product decisions
Now for my favorite part! Because Honeycomb opens a window to what happens in production, Product Managers can find out how customers use the software:
- Who uses which feature—is it free users, or our best customers?
- Are they using the feature in the ways we expect?
- What error messages are happening?
- Is it fast enough?
- Is the load too high at peak times?
- Is it growing?
- How many retries happen normally?
- What service adds the most latency?
Product managers can make informed decisions about which features to implement and when. They can see when it is time to invest in resilience or scale. They can measure the outcomes of past feature implementations.
Finally, Operation feeds into Planning. Visibility into production activity, with full granularity by customer, gives the running software a voice in Product decisions. The circle is real.
Honeycomb is unique in this breadth
There is something unique about Honeycomb that expands the breadth of its usefulness from monitoring and troubleshooting to the full software development lifecycle.
…okay, it takes two things:
- Adding rich context is free and fast. Include customer ID, price plan, region, instance, CPU usage, full (sanitized) input & output. No indexing, no per-custom-metric pricing.
- Graphs and traces (including logs) are interconnected. When the graph is generated (quickly) from your trace and log data, then you can always click it to get to the whole story!
These attributes are unique among observability platforms today, and they make Honeycomb more flexible and more useful than other tools.
Make the circle real. Sign up for a free Honeycomb account today.
Want to know more?
Talk to our team to arrange a custom demo or for help finding the right plan.