Introducing Native Mobile Support in Honeycomb for Frontend Observability
You shipped your latest release. You tested it on emulators, QA devices, and the latest OS versions. But now it’s live and running on thousands or millions of real devices, across a jungle of screen sizes, hardware specs, OS versions, and network conditions. A user reports a crash on an old Samsung device over 3G. Someone else complains the app feels “sluggish” after updating. You dig through logs. Rebuild test cases. Ping the backend team. Try to reproduce. Yet, still no answers.

By: Elsie Phillips


Catching Up With Fender: How Frontend Observability Powers Better User Experiences
Learn MoreYou shipped your latest release. You tested it on emulators, QA devices, and the latest OS versions. But now it’s live and running on thousands or millions of mobile devices, across a jungle of screen sizes, hardware specs, OS versions, and network conditions. A user reports a crash on an old Samsung device over 3G. Someone else complains the app feels “sluggish” after updating. You dig through logs. Rebuild test cases. Ping the backend team. Try to reproduce. Yet, still no answers.
Debugging mobile issues in production is one of the hardest parts of shipping software today. The data you need is disjointed, scattered across multiple tools, or altogether missing. You’re left stitching together context and guessing at the cause. Honeycomb for Frontend Observability, now with native mobile support, is built to change that.
Mobile engineers can now diagnose, resolve, and communicate the impact of performance issues with unified, end-to-end observability, so they can see precisely what happened, why, and who it impacted from one workflow.
Unlike other mobile crash reporting and performance monitoring tools, Honeycomb for Frontend Observability isn’t built on dashboards that lead to deadends. It gives mobile teams a shortcut to both high-level health signals and precise root cause analysis so they can deliver the polished and performant experiences users expect and their business depends on.
What’s included in native mobile support
Mobile SDKs with Core Mobile Vitals, built on OpenTelemetry
Honeycomb’s SDKs for iOS and Android extend the OpenTelemetry SDKs so you can instrument mobile apps quickly without needing OpenTelemetry experience.
These SDKs provide out-of-the-box auto-instrumentation for Core Mobile Vitals: key metrics that reflect your mobile app’s performance so you can capture the high-level health signals that matter with all the underlying data needed to know how to improve them.
Getting trace propagation working smoothly can be another hurdle for teams wanting end-to-end visibility.
With Honeycomb’s mobile SDKs, traces propagate using OpenTelemetry-standard protocols like OTLP over HTTP automatically, ensuring that spans captured on the device continue seamlessly across the services they call.
Android and iOS SDK features
The iOS SDK provides auto-instrumentation for:
- UIKit views including navigation and interactions
- Sessions
- Network events
- Swift UI navigation and other navigation types via a helper API
- SwiftUI views
The Android SDK provides auto-instrumentation for:
- Activity lifecycle, including traces before, during, and after each stage
- Application Not Responding (ANR) events
- Crash instrumentation foruncaught exceptions
- Slow or frozen renders
- UI interaction
- Android’s Compose library
In addition to auto-instrumentation, both support:
- Manual error logging for reporting exceptions from anywhere in your codebase.
- Custom span processors to perform operations on spans before they’re exported.
High-cardinality answers without the triage
In addition to the auto-instrumentation included with Honeycomb’s mobile SDKs, you can add thousands of custom attributes to every event at no extra charge. Any of them can be turned into custom metrics on the fly and they’re all available for filtering and querying, with no limits on cardinality.
For mobile teams, that flexibility makes all the difference. The root cause of a performance issue might depend on a specific app version, feature flag rollout, or user segment. With Honeycomb, you can follow those threads immediately to get to the root cause faster.

Mobile Launchpads: A debugging homebase
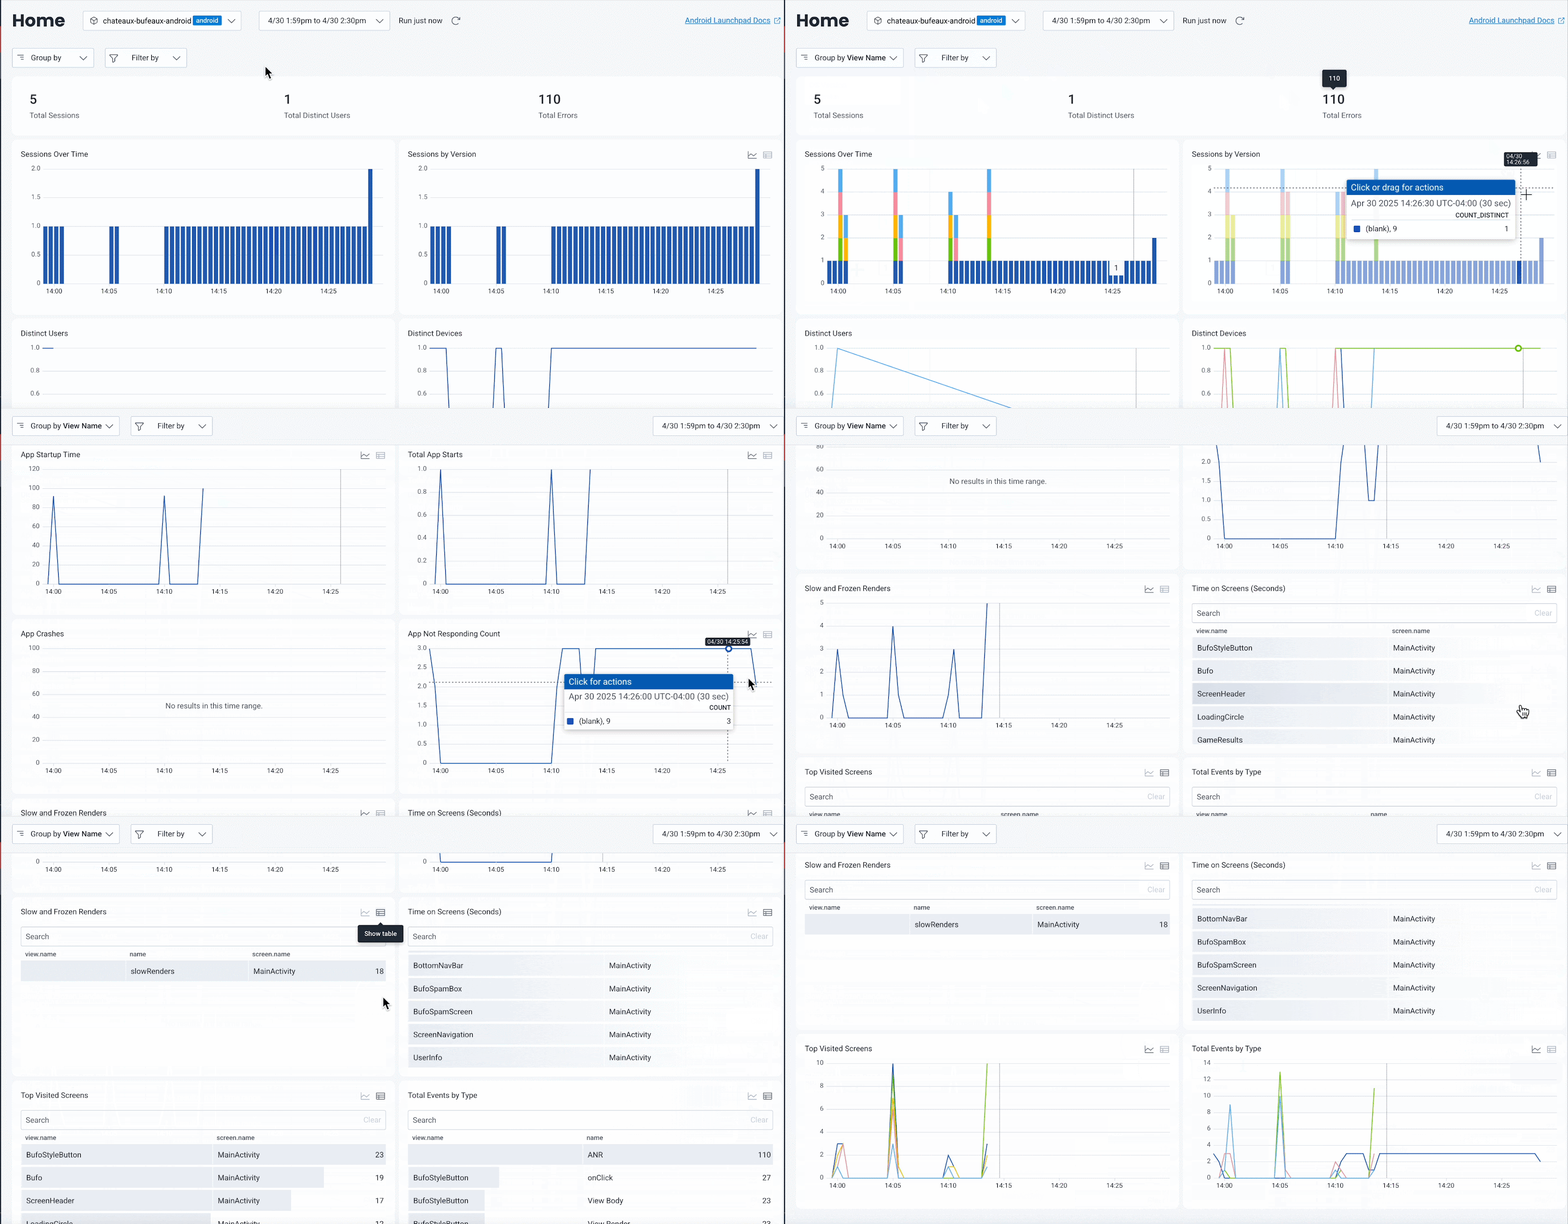
Android and iOS-specific Launchpads provide a focused view into the data that matters most for mobile engineers. They surface key performance indicators, including Core Mobile Vitals in interactive views where all the underlying data is available to filter and query on.
Views are filterable by both predefined and custom attributes, so teams can quickly slice the data to eliminate outliers or isolate issues across specific devices, OS versions, networks, user segments, etc.
Launchpads also surface relevant traces that begin on mobile, helping teams understand where performance issues originate—from the first tap on screen to downstream backend services.
To speed up investigations, each launchpad includes built-in BubbleUp Anomaly Detection. It highlights the attributes most likely to be causing slow or failing experiences, so you can quickly focus your investigation.
Since Launchpads are fully integrated with the rest of the Honeycomb platform, mobile engineers can more easily collaborate with other teams. A few features that enable this include:
- Service maps to visualize how your mobile frontend connects to backend systems
- Query Assistantfor natural language exploration of your data
- One-click investigation sharing to bring teammates directly to what you’re seeing

What native mobile support unlocks
Let’s dive in and see a few of these new capabilities in action.
Diagnosing slow renders
In this example, we start with the Android Launchpad, observing some unresponsiveness in Android rendering. We identify the session IDs that are encountering the problem and use BubbleUp Anomaly Detection to discover that all of the slowest times are around a button click in the main activity. We then focus on a single session ID and use the Explore Data tab on the query tool to view all session interactions for a given Android user.

This is just one example of how Honeycomb for Frontend Observability helps mobile teams analyze slow or broken user flows from end to end. With full trace context, teams can go from symptom to root cause without guesswork.
View end-to-end traces
In another scenario, an engineer notices a spike in crashes in the iOS Launchpad’s Errors view. They filter by app version and OS to narrow it down, then click into a specific event. The full trace reveals that the crash occurs immediately after a navigation event, tied to a backend request that’s returning a 500 error.
Instead of guessing whether the issue was frontend logic, API behavior, or user error, the engineer sees all of it in one trace: the UI event that triggered the request, the service that failed, and the duration of every step in the call chain.
With this level of visibility, teams don’t just detect issues, they understand why they’re happening, how widespread they are, and which systems are involved.

And because Honeycomb for Frontend Observability brings mobile telemetry into the same platform as your web and backend observability, multiple teams can align around a shared view of system health and performance, reducing confusion, speeding up investigations, and improving collaboration during high-pressure incidents.
Get started today
Mobile is a core part of your user journey and deserves the same depth of observability as your web apps and backend services. Honeycomb brings mobile, web, and backend telemetry together, so your teams can stop stitching together data and start resolving issues with shared context, speed, and precision. There are no tradeoffs on depth, speed, or cost control.
Honeycomb for Frontend Observability, now with native mobile support, is available for Honeycomb Enterprise customers.
If you’re already using Honeycomb for Frontend Observability, the mobile and web instrumentation packages are available today. Check out the docs to get started with our iOS and Android SDKs, or reach out to our support team for hands-on help.If you’d like to learn more or see a tailored demo of end-to-end observability, book time with our team.
This post was written by Elsie Phillips and Ken Rimple.
RUM can leave questions unanswered.
Honeycomb for Frontend Observability doesn’t.
Want to know more?
Talk to our team to arrange a custom demo or for help finding the right plan.