OpenTelemetry Gotchas: Phantom Spans
At work, we use OpenTelemetry extensively to trace execution of our Haskell codebase. We struggled for several months with a mysterious tracing issue in our production environment wherein unrelated web requests were being linked together in the same trace, but we could never see the root trace span.

By: Ian Duncan

This guest post is written by Ian Duncan, Staff Engineer – Stability Team at Mercury. To view the original post, go to Ian’s website.
At work, we use OpenTelemetry extensively to trace execution of our Haskell codebase. We struggled for several months with a mysterious tracing issue in our production environment wherein unrelated web requests were being linked together in the same trace, but we could never see the root trace span.
For those who are unfamiliar with OpenTelemetry, it is a specification for an interface and implementation for logging, metrics, and distributed tracing. This allows you as a developer to instrument your code with a single API and then choose which backend you want to use to collect and view the data. For example, you can use the OpenTelemetry API to instrument your code and then use the OpenTelemetry Collector to send the data to a backend like Honeycomb, Jaeger, Datadog, LightStep… the list goes on. You can even send the same data to multiple backends at once!
In our case, we primarily use OTel to send data to Honeycomb, which I can’t recommend strongly enough. A typical trace looks like this:
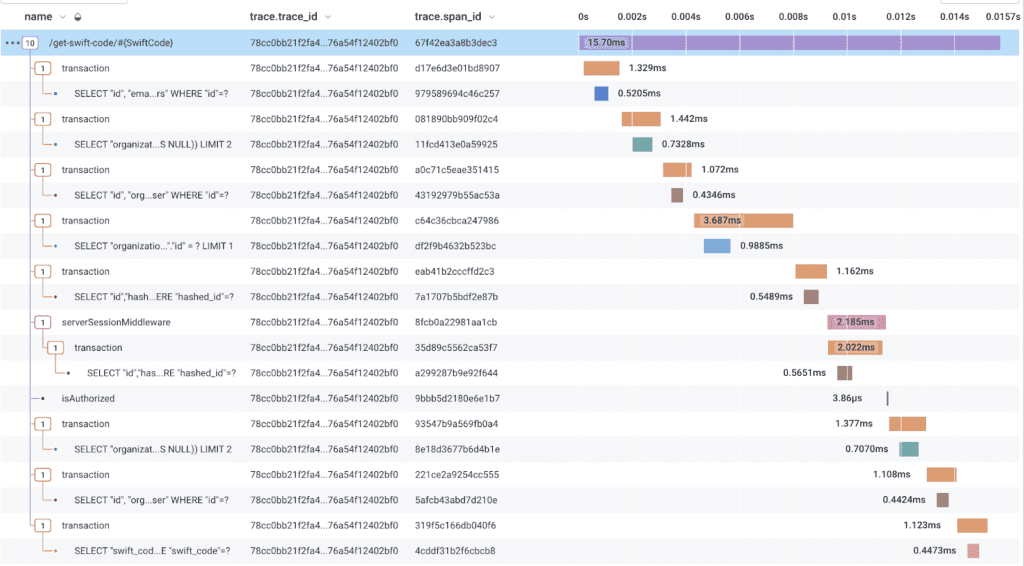
At the root, there is a span that represents the entry point into the trace. In this case, a web request to our backend. This span can initiate additional spans, which represent meaningful units of work that are part of the trace. In this case, the web request span initiates a series of PostgreSQL transactions, which in turn actually query the database. There are some other things—like an authorization check—that happen in between, but the important thing is that all of these spans are part of the same trace. This is what we expect to see. Most web requests that we serve respond in < 500ms, and have no more than a few hundred spans.
On the other hand, we’d periodically see abominations like this:

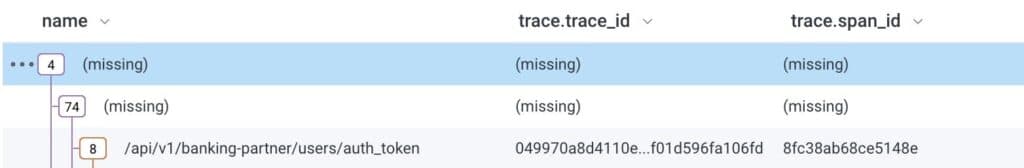
34,278 spans?!
Root Name: (multiple)
Yikes, ok. Let’s come up with some theories about what’s going on here:
Diagnostic hypotheses
- As author of the hs-opentelemetry library suite, I’ve done something terribly wrong and there’s a bug in the library that’s causing this.
- There are some spans that we’re creating (that we don’t intend to be part of the trace) that the web request span is picking up as parents.
- Something upstream of our application in our telemetry stack is doing something wrong.
- Something else. ( °д°)
Am I the bad guy? (AKA “Is hs-opentelemetry totally busted?”)
Let’s start by looking at the spans that were being created. We have a few different ways of creating spans in our codebase, but the most common is to use the inSpan function from hs-opentelemetry. This function takes a span name and a function to run, and creates a span with the given name that is a child of the current span. For example:
inSpan "getTransactionRenderData" defaultSpanArguments $ do
  DB.select $ from $ \transaction -> do
    where_ (transaction ^. TransactionId ==. val transactionId)
return transactionIn the trace waterfall, we’d see getTransactionRenderData show up as a span that is the child of a transaction span. The way that this works under the hood is extremely unusual for the Haskell ecosystem, in that it uses thread-local state to determine what the parent span is.
Why is this unusual? Well, because Haskell doesn’t actually provide a thread-local scope implementation! The typical tenets of purely functional programming dictate that we should avoid implicit state and unrestricted side-effects, and for most cases, this leads to code that is easier to maintain and reason about. However, there are some cases where it’s useful to have a bit of implicit state, and this is one of them.
Tracing is a cross-cutting concern that we need to be able to add to any part of our codebase, and we don’t want to have to pass around a SpanContext value to every function that we want to trace. Instead, we can use thread-local state to implicitly pass the current span context to any function that we want to trace. If you’re a Haskell programmer, you might be thinking, “But what about ReaderT?”
Well, consider the case where you want to inject instrumentation into a library that you don’t control. For example, let’s say that you want to trace all of the database queries that your application makes. You could use ReaderT to pass the current span context to every function that you want to trace, but you’d have to explicitly wrap every call that your database library of choice (like persistent) makes. Sounds like a solution, right? Mostly, but there are a few problems:
- You have to wrap every function that you want to trace, which is tedious and error-prone. Maybe the library you’re using adds a new function, and you forget to wrap it. Now you’re missing spans.
- Maybe a dependency of the library you’re using makes a database call. Since you aren’t wrapping the code in your third-party dependencies, you’re missing spans.
- You need further visibility into the steps your database library is making. Maybe you want to break down the time spent executing the query, returning the results, and parsing the results. You can’t do this with ReaderT because you can only wrap the entire function.
By using thread-local state, any underlying libraries that support middleware / interceptor interfaces can be wrapped to admit tracing without having to make breaking changes to the interface of the library. This is how we’re able to trace database calls, HTTP requests, and other things that we don’t control.
OK, so we’ve established that we’re using thread-local state to implicitly pass the current span context to any function that we want to trace. We’ve also established that Haskell doesn’t natively support thread-local storage. How do we reconcile these seemingly contradictory statements?
By doing sketchy things with the run-time system, of course!
The sketchy details
My initial thought when trying to build a thread-local storage implementation was that we absolutely needed our thread-local storage system to be garbage collected automatically. There were a few thread-local storage libraries on Hackage (the Haskell package hosting service) that required manually cleaning up storage from a thread when it was no longer needed, but asking OpenTelemetry consumers to do this seemed like a recipe for disaster.
Instead, I opted to try to use the Weak type from System.Mem.Weak to attach a finalizer to the thread-local storage that would clean up the storage when the thread was garbage collected. Unfortunately, I quickly discovered that the finalization function would fire too soon in many cases! GHC would cleverly unbox the thread reference, which would cause the finalizer to fire when the box was garbage collected, which was often immediate. This was a problem, because we needed the finalizer to fire when the thread itself was garbage collected, which could be much later.
Upon reading the docs for System.Mem.Weak.mkWeak, I noticed that the docs referenced a few special types that required special handling for similar reasons:
- IORef via mkWeakIORef
- MVar via mkWeakMVar
- TVar via mkWeakTVar
Unlike the regular mkWeak implementation, these functions allow you to attach a finalizer function to the underlying unboxed value, which will run when the unboxed value is garbage collected. This is useful for things like closing file handles, sockets, and other resources that need to be cleaned up when they’re no longer in use.
Well, I reasoned to myself, why can’t we also access the underlying unboxed value of a ThreadId, precious? Yes. No! No! It’s too risky. It’s too risky.
…but I did it anyway, and was pleasantly surprised to find that it actually works! The following code from the thread-utils-finalizers package demonstrates the technique:
mkWeakThreadIdWithFinalizer :: ThreadId -> IO () -> IO (Weak ThreadId)
mkWeakThreadIdWithFinalizer t@(ThreadId t#) (IO finalizer) = IO $ \s ->
  case mkWeak# t# t finalizer s of
    (# s1, w #) -> (# s1, Weak w #)

{-|
  A specialised version of 'mkWeakThreadIdWithFinalizer', where the 'Weak' object
  returned is simply thrown away (however the finalizer will be
  remembered by the garbage collector, and will still be run
  when the key becomes unreachable).
-}
addThreadFinalizer :: ThreadId -> IO () -> IO ()
addThreadFinalizer tid m = void $ mkWeakThreadIdWithFinalizer tid m

{-|
  Run a thread's finalizers. This is just a convenience alias for 'System.Mem.Weak.finalize'.

  The thread can still be used afterwards, it will simply not run the associated finalizers again.
-}
finalizeThread :: Weak ThreadId -> IO ()
finalizeThread = finalizeUsing this, a (simplified) thread-local storage falls out pretty easily:
-- Things that we want to store in thread-local storage, omitted here.
data Context = Context

threadLocalStorageMap :: IORef (Map ThreadId Context)
threadLocalStorageMap = unsafePerformIO $ newIORef mempty
{-# NOINLINE threadLocalStorageMap #-}

addContextToThreadLocalStorage :: Context -> IO ()
addContextToThreadLocalStorage context = do
  tid <- myThreadId
  -- delete the context from the map when the thread is garbage collected
  addThreadFinalizer tid (atomicModifyIORef' threadLocalStorageMap $ \m -> (Map.delete tid m, ()))
  -- add the context to the map
atomicModifyIORef' threadLocalStorageMap $ \m -> (Map.insert tid context m, ())This is the basic idea behind the thread-local storage implementation in hs-opentelemetry. The actual version does some striping to avoid contention on the IORef, but the basic idea is the same.
That was pretty tangential. How is this related to phantom spans in a trace?
The main concern I had, given that I was doing unsupported sketchy things to the GHC RTS primitives, was that somehow the thread-local storage was getting corrupted, and some span being created during the execution of a web request were being picked up as the parent spans of other web requests and never being flushed to Honeycomb as the root span.
Thankfully, this was not the case. I spent several weeks trying to reproduce the issue locally, but I was never able to.
Then I tried to reproduce the issue in a staging environment, but I was never able to.
Then I tried to reproduce the issue in production, but I was never able to.
I was starting to feel weak, powerless, and like a fraud—we were still seeing the issue in production despite nobody successfully reproducing the issue on purpose.
Fortunately, we had a breakthrough
As I was looking at a trace that demonstrated the issue, I noticed that all of the web requests that were being linked together incorrectly were all being initiated from the same IP address. This was a clue! I had previously assumed that the issue was some eldritch bug in the thread-local storage implementation, but this new information tickled my memory of an OpenTelemetry concept known as propagators.
At the heart of the OpenTelemetry tracing specification is the acknowledgement that modern systems are often composed of many different services, queuing systems, and other components that are all involved in processing a single request. In order to trace a request across these different components, we need to be able to propagate information about the current trace across these different boundaries so that we can visualize the entire trace across all of the constituent parts. This is where propagators come in.
Propagators provide a mechanism to serialize and deserialize the current trace context into things like HTTP headers or other metadata fields on messages that are passed between services. The OpenTelemetry specification provides a few different propagators out of the box, but the default one is the W3C Trace Context.
The W3C Trace Context propagator denotes two headers that, when present, indicate that the request is part of an existing trace.
- traceparent – contains the trace ID, span ID, and trace flags
- tracestate – contains additional metadata about the trace
Remembering that these headers would be picked up by the OpenTelemetry middleware, I had the dawning realization that business partners integrating with our APIs were sending requests with these headers set, and that the OpenTelemetry middleware was picking their trace context up as the parent of the request that we were serving. The reason that we were never able to reproduce the issue, even in production, was that we weren’t sending requests with these headers set. We were only seeing the issue when our business partners used W3C Trace Context headers for their own tracing purposes!
The fix
The fix was pretty simple. We don’t want to treat these headers as valid when they originate outside of our own infrastructure, so we set up some rules to delete traceparent, tracestate, and baggage (another bit of OpenTelemetry arcana that I’ll skip for now) headers as they passed through Cloudflare. This way, we can still use W3C Trace Context headers for our own tracing purposes, but we don’t have to worry about them being picked up as the parent of unrelated requests.
Aside from making our traces usable, this also closes a vulnerability. When we trust these headers from external sources, it is possible for an attacker to effectively perform a denial-of-service attack on our tracing infrastructure, making a number of our queries and alerting systems untrustworthy. By deleting these headers, we ensure that engineers can trust the data that they’re seeing in our tracing infrastructure.
If you’re experiencing an issue like this, I hope you found this blog helpful! As I said above, I can’t recommend Honeycomb enough—and you can try it today for free!
Want to know more?
Talk to our team to arrange a custom demo or for help finding the right plan.