What Are Traces? A Developer’s Guide to Distributed Tracing

By: Rox Williams

Everything You Ever Wanted to Know About Distributed Tracing (But Were Afraid to Ask)
Learn MoreOne of the most common challenges in modern software engineering today is understanding how requests flow through applications. As system architectures shift to favor widely distributed, cloud-native designs, keeping track of how an application processes user actions is more difficult than ever. A single user action may trigger events processed in dozens of backend services. Traces are helping software developers today with this challenge. They tell the story of a request, describing where it starts, where it went, how long it took, and if anything went wrong.
In this post, we’ll describe what traces are, how they work, and the value traces provide in observability, helping stakeholders understand their systems and delivering reliable services at scale and performance.
The second edition is here!
Grab your free copy of Observability Engineering
and learn the foundationals of observability
from the experts.
What is a trace?
A trace represents the journey of a single request through various components, such as microservices, within a distributed system. It provides a time-order record of each operation performance as part of that request. Traces can be thought of as a detailed timeline of what happens behind the scenes when a user clicks a button or an API is called. OpenTelemetry (OTel) is a popular observability framework for generating, collecting, and exporting trace data. As the successor to both the OpenCensus and OpenTracing implementations, OpenTelemetry simplifies instrumentation across a range of programming languages. We recommend collecting distributed tracing data from across your stack using OpenTelemetry.
Anatomy of a trace
Each trace is composed of multiple spans. A span represents a single operation of work within the lifecycle of a request. For example, spans can present an API call, database query, or function execution. Each span contains metadata including timestamps, the operation name, and other relevant context. Context propagation stitches spans together into a single trace. Let’s discuss how this works in further detail.
What is a span?
A span is a named, timed operation representing one step in a request’s journey. A trace always has a root span, typically the entry point of the request, and often has many child spans that describe sub-operations like database queries or service calls.
Span attributes and events
Spans include structured metadata:
- Attributes: Key-value pairs that specify data for keys like
user.id,http.status_code, orregion. - Span events: timestamped messages (with optional attributes).
- Status: Indicates whether the operation succeeded or failed.
- Span links: Allow references between spans not directly in a parent-child relationship.
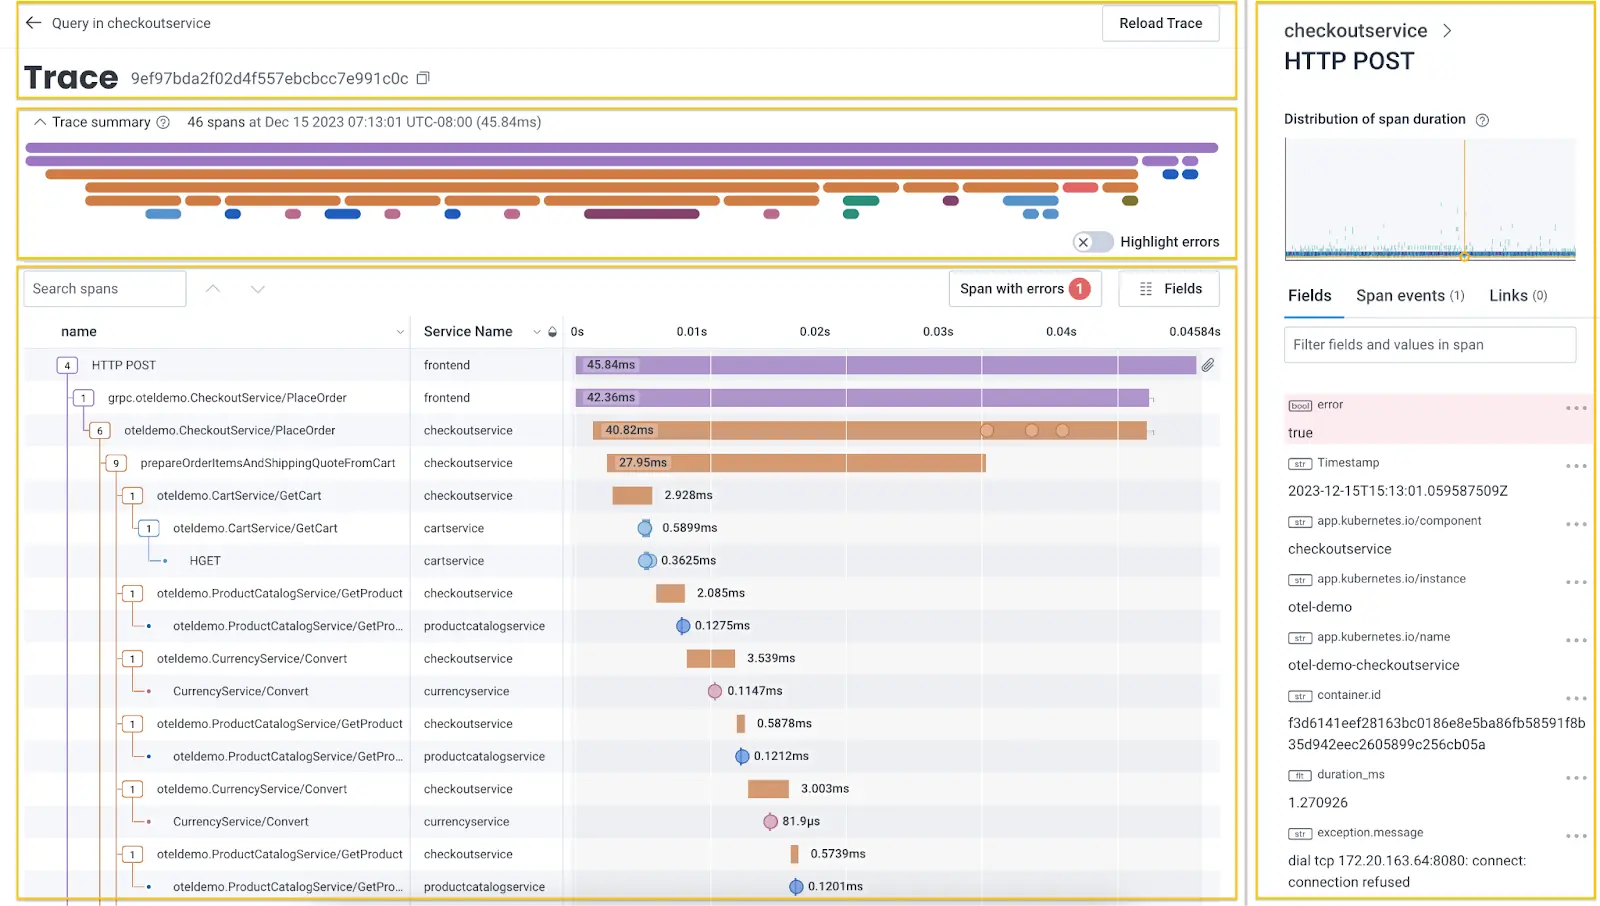
When visualized, a trace appears like a waterfall chart, showing the entire lifecycle of a request from service to service. Distributed tracing tools let you zoom in on spans to pinpoint performance issues or failures.
What is propagation?
Propagation is the mechanism that allows context, such as span and trace ids to travel across service boundaries. Without propagation, each service would create independent traces, making it harder to follow a single request as it flows through a system. Propagation ensures that trace context is passed along, usually via headers in HTTP or metadata in message queues, so child spans can be linked to their parent spans properly.
For example, when a user request hits a frontend service and triggers calls to multiple backend services, propagation ensures that the trace context flows from the frontend to each backend, allowing every span to be connected in the same trace. This is what makes up an end-to-end picture of a request across microservices.
Popular propagation formats include W3C Trace Context (used by OpenTelemetry) and B3. Most OpenTelemetry libraries handle propagation automatically, but it’s important to ensure the tracing implementation in your services is configured to extract and inject context properly.
Tracing vs. logging vs. metrics: when to use them?
Traces, logs, and metrics are most powerful when used together. In general, you can use these signals for the following purposes:
- Use traces to provide context for what happened during a specific request.
- Use logs for data at specific points in time or when traces aren’t available.
- Use metrics to understand system health over time.
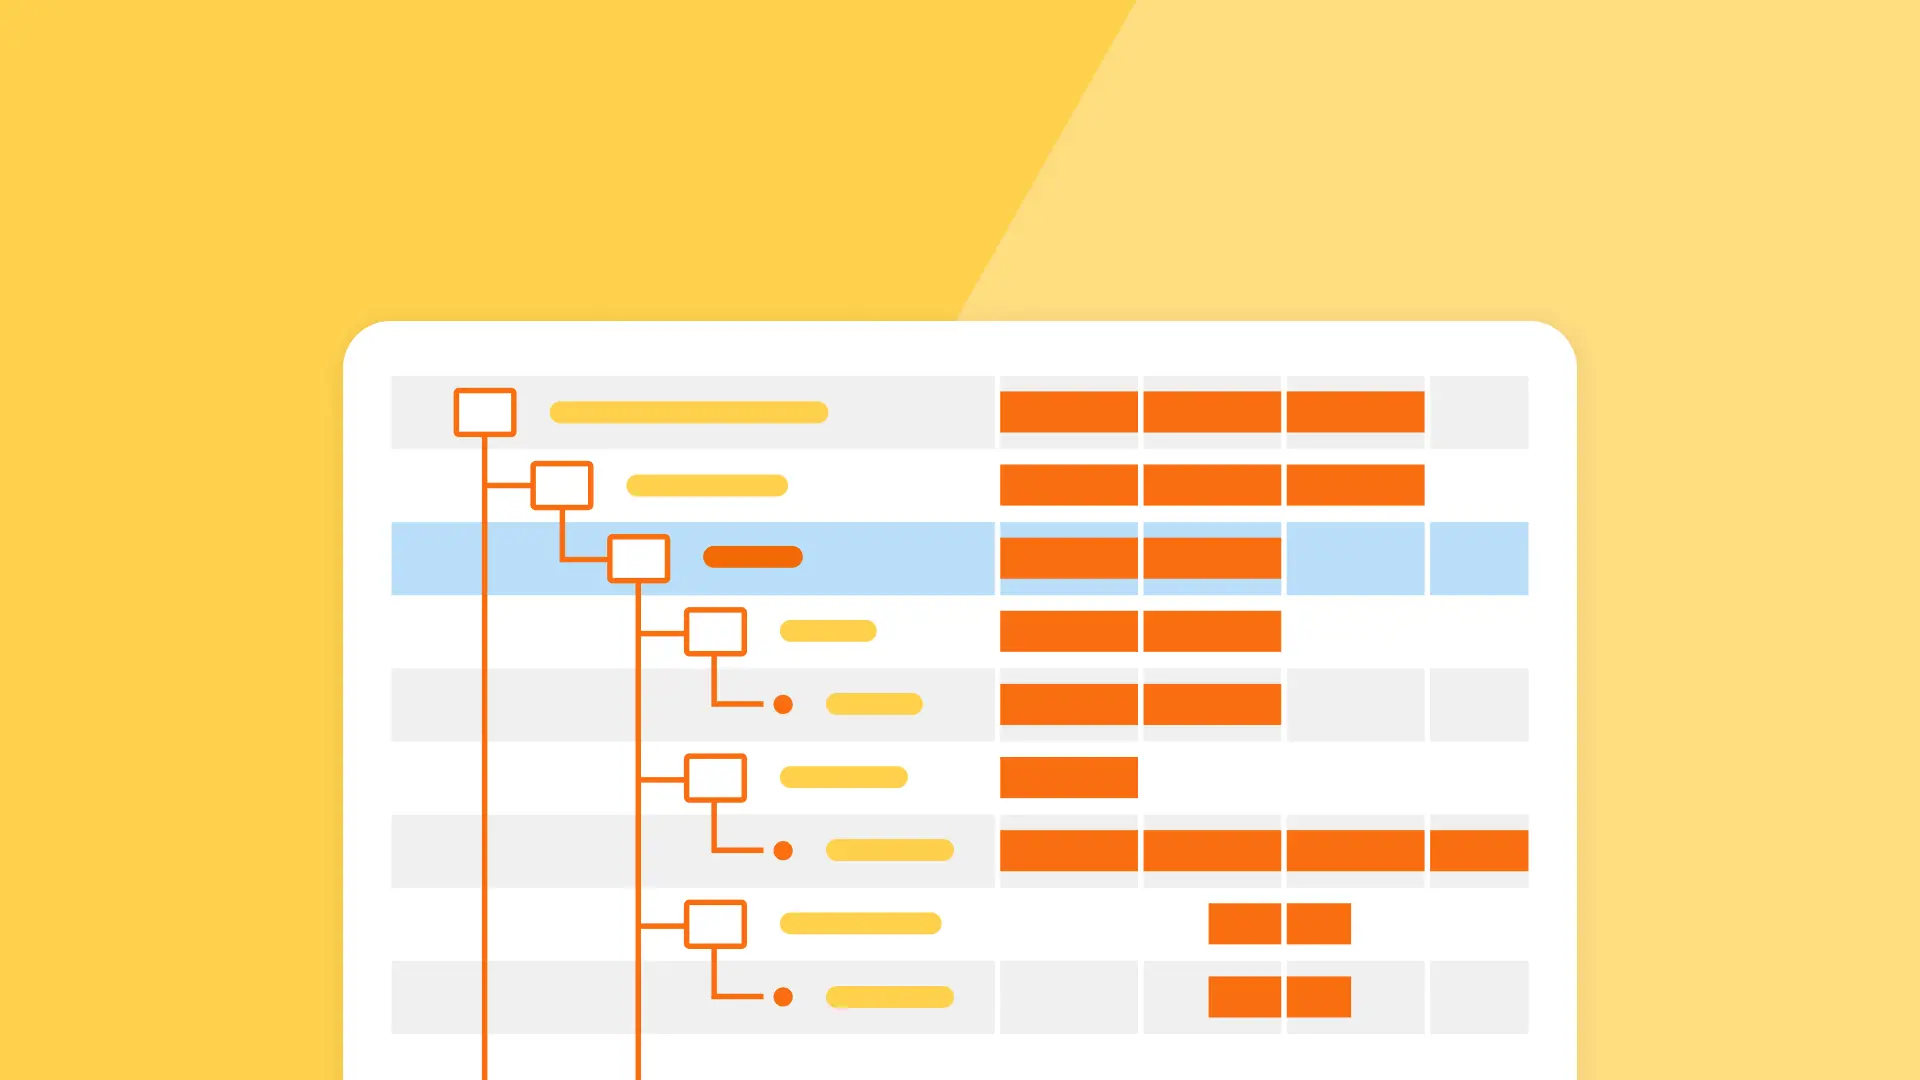
Here is a table to understand when to use tracing vs logging, vs metrics.
What is a good trace, and how can it be used with other signals?
A good trace tells a rich, detailed story of a request as it flows through your system. When paired with logs, traces can show you the exact events that led to an error, giving you both high-level and low-level details. The trick is that with good trace you can use them to understand system-wide trends, set meaningful alerts, and define and monitor SLIs.
We showcase several examples of good traces and how they’re used in our blog. By combining traces with logs and metrics, teams can respond, plan, and observe better.
Why traces matter
Traces give engineers something that logs and metrics often can’t: context across services. They’re especially useful for:
- Debugging distributed systems: Follow a request through multiple services to find where something went wrong.
- Identifying performance bottlenecks: See exactly which span is slowing down a request.
- Understanding user impact: Correlate performance issues with specific users, geographies, or devices. You have control over metadata for your traces.
Distributed tracing brings teams together. Instead of looking at separate logs, teams can look at one connected trace, letting teams see their systems in new and insightful ways.
Getting started with tracing
Here is a simple step-by-step guide for getting started with distributed tracing.
1. Choose what to trace first
Start tracing high-impact paths, like:
- user-facing API endpoints,
- a service that often experiences performance issues,
- or any complex requests that interact with multiple services.
2. Instrument your code
Use the OpenTelemetry SDK to instrument your services and ensure that every service involved in the request flow is instrumented. Otherwise, context propagation will be broken and won’t have a complete trace, making it difficult to diagnose issues or understand end-to-end performance.
3. Use auto-instrumentation where possible
Auto-instrumentation plugs into existing application frameworks to automatically generate the spans needed for tracing requests. Many frameworks and libraries, such as Python, Flask, and Spring, offer auto-instrumentation support, including context propagation. You can reduce engineering effort by leveraging auto-instrumentation where possible.
4. Set up a Collector (optional)
When you instrument your applications using tools like OpenTelemetry, the data generated neds to be sent somewhere. Use the OpenTelemetry Collector to receive and forward your trace data to your observability backend. An observability backend is a system or platform that collects, stores, processes, and visualizes telemetry data like traces, metrics, and logs.
5. Analyze and visualize
Send trace data to a backend platform that supports visualization, filtering, and analysis.
Advanced tracing techniques
Advanced tracing techniques help teams go beyond seeing request flow across services. You’ll want to leverage more advanced techniques to optimize observability tracing.
Trace analytics
Trace analytics lets you ask complex, high-level questions about your system using trace data. Instead of looking at individual traces one by one, you can aggregate them to understand patterns across thousands or millions of requests. This approach can be more helpful for answering questions like:
- What endpoints have the highest tail latency?
- What percentage of user requests are slow by region or device type?
- Where do retries or timeouts most commonly occur?
These questions are easier to answer with traces than application metrics, which are limited in cardinality and constrained by fixed schemas. With tools like Honeycomb, you can group, filter, and break down traces by attributes like user ID, request path, build ID, or feature flag, and then aggregate metrics from them to answer these questions in real-time.
Trace filtering and sampling
As your traffic grows, so does your trace volume. Trace filtering helps you zero in on what matters. For example, you can use trace filtering to search and analyze the most relevant traces. If you are debugging an issue, you can filter for error requests or slow responses while excluding high-volume noise like successful health checks. Combined with trace filtering, sampling ensures you’re not just collecting traces, but that you’re collecting the right ones.
- Tail-based sampling enables the retention of traces after evaluating their contents.
- Dynamic sampling adapts your sampling rules based on traffic shape and volume, giving you the highest signal-to-noise ratio.
Honeycomb Refinery’s tail-based sampling capabilities are one way to manage high volumes of tracing as you scale
High cardinality and context-rich tracing
High-cardinality fields (such as user ID or session ID) can often be challenging to analyze in observability backends. However, they’re exactly what is needed when debugging unpredictable or one-off issues. Here are some examples of queries that illustrate the uses of high-cardinality fields:
- “Show me all slow queries for user ID 12345.”
- “Break down request latency by feature flag state”
Capture and analyze high cardinality fields to correlate context-rich trace data with system behavior and user experience.
Service maps and span visualizations
Visualizing how everything connects is essential in systems with dozens or hundreds of services. Service maps and waterfall diagrams built from trace data give you a bird’s-eye view of dependencies, flow, and latency. You can detect architectural regressions, redundant hops, unnecessary fan-outs, and critical path latencies with service maps and visualizations.
Tracing smarter with Honeycomb
Honeycomb is an observability platform that has the tracing visualization and search needed to help you analyze trace data precisely. Many APM tools aggregate data into coarse summaries, but Honeycomb preserves per-event granularity so you can ask detailed questions and get answers without guessing.
This blog post shared helpful information about microservices tracing, including how to get started with tracing using OpenTelemetry. If you’d like to learn more, we have an OpenTelemetry best practices blog.
Honeycomb’s observability platform has seamless OpenTelemetry integration, fast and flexible querying, service maps and trace waterfall views, trace sampling and retention policies to reduce noise, and integration with metrics and logs. Ready to level up to a 5-star OTel setup? Read our observability best practices guide to build a stack that works for you.
Get your free copy of Charity’s Cost Crisis in Metrics Tooling whitepaper.
Learn more about metrics, cost control measures, cardinality, and more.