What Does a Good Trace Look Like?

By: Rox Williams
At Honeycomb, we’ve made a name for ourselves in distributed tracing—and as such, we’re often asked what a good trace looks like. It’s not an easy question to answer, because everyone’s application is different and the user experience changes drastically from one application to the next.
Any generic trace can answer how slow a request was or when the first error occurred. We want better than generic tracing though—we want good tracing, because we want to know which customer had a slow experience, which account had fraudulent levels of activity, or which product keys returned errors. The theme here is we want specifics. And while we may not be able to tell you exactly what fields to put in your traces, we can give you general philosophical advice on what a good trace looks like.
The characteristics of a good trace
Good traces should:
- Clearly and concisely describe the execution flow of a single request or action
- Enhance or improve the mental model of new and experienced engineers alike
- Include all the industry-standard fields from automatic instrumentation
- Include lots of custom fields specific to your application
- Not have significant gaps in the timeline
- Disregard “noisy” spans that do not lead to a better understanding of what is happening
- Include noisy spans that express behavior. If your app made a thousand DB calls, you should fix that—not hide it from traces
Additionally, it’s important to note that the “shape” of your traces can vary—there’s no standard there, so to speak. A good trace can have thousands of spans or less than ten. It can span multiple services or describe a monolithic app. Anything goes, as long as it benefits your context/use case.
Traces tell us a story about a user or process’ experience going through the functions of our application. If we’re trying to tell a story, we want more than the bare minimum of information about the context of the story. When we see an interesting event, we want to know what makes it distinct from—and what it shares with—the uninteresting events around the same time. This needs to include “how we got here” and “what happened next.”
An example—using art, of course
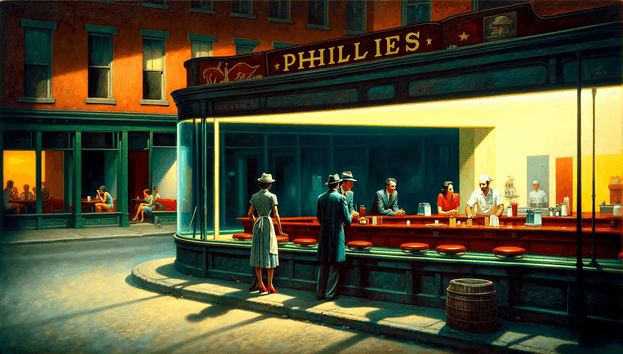
For illustrative purposes in this post, I’m going to use Edward Hopper’s famous painting Nighthawks:

This is a pretty well-known painting. I can easily find it with its name, or by looking up the artist. This is like having a request ID for a trace or log event. Searching for that specific ID will get me that event or trace precisely.
If I’m cataloging this painting, I can describe it as such: “Painting of a building on a street corner.” While this description is accurate, it may not be enough to turn up in our search results when we’re looking for it later. This is similar to the amount of detail we see when we only use automatic instrumentation in our trace data.
We need to provide more context. Using a more detailed description not only helps us find this painting in our catalog more easily later, but allows us to understand things we like about this painting that we can use when searching for other paintings that might appeal or interest us.
Think of this description: “Painting of a corner diner, Phillies, portrayed late at night in a city, with large windows showing us a brightly lit interior. A man in a blue suit and hat and a woman in a red dress talk to a server behind the counter while he goes about his tasks. Meanwhile, another man in a gray suit and hat sits alone on the other side of the counter.”
If you put this into ChatGPT, you’ll probably be surprised at how close it gets to the original painting:
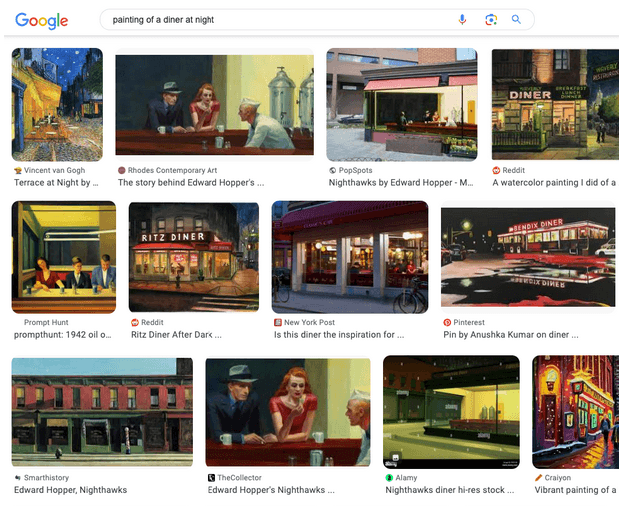
If we’re just doing a search for similar entries in our catalog, we can use a shorter description, like “Painting of a diner at night” to see what comes back:
The amount of detail we put in the descriptions of our traces is just as important as when we describe the real world around us. With custom attributes and high-cardinality descriptive fields, we turn the bare facts of a trace into a vivid story of our users’ journey.
Traces should describe application events as richly as possible
When we describe how we process our applications with traces, we want the same richness of context so that we can then look at correlations between traces that share similar high-fidelity data. As an example from our own tracing of Honeycomb, here’s a query that looks at users of Honeycomb who send data via Refinery 2.X. There are many descriptors in the WHERE statement to narrow down the kind of data we’re looking for:
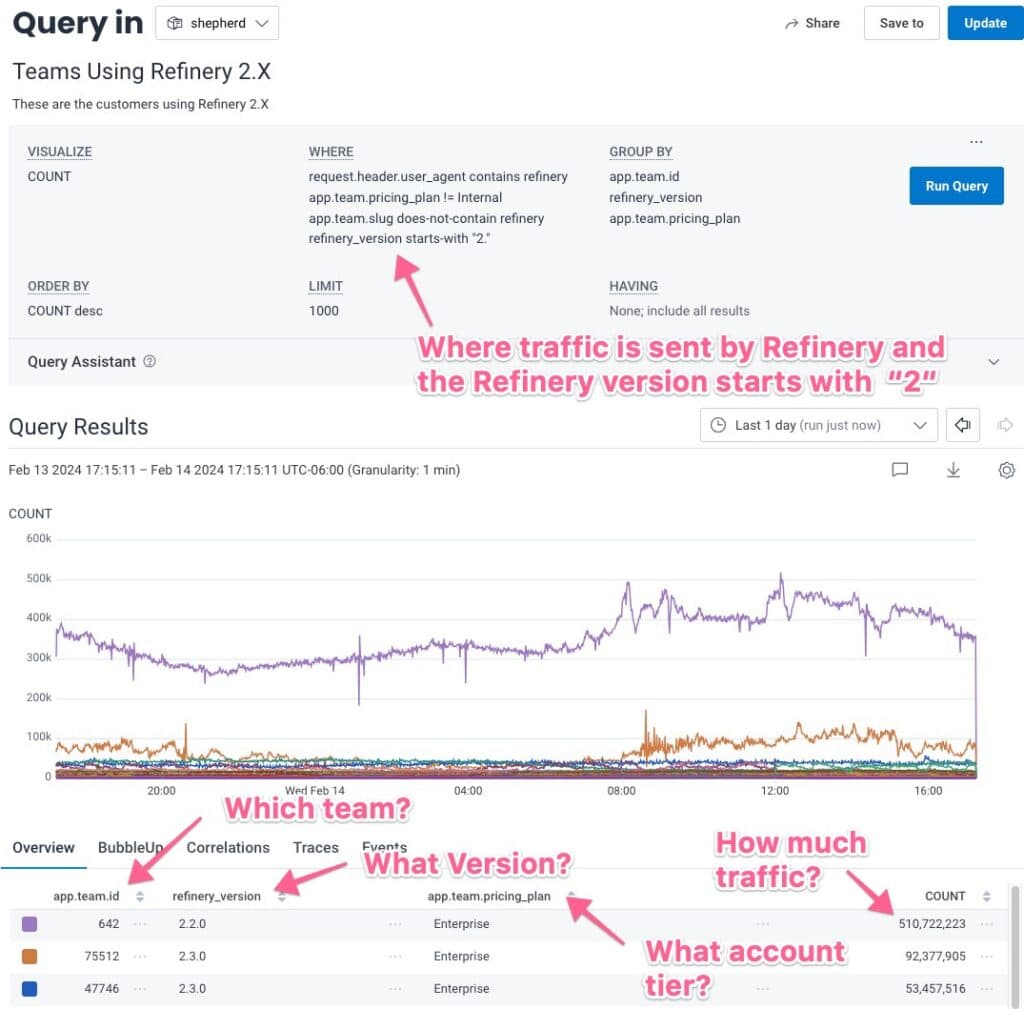
Having the descriptive data that we do in the telemetry we collect from the Honeycomb product allows us to build more complex queries so that we can narrow down the root cause of issues, see how specific customers interact with our product, or see where our product isn’t providing the user experience we want.
Seeing correlations in BubbleUp
Luckily, we can narrow down those issues with tools like BubbleUp, which relies on rich data to find correlations between attributes we’re investigating and other attributes that stand out in conjunction with the original attribute value.
For example, below we see error messages in the http.response.status_code field:
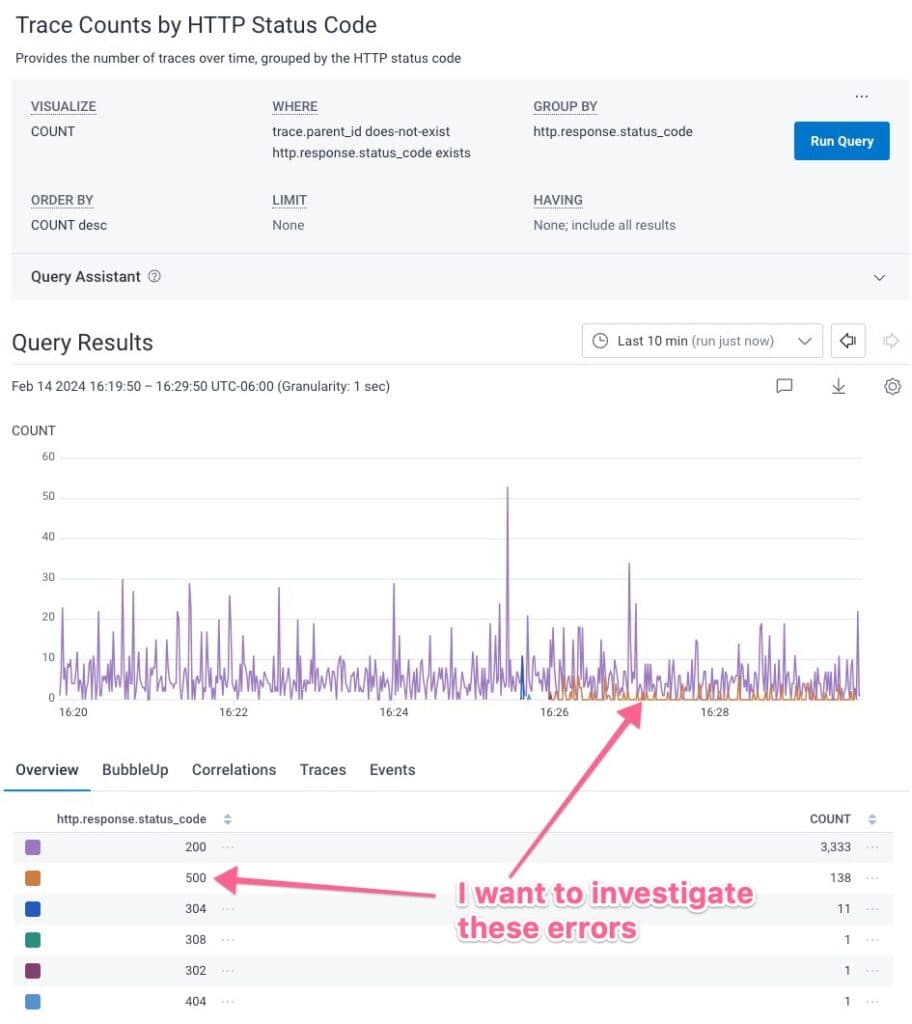
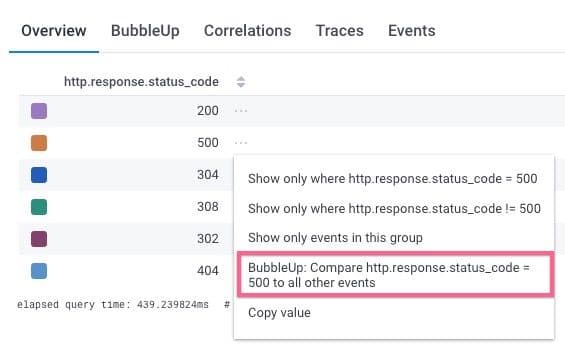
Having more attributes in that data allows us to use BubbleUp to see what attributes match when we get those 504 errors:
BubbleUp looks at all the attributes on these 504 events and compares them to the events that didn’t 504. Each attribute that looks different gets a little bar chart: yellow is the 504 errors, dark blue is everything. The chart highlighted below shows me that 100% of my 504 errors come from a loadgenerator service:
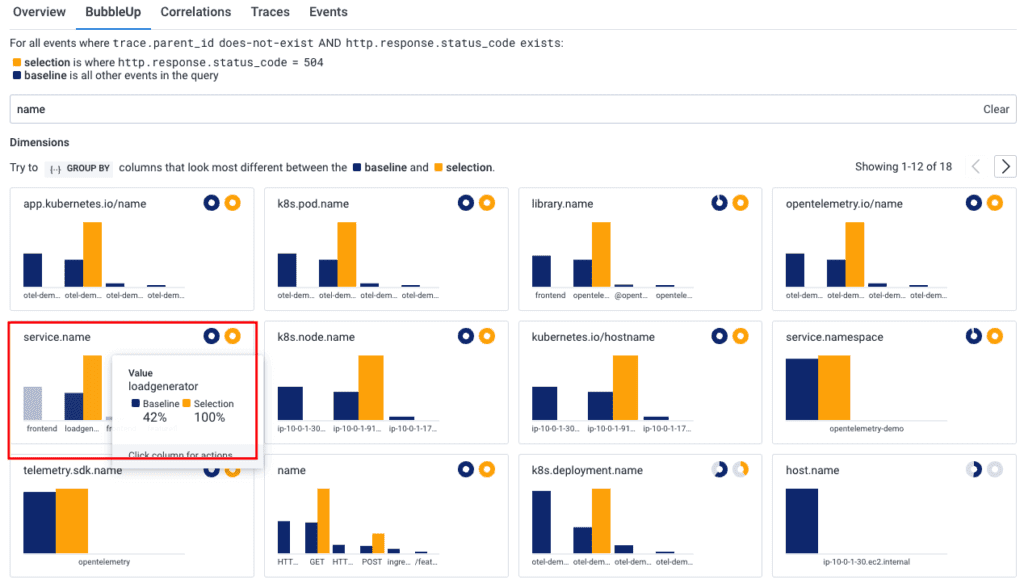
Having service.name attached to my trace data allows for that correlation. The more attributes we have, the more we can use BubbleUp to quickly find these correlations.
Automatic instrumentation is a great starting point, but it is just the beginning
OpenTelemetry auto-instrumentation allows us to quickly add tracing to our services to get basic insights into how our processes work, and allows for distributed tracing when instrumented services communicate with each other via HTTP or GRPC. Most of the time, setting up auto-instrumentation is a simple, painless process and can get you some useful insights—very quickly.
However, it should really just be the starting point. Auto-instrumentation will start new spans with a new network request, or when using new middleware or a database that has libraries. If you’re using the appropriate libraries, it can pull some information from HTTP or DB requests and get some insights into the data being passed, which it can add to the span as attributes. It can see when some exceptions happen and put that information into span events to help you find and debug errors that are occurring. All of this is useful.
But automatic instrumentation doesn’t know what the purpose of the application is. It doesn’t know what aspects of the application distinguish this experience for users. It doesn’t have any idea where the current service fits in the overall architecture of applications in your ecosystem. Things that you can add to tell these spaces are things like Customer, User, or Account ID; order information like Size, Product IDs, Cost, or Price; feature flag information; responsible development team for the service; Build ID; and the name of the corner diner the customer is at.
Custom instrumentation makes traces shine
With automatic instrumentation creating a few spans and propagating context, it’s important to capture intent and outcomes as attributes. This is the difference between “web request failed” and “user was prevented from giving us money.” The first may be a good outcome if the user is trying to access a forbidden feature. The second is obviously a problem and needs to be addressed as quickly as possible.
There is such a thing as too much detail
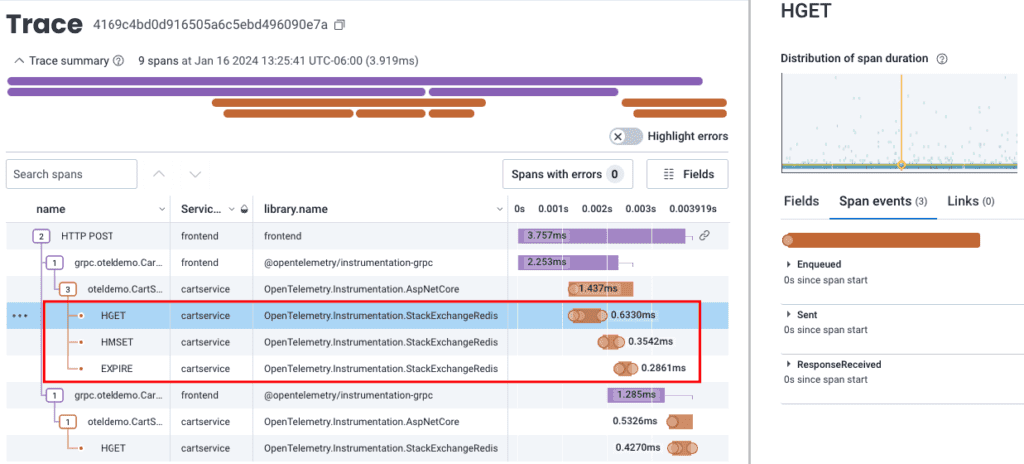
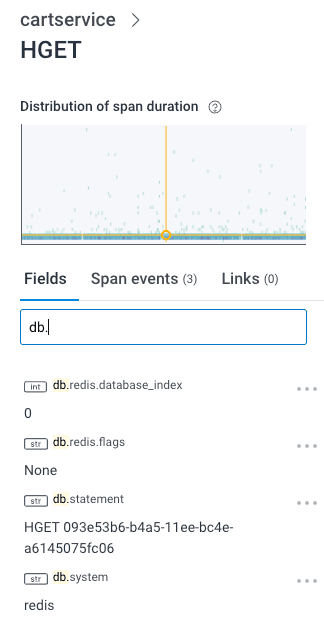
Sometimes automatic instrumentation is less useful, and it’s just noise that costs money and provides little value. Some services like Redis and DynamoDB emit spans that are helpful in achieving peak performance but add little value when the systems are not stressed. Automatic instrumentation for some of these libraries can create new spans for every function of every database call, meaning that one cache lookup might be multiple spans saying “connect to cache,” “query the cache,” “get result from cache,” “close connection to cache.” Beyond that, you can get multiple span events for each of those calls. It can overwhelm a trace with data, but that data might not be as useful as a single span, with several attributes telling you the same thing. It’s also expensive.
This auto-instrumentation of one Redis transaction has twelve total events, each with very little data from the application:
The good news about these noisy library-specific auto-instrumentation problems is that they can be solved at runtime using environment variables for most languages. Not to pick on Redis, but the Ruby OpenTelemetry library supports OTEL_RUBY_INSTRUMENTATION_REDIS_ENABLED=false as an environment variable so you can turn it off in production, or turn it back on if Redis seems to be struggling. Java and Python have similar patterns. In Node, everyone turns off the filesystem instrumentation in the code that configures OpenTelemetry.
Sometimes, to get the most value, we need to take the time to make sure we’re sending the best data in the best ways possible. This is done by adding custom instrumentation to the auto-instrumentation, and in some cases, replacing the auto-instrumentation altogether.
Are traces a ‘pillar?’ We think not.
People often think about traces as a “new” type of monitoring. You will see a lot of industry talk about the “three pillars” of observability. At Honeycomb, we tend to believe that this is nonsense. We believe in queryable events rich in attributes, especially when they tie together into traces, giving you an understanding deeper than “three pillars” could ever provide.
Metrics are often a mechanism of aggregating data that you could gather from the information in a trace. If you leverage tracing in your applications and your spans have a duration, then you don’t need an aggregated metric of HTTP request duration, because you can do the aggregate as a query against your trace data. Many of our customers add CPU and memory metrics as attributes to their spans, and then don’t need separate metrics for those either.
Logs are a mechanism of outputting highly descriptive information about what your application is doing. If you think of traces as pre-correlated logs, you quickly realize that you can just put those log statements in your traces as attributes or span events and you have the same information that you wanted to get out of your logs, but they’re now correlated with your other log messages around a single request of your application.
Traces, in actuality, are all you really need
Traces can provide all of the valuable information about your system that you might want to record. With Honeycomb, there’s no extra cost to adding attributes to the spans of your trace, so you can add a lot of valuable information:
- More description about your UI user events (what they clicked, their screen size, their accessibility settings, etc.)
- Feature flags being enabled or disabled
- Build version of the current application
- Detailed response data coming from downstream services (like the full prompt of what was sent to an LLM)
- Application metrics (memory usage, garbage collection count, database pool usage, etc.)
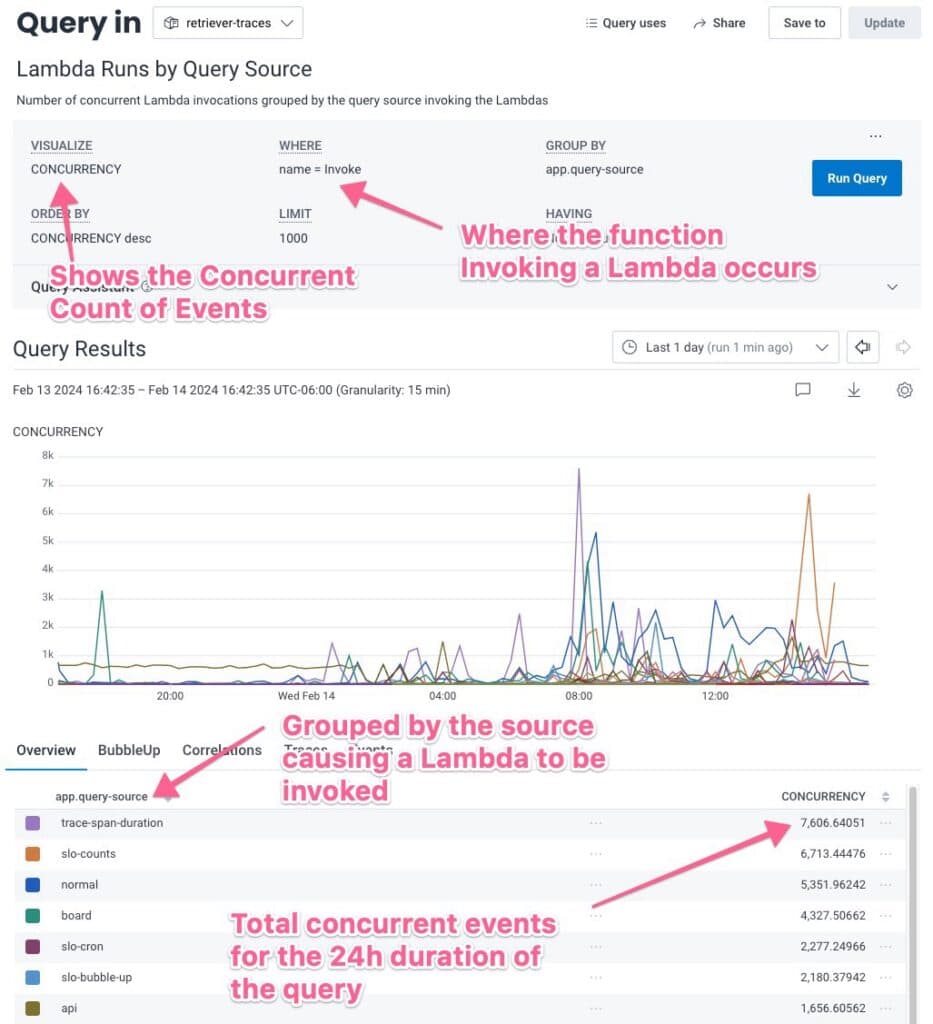
Below, we’re able to find out what generates the majority of our Lambda traffic because we’ve added the query source as an application attribute on our traces.
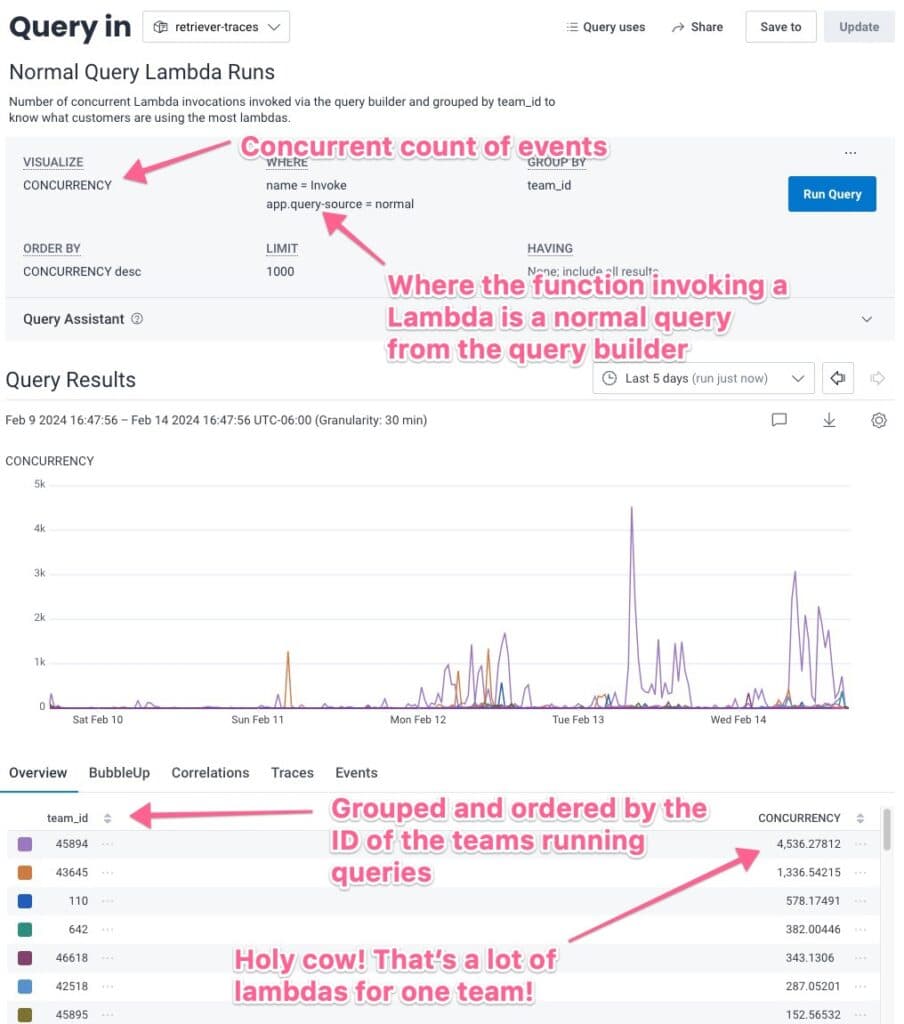
Looking at the results, I might want to figure out which accounts run the “normal” queries (using query builder) using the most Lambdas. We can see that some teams use way more queries than others:
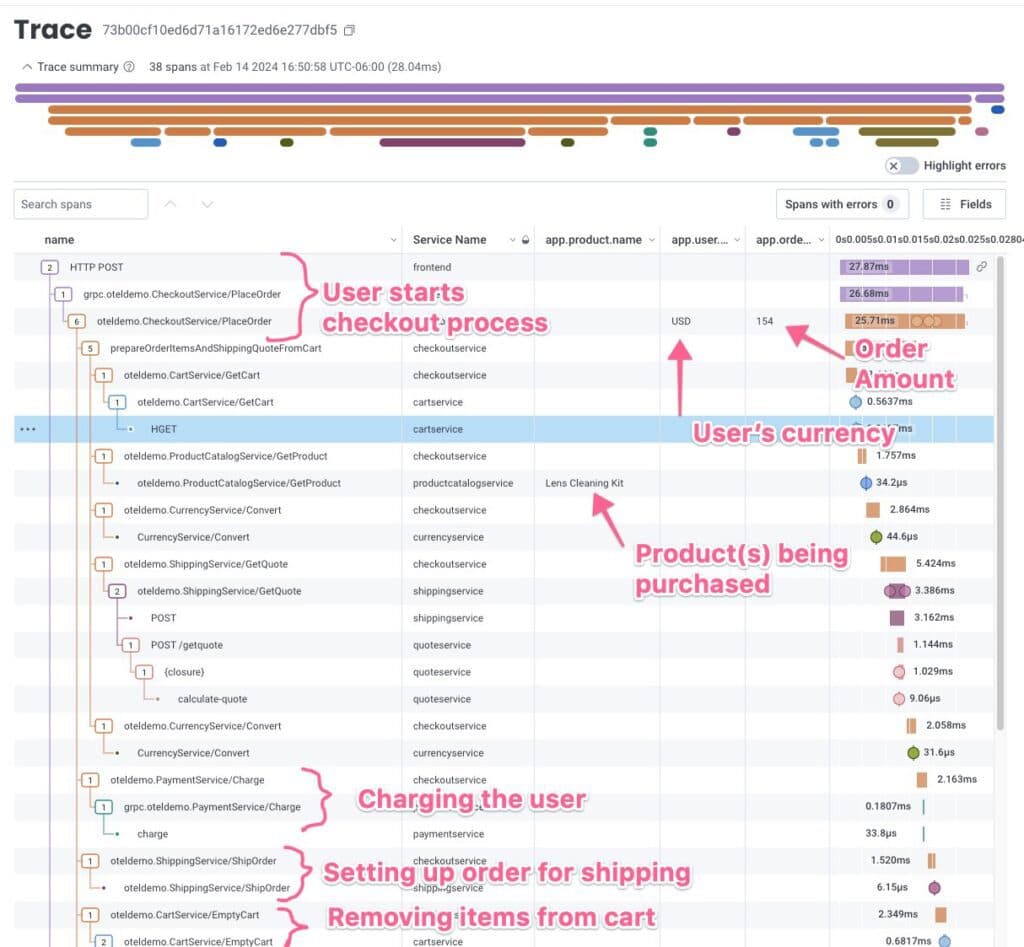
Traces should tell the story of your users’ journey in your application
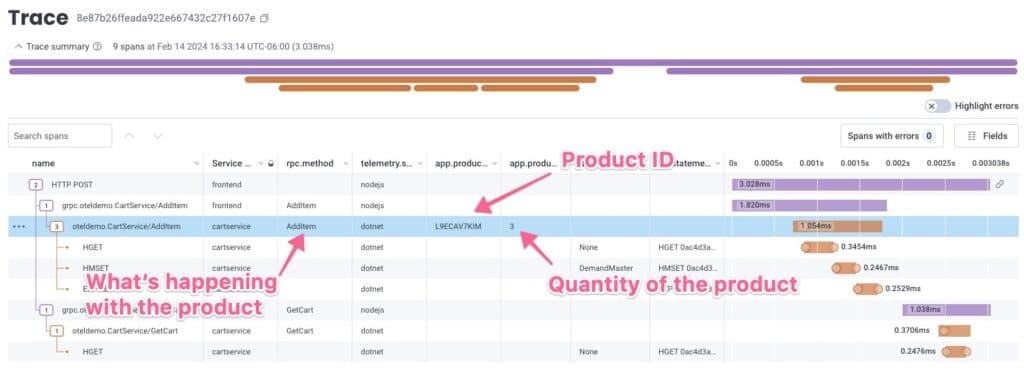
With all the right attributes in all the right spans, a troubleshooter or support person should be able to query by product ID to find a trace, look at it, and orient themselves to the problem quickly.
A trace allows us to start as close to the beginning of the user journey as possible. If you’ve instrumented your frontend browser code, you can see traces start when the user loads your website, and then watch the process as it traverses to the backend infrastructure of your application. Instrumenting the browser can be difficult (not for much longer!), so a lot of us just implement the backend infrastructure of our applications. This still gives us a tremendous amount of insight as we can see our users’ journey through that part of our application—from the moment the browser or app starts making calls to the backend.
Once the trace starts, it’s important to ensure that your major units of work in your applications are represented within your trace. Creating new spans for new functions is usually the best path forward, but we recommend sticking to the functions you need to see happening. Every iteration of a for-loop is probably not going to provide value as a new span, but the count or results of that for-loop will provide for good attribute data on the parent function containing the loop.
Any important application context should be a span attribute. Results and counts from looping processes can help you know if you’re inefficiently looping over data. Storing the state of relevant feature flags and build IDs will allow you to see things like the impact of A/B testing in your application. When making calls to the API of another service or a database, you may want to store more detailed response information for better service interaction awareness. Putting these things in place might take a minute, but when you’re trying to dig into an issue, you don’t want to have to manually correlate metrics and logs with specific user actions and piece it together: you want all that information right in your trace so you know what’s happening. It prevents “my logs vs. your logs” arguments with other teams, because you’re all looking at the same trace.
Your traces should try to follow the entire process of the user experience from beginning to end. This is not always possible, but the more you can follow a user from one service to the next, and see the context of their journey, the more quickly you’ll be able to discover the cause of the problem—or find inefficiencies in the process that can be improved.
Building an application isn’t easy. Neither is good tracing.
Traces look different for every application, as every application provides a different function. Even applications doing similar tasks may do them in very different ways. Creating a clear set of rules of what a “good” trace looks like is difficult. If you remember that the goal is to make it easier for any engineer to look at the data and understand how your application responds to a user, you should be on the right path.
This is an iterative process, and will never be exactly right the first time. Just as we iterate over code to improve it, we iterate over our telemetry to help our code paint a more and more detailed picture.
The easiest way is to try it out.
Want to know more?
Talk to our team to arrange a custom demo or for help finding the right plan.