An Observability Guide From Someone with a Precarious Grasp on the Topic
I’m Phillip, a product manager here at Honeycomb. After eleven-ish months of working on our product, I totally understand observability, right? …Kinda? Sorta? Maybe? I’m not sure—but, I have been sitting in this space…

By: Phillip Carter
I’m Phillip, a product manager here at Honeycomb. After eleven-ish months of working on our product, I totally understand observability, right? …Kinda? Sorta? Maybe? I’m not sure—but, I have been sitting in this space long enough to be a little better than clueless. Here’s my guide on the topic. I hope it helps, especially if you’re passionate about exploring alternative ways you or your team can manage today’s cloud-native applications.
There are way too many words and concepts involved
There is a serious word soup problem with observability. How do people live like this?
- Distributed tracing – A technique to “trace” how requests flow through a system
- Metrics – Aggregate measures tracked over time
- Logs – Random stuff from your running app, perhaps structured, exported somewhere
- Observability – Monitoring for hipsters
- Monitoring – Observability for boomers
- APM – Install an agent somewhere, it automatically generates data, and you get to look at pretty charts of that data
- Infrastructure monitoring – APM but for not your app
- Performance monitoring – Same thing as monitoring, but it has “performance” on it so it’s fancier
- AIOps – Poorly correlating values across different data sources for you, and sometimes getting it right
- DevSecOps – Something to do with security and DevOps
- Alerts – Having a computer yell at you when something is wrong
- SLOs/SLIs/SLAs – A bunch of three letter acronyms that have something to do with service health
- Reliability – Stuff shouldn’t break
- Dashboards – Look at pretty graphs on the internet
- OpenTelemetry (OTel) – Generate Observability data and shop it around with different vendors
- Jaeger – Older distributed tracing system and OSS tool for visualizing traces
- Kubernetes – Seemingly overcomplicated but still necessary operating system for containers that lets you abstract your compute away from cloud vendors
- Service Maps – Pretty drawings of services represented as circles with arrows pointing to other services
- etc.
I know that every space has its own sea of vocabulary, but observability is one of the most daunting ones I’ve seen. For the first six years of my career, I had never run into any of these terms—and they are utterly daunting. There are so many different technologies out there, each at least capable of spitting out a log, and it seems like developers need to learn about them all. Yikes!
And as it turns out, there are a bunch of other companies who’ve been in the “monitoring” and “analyzing your logs” space for a long time now, and they’ve sort of rebranded their existing products or product suites as “observability.” Some have also significantly improved or otherwise revamped parts of their products to not just be a rebranded tool, but not all of them have—so that’s confusing.
Oversimplification: Observability is about these five outcomes
Here’s a fancy image I’ve been using in talks to help frame up observability:
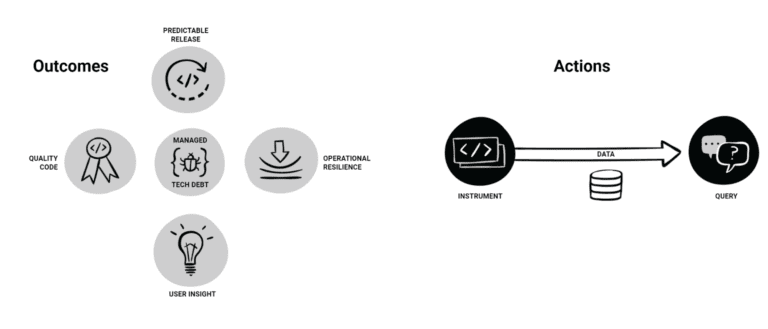
On the left-hand side of the image, there are five bubbles representing these concepts:
- Quality code
- User insight
- Managed technical debt
- Operational resilience
- Predictable releases
The idea is that these are the outcomes you want to achieve and should be able to with an observability tool. Big, complicated systems running in the cloud will try their best to throw a wrench into these outcomes because they’re unpredictable and break in novel ways. Based on experience, you can’t understand what’s going on with your code until it’s in the hands of real users—and your codebase will try its best to turn into a big ball of mud if you don’t constantly keep it in shape.
How do you keep things from turning into mud and letting your users run your system into the ground? Answer: by putting in some work, represented by the right-hand side of the image:
- Instrumenting your code (probably with traces, but you can start with logs) to generate observability data
- Storing the data from your instrumentation
- Using a system to query that data in useful ways so you can learn stuff to make your code better
Honeycomb helps store your data and lets you query it. Additionally, Honeycomb has some cool features like BubbleUp that lets you do more than just actively query something. Instead, it lets you query your data to learn about what’s going on with your live systems.
To get the most use out of Honeycomb’s data storage and querying capabilities, you need to instrument your code. There are a bunch of ways to do that, but we recommend OpenTelemetry because it doesn’t lock you into our product if you don’t like it or can’t pay for it.
OpenTelemetry lets you configure and run automatic instrumentation components that capture high-level stuff like inbound and outbound requests for all your services. You can use the OpenTelemetry SDKs to instrument your code directly, creating traces through your services that capture important data along the way, and attaching events for important things that happen.
If that sounds confusing or hard, that’s because it can absolutely be confusing or hard. That’s mostly why I have a job here: To try my best to make using OpenTelemetry easier and more powerful. BTW, if you already use our product (and if not, it’s free to sign up), you can ask me all the instrumentation questions you want in our Pollinators Slack community.
Idle thought: The industry focuses way too much on code instrumentation
Anyone who has Googled “observability” in the past has undoubtedly come across this thing called “three pillars of observability” and also articles that talk about why that framing sucks.
You see, there are these things called traces, metrics, and logs, which are data about your programs that come in specific formats. My understanding is that traces are the most useful of the three, but all three are still important.
Yet, these are just data structures and inputs. They’re interesting from a mechanical standpoint, but ultimately I care a lot more about solving performance and reliability problems than thinking about data types I’m creating instances of.
I’ll work to make sure I collect the right data, but at the end of the day, it’s about how fast I can analyze my data and solve whatever problem I’m having.
It’s kinda like Object-Oriented Programming, actually
I found this whole “three pillars” thing (and the fight against it) pretty confusing until I realized that there’s sort of a parallel in a much more broadly-understood concept: Object-Oriented Programming!
I learned in school and from lots of places online that there are four principles of OOP:
- Inheritance
- Encapsulation
- Abstraction
- Polymorphism
But once I started actually using an OOP language in a big codebase, I learned that OOP is not actually about the so-called four principles of OOP. In fact, at least one of them (inheritance) is often derided as being the source of many code maintainability problems in large codebases.
Encapsulation via objects or generalizing stuff via polymorphism is only a goal if you have infinite free time. They are merely ways to achieve real goals, such as:
- Code maintainability
- Accurate domain modeling
- Flexibility of your code over time
- Testability
There’s more that goes into achieving these goals than the OOP principles I learned about. Your choice of IDE, debugger, and test framework will impact your overall development experience just as much (if not more) than how you use a language’s constructs to organize your systems.
Data querying is as important as instrumenting your code
When I started my job and Googled the hell out of “observability” (we all Google to do our work, right?), I didn’t come across much that had to do with querying data. Maybe this was just Google being extra creepy, but it was mostly stuff published by Honeycomb that I’d end up on whenever I wanted to learn about anything more than the “three pillars.”
A lot of APM and observability products have a query language (that isn’t SQL) that you have to learn to filter and transform your data into something useful. Query languages aren’t inherently bad; I don’t mind learning them. But it’s a high bar to start getting any insight into what’s going on with your systems. Even if they were all using SQL, I think requiring SQL to effectively query data can make it difficult for developers in your organization to query observability data.
Honeycomb takes a different approach with a more visual query UI that’s easy to learn. And it’s fast, even when it has to crunch through trillions of events for a query. As I said earlier, being fast matters a lot.
I think other vendors that tout observability should focus more on making querying data as approachable as possible. But instead, I get the feeling that it’s treated like an afterthought. This is most likely because they were built decades ago when our systems were simpler and easier to predict, so logs and other traditional ways of monitoring were efficient enough (more on this later). I think most vendors in the observability space have an “underpants gnomes” approach to observability:
- Collect traces, metrics, and logs
- ?
- Observability!
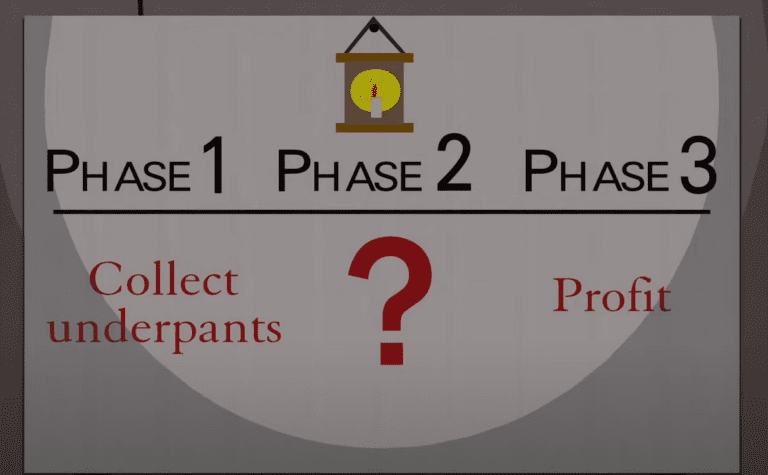
What’s phase two? Entirely unclear to me as an outsider whenever I read their guides on what observability is or how to achieve it. It seems that some are resorting to “AI,” perhaps so they can charge a bunch of money to run your data through a rudimentary model. They might not want to take the time or spend the money to build the kind of data store and query engine needed to do things like offer “group by” on any arbitrary column or efficiently handle high-cardinality data.
Eventually, I expect someone to tastefully incorporate a good machine learning (ML) model that excels at pattern recognition and surfaces things you should look into. But I don’t think that will happen soon. Machine learning tech might be good enough now, but designing a way to fit it into a product well is a whole other beast. Honeycomb doesn’t believe that ML holds the key in making the correlations needed to quickly figure out a problem, at least not today. Statistical tools are used, but none with a nondeterministic, probabilistic means to generate a result for you. For now, the human brain is still the best at seeing patterns if they’re surfaced in the right way.
Oversimplification: Observability is “just” cloud debugging
People at Honeycomb are groaning right now (sorry!), but this is the framing that actually makes the most sense to me.
The codebases I’ve worked in over the years have been some variety of desktop, mobile, or monolithic N-tiered web app software. If something wasn’t working right, I’d just set some breakpoints in places I think made sense, hit the `F5` key command to launch my app, and start looking at values when a breakpoint is hit. Sometimes I’d get fancy and do binary search debugging, a technique where I’d set a breakpoint somewhere where I knew things were correct, somewhere else where I knew things were wrong, somewhere in between, and step through the code, resetting my start, middle, and end points until I narrowed it down to a single problematic area.
If I had a performance problem, this was also pretty easy. I’d load up a profiler or other tools in my IDE, run my app, and look at memory and CPU utilization. Later in life, I learned how to use the incredible PerfView tool, and embraced the power of ETW traces and process dump files.
Finally, I’d use the IDE debugger to learn how a codebase worked. Curious about how data flows through an app? Set some breakpoints, run the app in debug mode, and check out how the values change. It’s a wildly productive experience.
However, you can’t do a lot of this stuff in various modern systems, let alone cloud-native apps relying on cloud services that you can’t run on your local machine. In a sufficiently complex system that uses all kinds of cloud provider services, it’s crushingly difficult to set up that system to run locally—let alone be able to debug it by pressing the F5 key in a debugger. Performance problems often appear nondeterministic (or are nondeterministic), and can trigger under specialized conditions that you cannot predict or reproduce locally.
That’s where an observability tool comes into play. You need to do more than just hit the F5 key on your keyboard to get started. But if you do things like distributed tracing and capturing User_IDs and other high-cardinality data, you can leverage observability tools like Honeycomb to deeply understand your app behavior—regardless of its architecture.
Idle thought: Writing observable code is hard
I’m far from an expert on instrumenting a codebase for observability. As far as I can tell, it is not easy.
I’m used to writing “debuggable” code. Declare some variables, click on your editor to set a breakpoint, hit the debug button, and BAM: You can see what values are, step through code execution to see how things change, and quickly narrow in on the problem. And to aid future developers, it’s simple to keep code “debuggable” in just about any programming language that has a debugger.
Comparatively, I regularly find myself intimidated by how much work is involved to make my system “debuggable” for observability tools. Sometimes I need to install an agent, and I get anxiety over installing, deploying, and managing agents. I might need to pull in a library that’s poorly documented, or has some assumptions about how my app is loaded that don’t apply because I’m using a different library or framework that doesn’t let me control my application lifecycle. Maybe I’m working with a proxy that’s spitting out a bunch of crap I don’t care about and now I need to figure out how to shut it up—except I still want to keep some of what it spits out. Another proxy? Or do I have to write some code to “plug in” to something else now? The list goes on. It’s hard.
Every vendor seems to have a solution of sorts that they claim makes it easy, but these tend to be proprietary, so you have to start over if you pick a different vendor. It seems likely that OpenTelemetry is going to win out as the standard for collecting data, but it’s so new that we’re regularly giving talks that discuss what OpenTelemetry is, why it’s worth it in the long run, and why we think it’s the future, so it’s got a long way to go.
More than anything, I think the key to observability getting outside the domain of SREs is to find ways to make it as easy to instrument code as it is to “make code debuggable.” As far as I can tell, nobody’s gotten close yet.
Idle thought: Analyzing your data is hard too
Since I’ve had the pleasure of starting a new role where I came in knowing nothing, lemme tell ya: Analyzing systems, even with good tools, is really hard if you’re not already an expert in those systems.
This isn’t exactly unique to observability tools. I’m lucky to be one of the few experts on the F# language and compiler, which means that for any performance issues, I know what kind of data to collect, which tool to use, where to start looking, which things “matter” and which don’t, if the data being collected is meaningful, etc. Anyone new to F#, or really even just F# performance analysis, is not going to be productive at figuring out their performance bottlenecks.
My belief is that if you’re not an expert on how your distributed systems (microservices?) are built, you’re going to have a hell of a time diagnosing correctness and performance issues. Then there’s the added complexity of needing to know how data is being organized in whatever observability tool you’re using.
Going back to the debugging analogy, you can use a debugger (like the one in Visual Studio) to learn about how your codebase works. Set some breakpoints at various stages of your application, step through, and watch it all unfold. It’s amazing. And I haven’t seen observability tooling offer up anything like that so far.
I think there are ways you can know up front what kind of data is being collected and offer some reasonable jumping off points to query data further. That’s not an easy thing to build, though. I really hope I don’t throw my hands up in the air and say, “AIOps, screw it.”
Observability is actually pretty cool
I wanted to end on more of a high note. Observability, once you attain it, is pretty great.
I’m lucky that at Honeycomb, the engineering org has a high degree of observability maturity. There are practically no questions that you can’t get an answer to in sub-second times. I don’t know if I’ve had that come to Jesus moment about observability just yet, but I think I’m on the path to it. I wish every engineering organization could have observable systems like this.
I also think there’s some pretty neat stuff that could be done in the future. What does observability for testing and CI systems look like? Could observability data get pulled into an IDE? Lots of possibilities.
Last note: If you are interested in learning more about instrumenting with OTel, I highly encourage you to join our July Advanced Instrumentation workshop. It’s hands-on and instructor-led, you can ask questions, and even book follow-up 1:1 office hours. I highly recommend it!
Want to know more?
Talk to our team to arrange a custom demo or for help finding the right plan.