Filtering in Context: Get Your Investigation On
File under: little things that go a long way. By popular demand, right click and filter! Stay in context Filtering via right click keeps you in context of your investigation. For example: when looking…

By: Chris Toshok

File under: little things that go a long way. By popular demand, right click and filter!
Stay in context
Filtering via right click keeps you in context of your investigation. For example: when looking at the summary table, if something looks like an avenue for further investigation, you should be able to dig in without losing your place. (There’s a reason, after all, that the right click menu is called a “context menu”!)
Specifically in the Honeycomb UI, it keeps you from having to scroll around (and either remember values or cut & paste them into the query builder.)
Click to filter
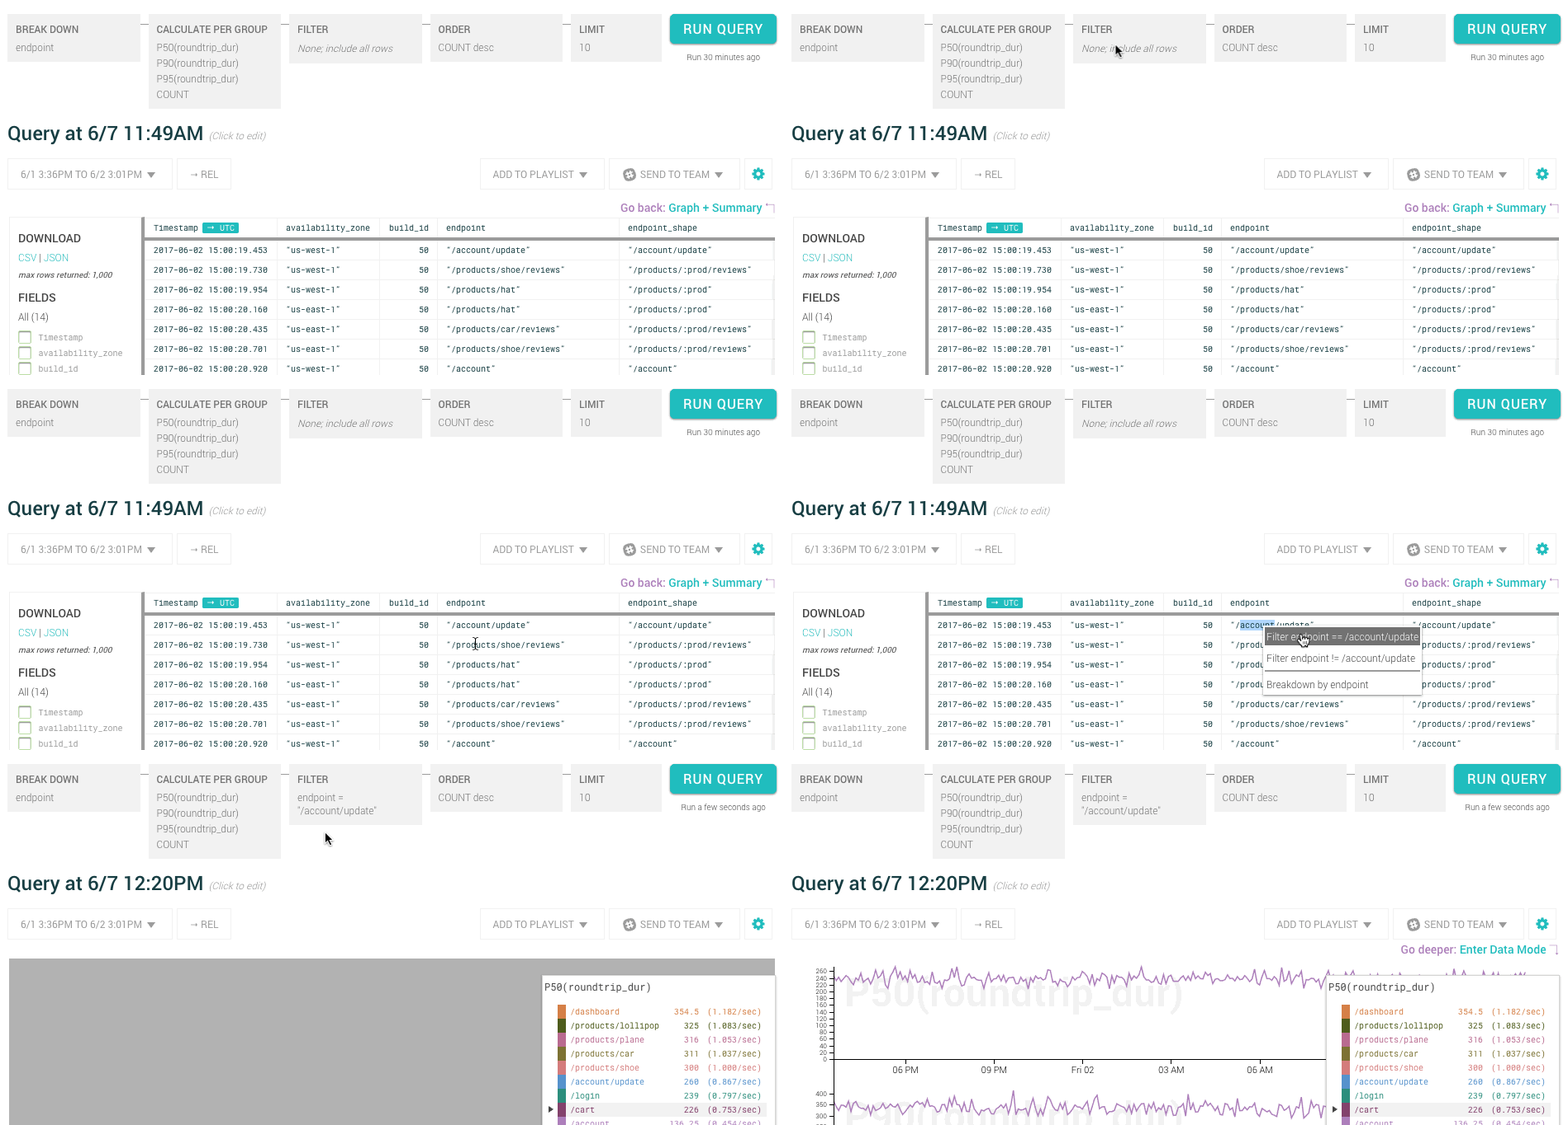
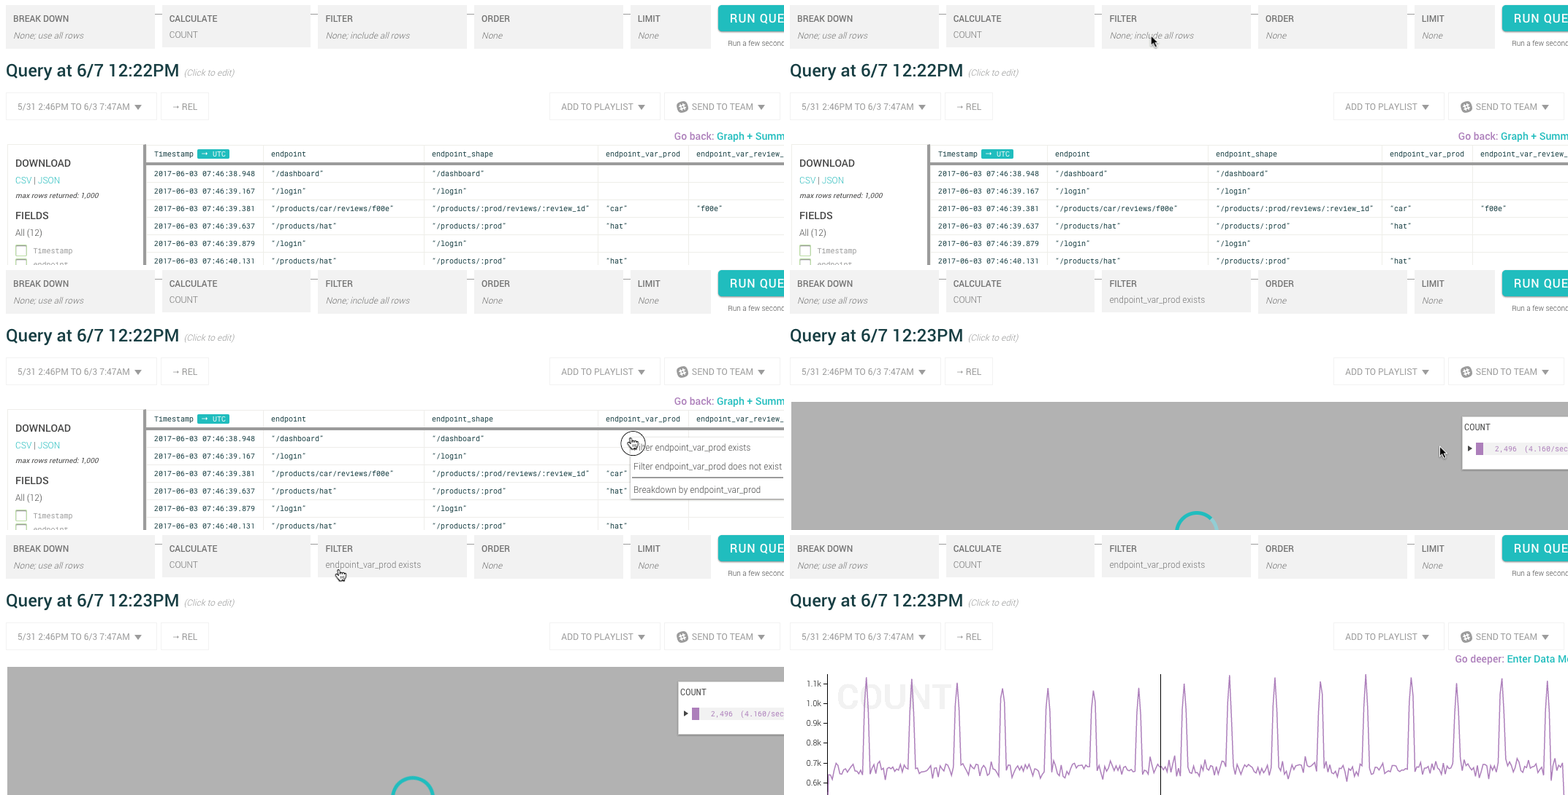
It’s simple, right-click on any cell in the summary table below the graph or while viewing raw data:

As you can see above, right clicking on a cell containing a value gives you the ability to include or exclude those values, and breakdown by that particular column.

And right clicking on a cell that doesn’t contain a value gives you the ability to include/exclude events based on whether the column has a value.
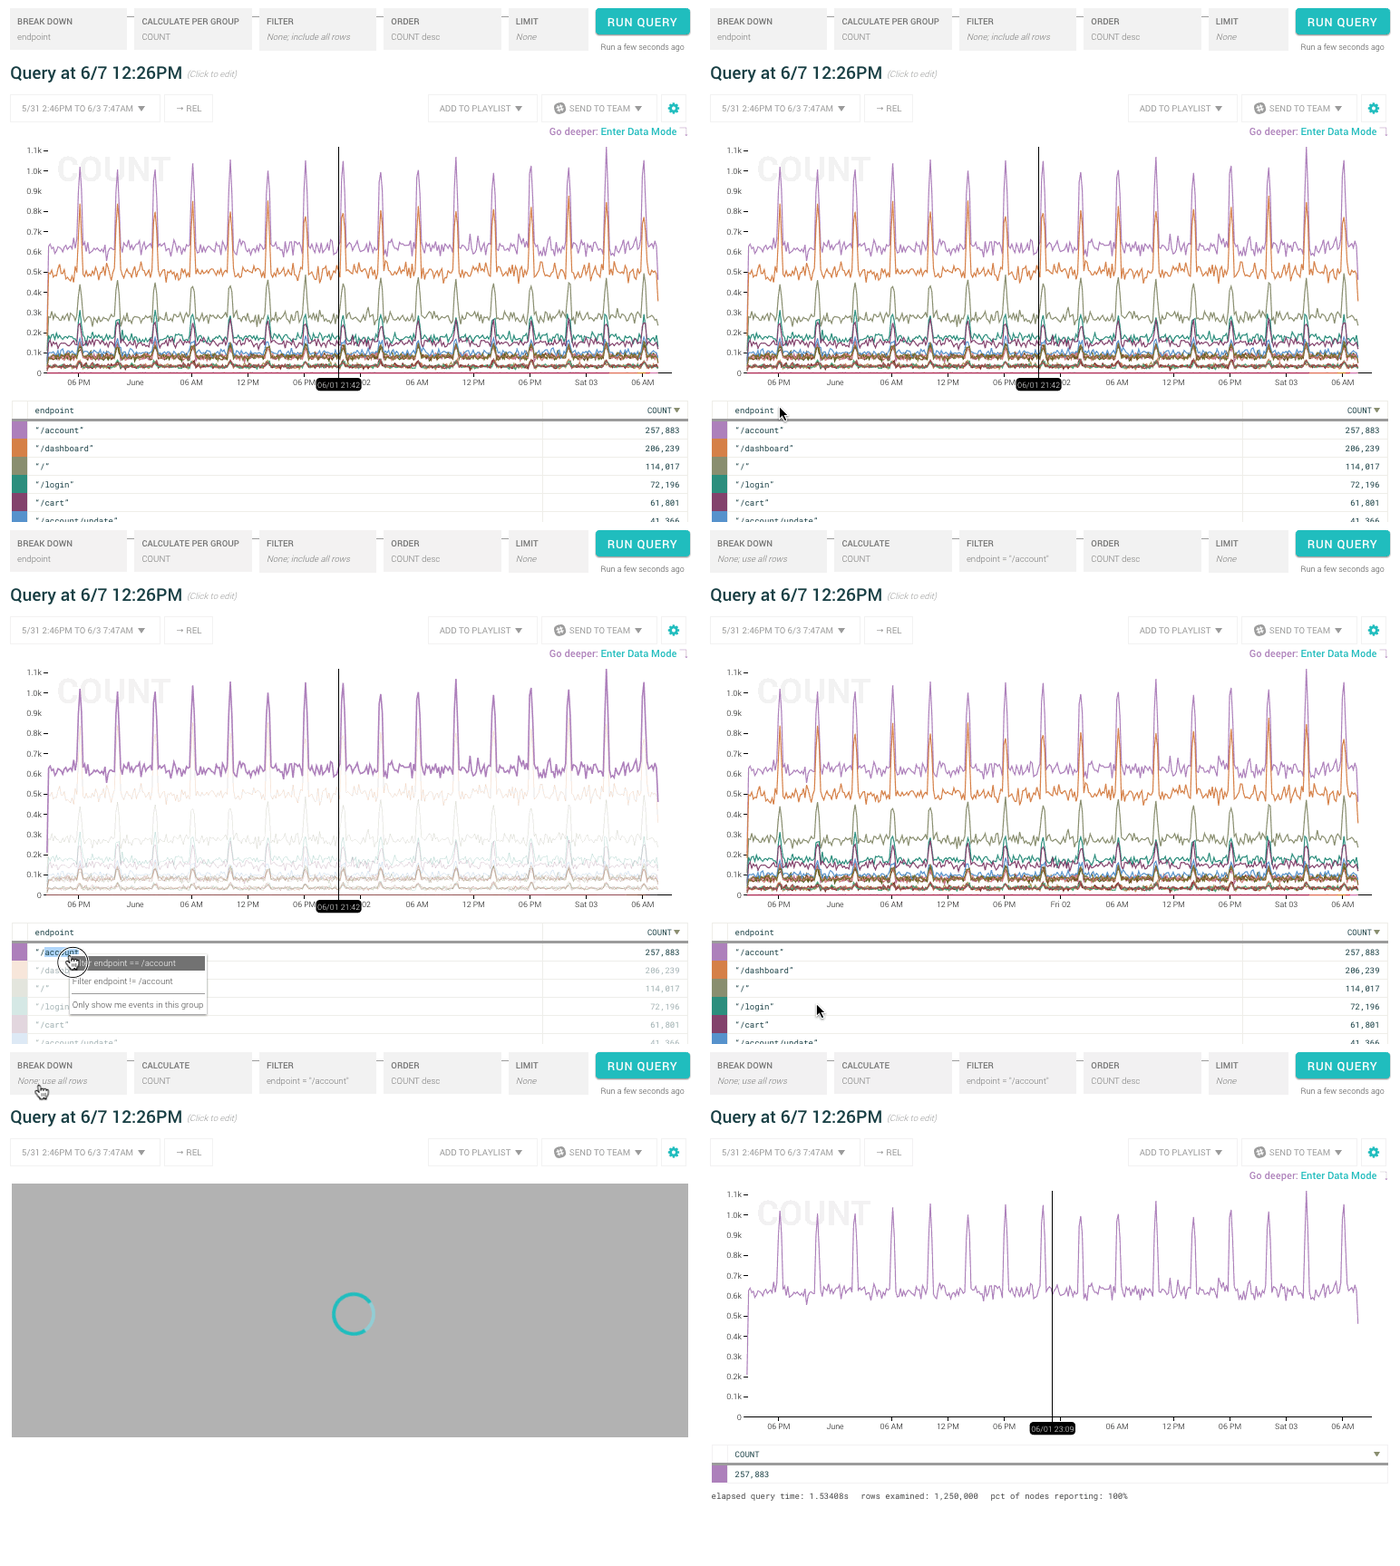
If you’re using the summary table below the graph, and your query has breakdowns, another operation is available.

“Only show me events in this group” adds filters for every column/value in the breakdown, then removes the breakdown.
If you’re already in edit-mode in the query builder, adding filter clauses doesn’t run a new query. It simply adds the clauses to the builder. You can add multiple new filter clauses (maybe along with switching the filter match to Any), then run the query when you’re done (using shift-enter to keep from having to mouse back up to Run Query). If you aren’t in edit mode, we’ll run the new query immediately.
Want to know more?
Talk to our team to arrange a custom demo or for help finding the right plan.