Evaluate and Improve Your Site's Web Performance With Honeycomb for Frontend Observability
At risk of sounding too obvious, without an observability tool, it’s extremely difficult to reason about a complicated frontend system. Especially when hundreds of engineers are shipping code every day.

By: Mae Capozzi

It’s 2025, The Frontend Deserves Observability Too
Watch Now
As an engineer on Honeycomb’s frontend platform team, I’m constantly trying to understand and improve our web performance. And I have a whole lot of questions.
- Are we loading too much JavaScript on a particular route?
- Is our bundle too big?
- If we change how we import lodash, does it make a difference?
- Do we have slow interactions in complicated components like a combobox?
I tried answering these types of questions without Honeycomb in the past, and it was difficult and time consuming. It used to take me days to identify performance issues and their causes, let alone fix them and confirm that they improved web performance for some subset of users.
At risk of sounding too obvious, without an observability tool, it’s extremely difficult to reason about a complicated frontend system. Especially when hundreds of engineers are shipping code every day.
With Honeycomb for Frontend Observability, I can detect web performance issues and determine their cause within minutes. When you configure Honeycomb’s web SDK, your frontend codebase becomes part of an end-to-end trace, so you can see everything that happens with a user event, even if the problem isn’t related to the frontend itself.
This is useful when you’re researching a performance issue, because it allows you to understand whether your site is performing well. If it’s not, you can visualize whether the performance issues are coming from frontend or backend code. Finally, you can track improvements and regressions over time so that your site stays performant.
There are a number of ways to monitor a site’s performance with Honeycomb. I’m going to walk through a couple of key concepts to get you started. We’ll discuss:
- How to create and navigate Core Web Vitals (CWV) queries in Honeycomb
- How to use traces and wide events to better understand your CWV scores
- How to create queries that identify which routes load the most JavaScript
- How to track improvements and regressions over time
How to create Core Web Vitals queries
Monitoring your site’s CWVs can be an easy starting point for measuring your site’s web performance. Three important CWVs are Largest Contentful Paint, Cumulative Layout Shift, and Interaction to Next Paint.
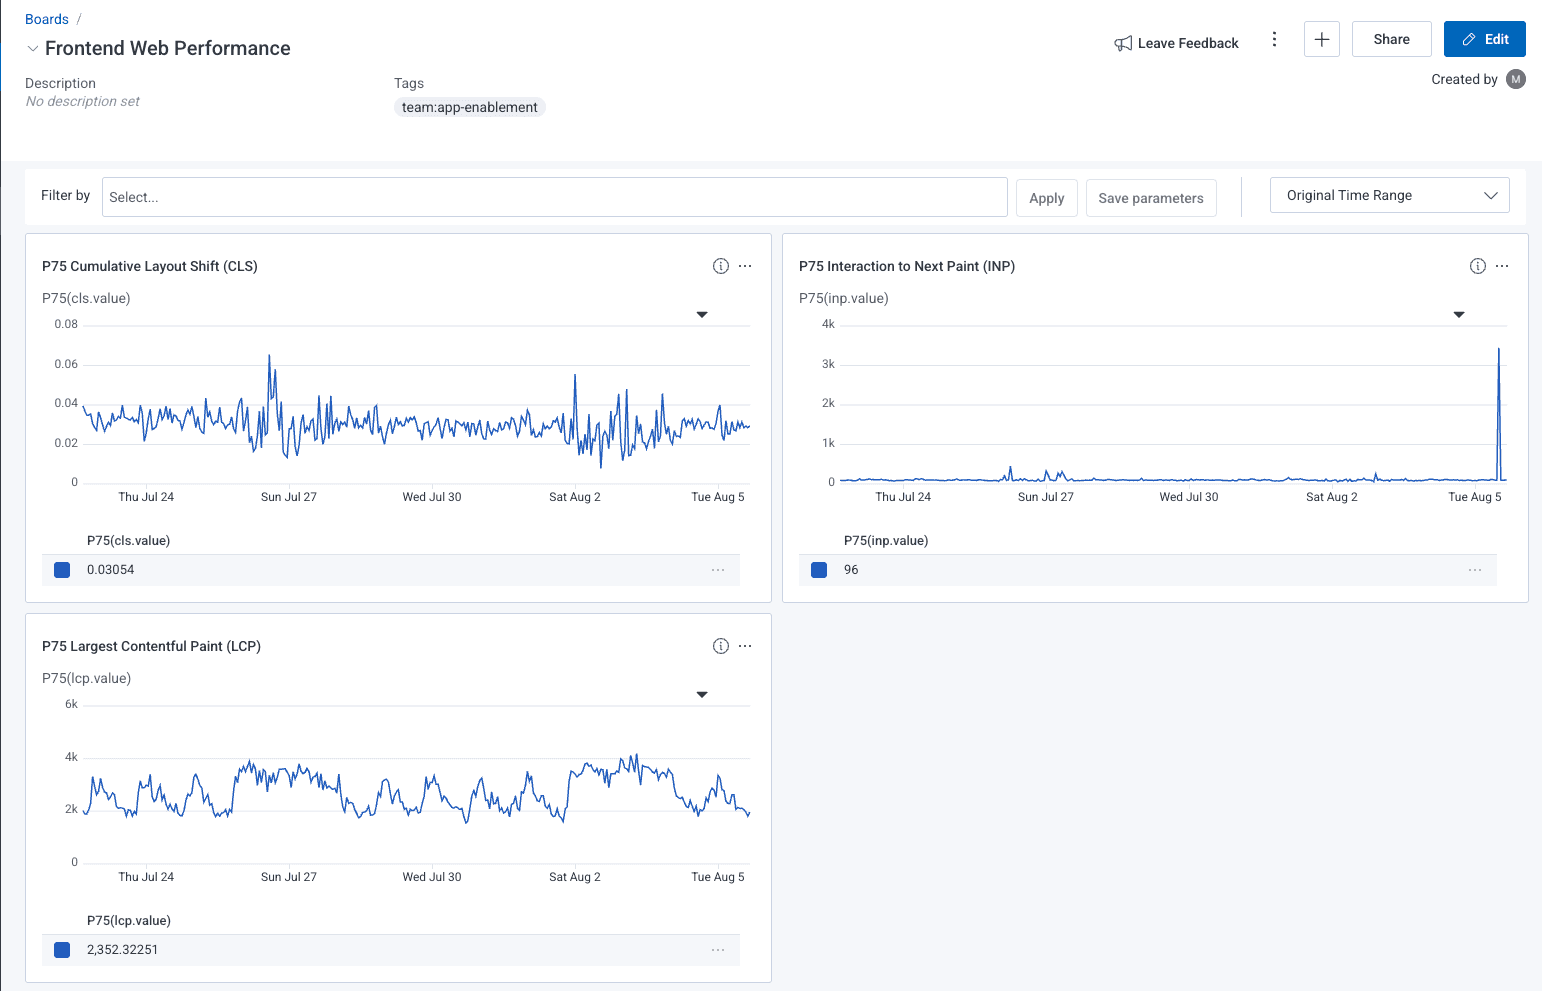
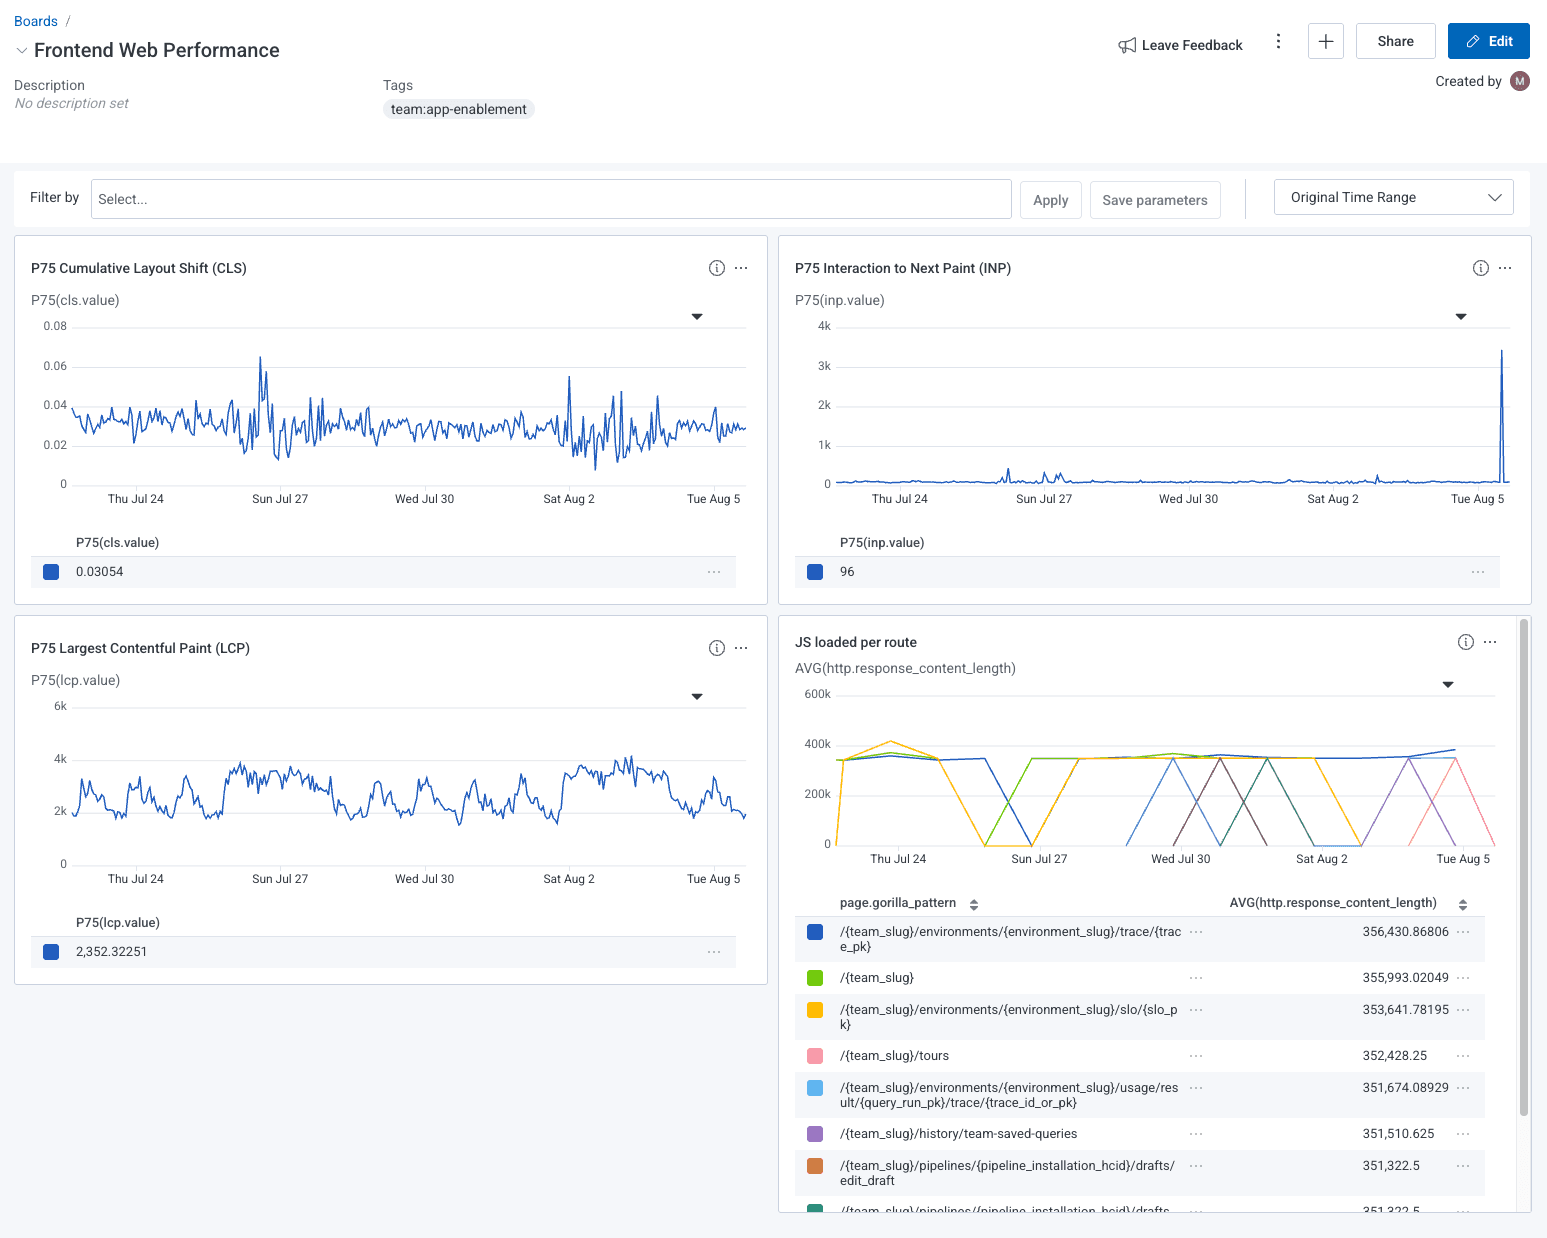
It can be useful to see these three CWVs at a glance on a board in order to understand the general health of your frontend.
First, we’ll create the Cumulative Layout Shift (CLS) query. We’re going to measure the P75 CLS value.
In the VISUALIZE clause, we’ll add P75(cls.value) and in the WHERE clause, we’ll add name in CLS, cls.
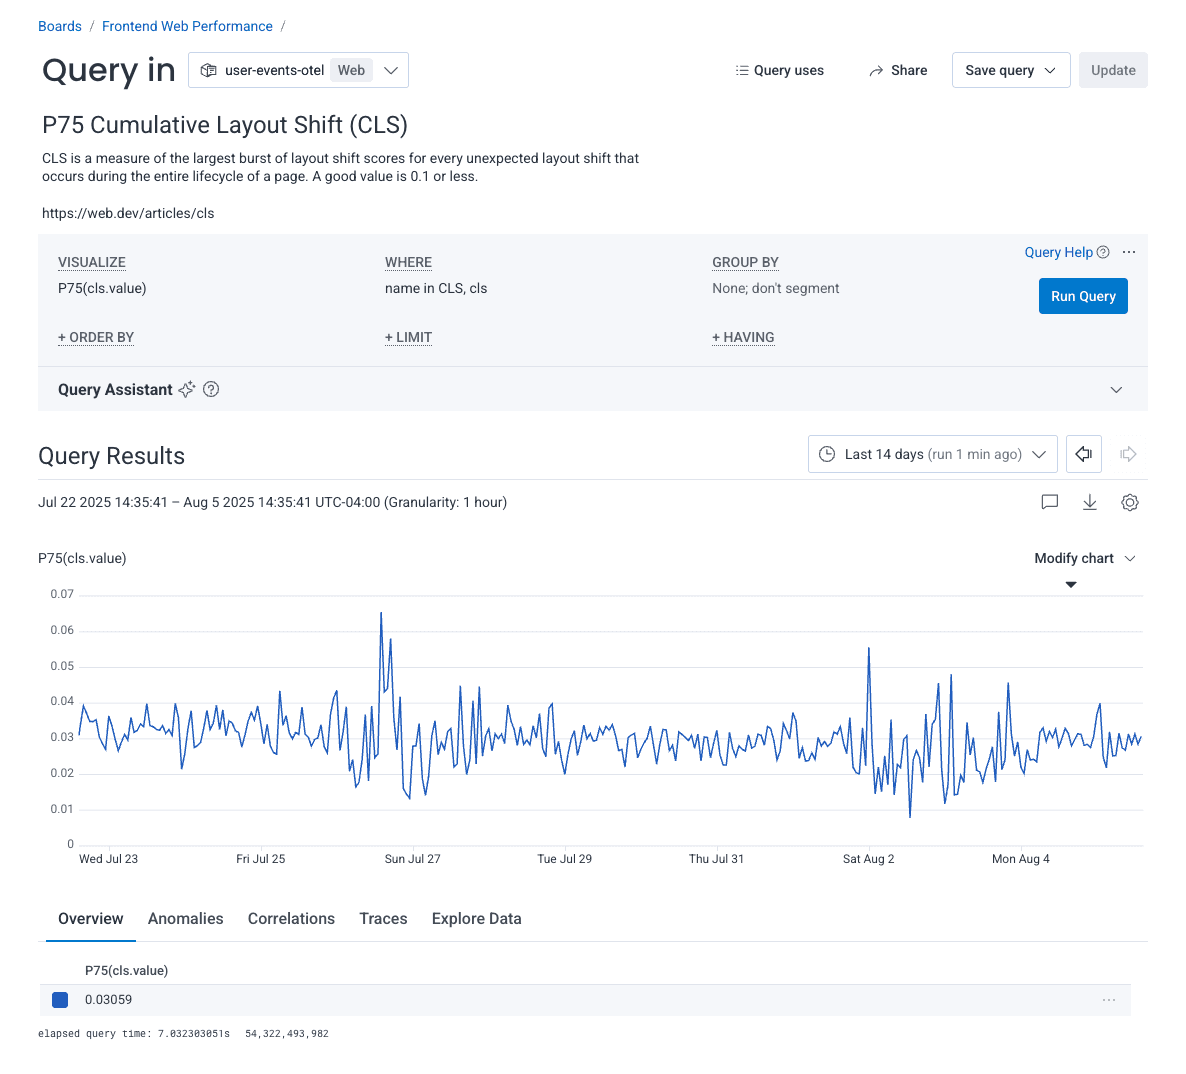
Go ahead and save this to a board so that you can keep track of your query later. I’ve saved my query to a board called Frontend Web Performance.
Next, we can create the Largest Contentful Paint (LCP) query. We’ll measure the P75 LCP value.
In the VISUALIZE clause, we’ll add P75(lcp.value) and in the WHERE clause, we’ll add name in LCP, lcp.
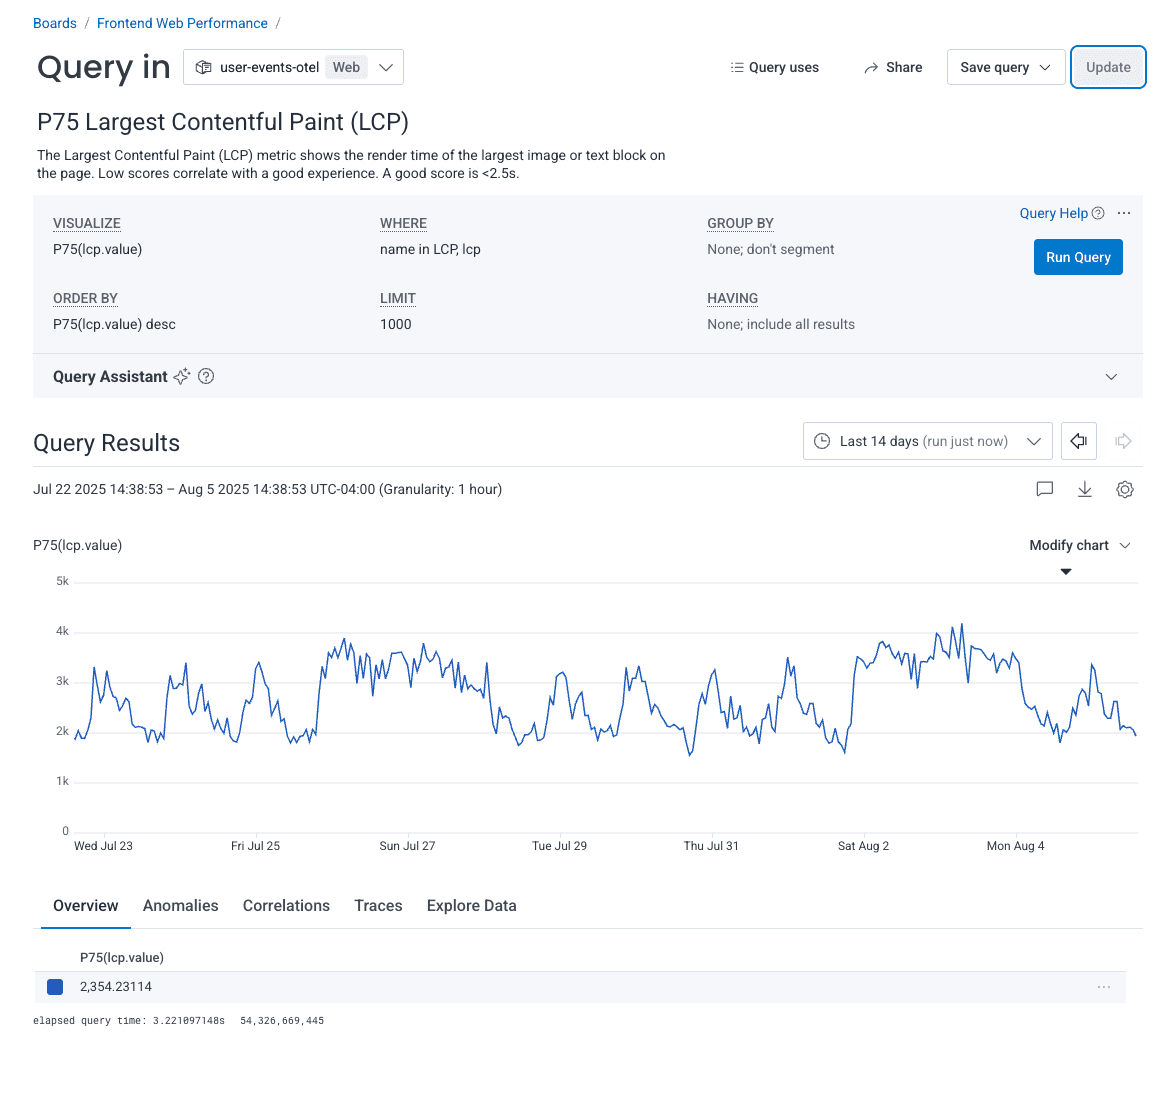
I’ve added this to my Frontend Web Performance board as well.
Finally, we’ll create the Interaction to Next Paint (INP) value. We’ll measure the P75 value, like we did with the other two CWVs.
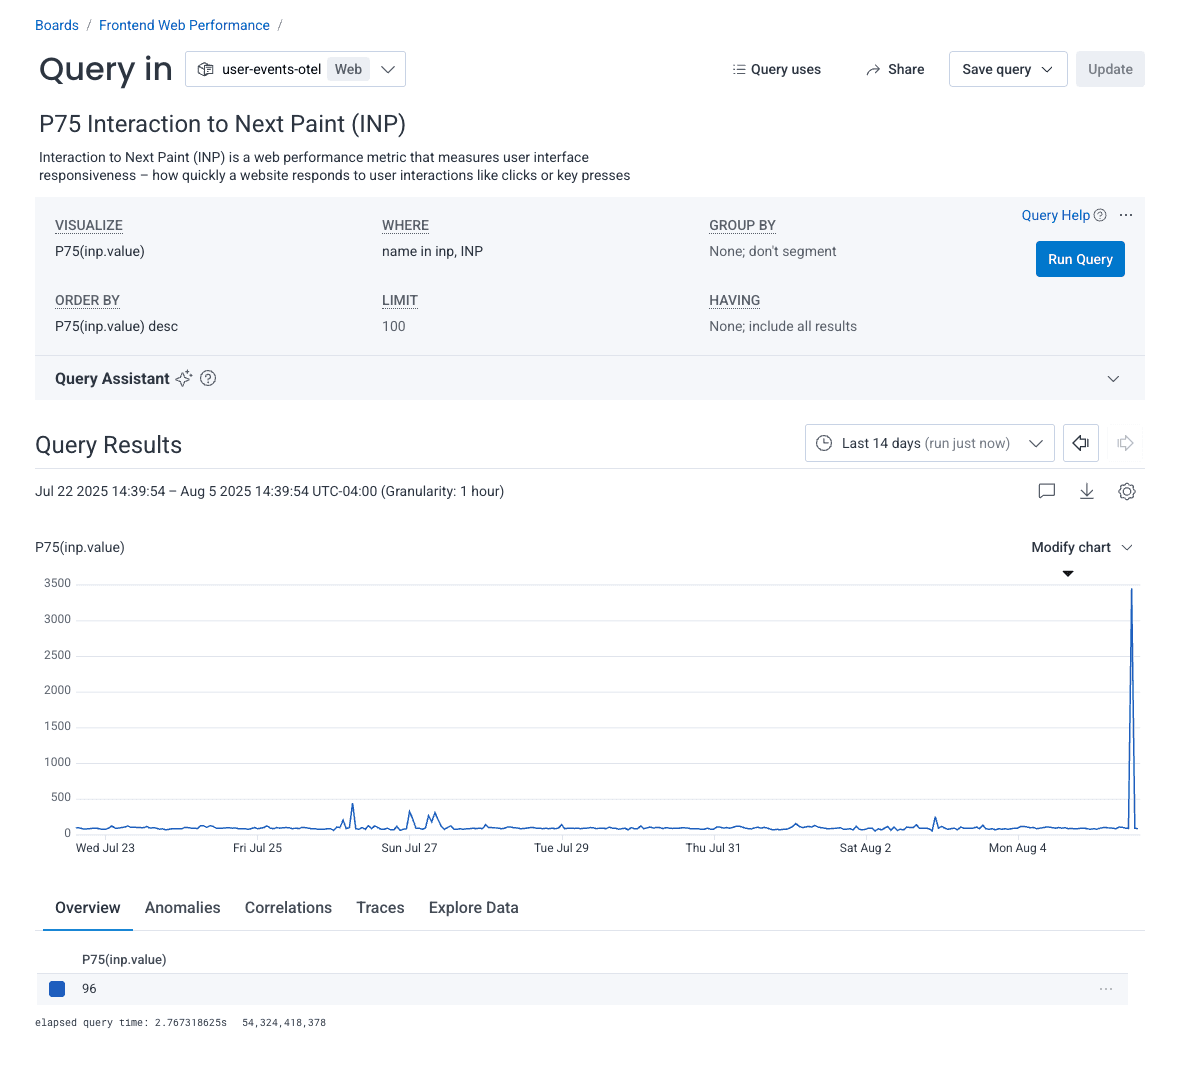
Now, we can see all of our CWVs on our board at a glance, which allows us to identify historical trends, or notice unusual spikes.
Investigating Core Web Vitals
Let’s dig into our P75 INP scores a bit to see if we can identify an element that is contributing to poor INP scores. At Honeycomb, we have custom instrumentation that allows us to group by route. This attribute is called the page.gorilla_pattern. Let’s try to group by route to identify which routes are performing the worst.
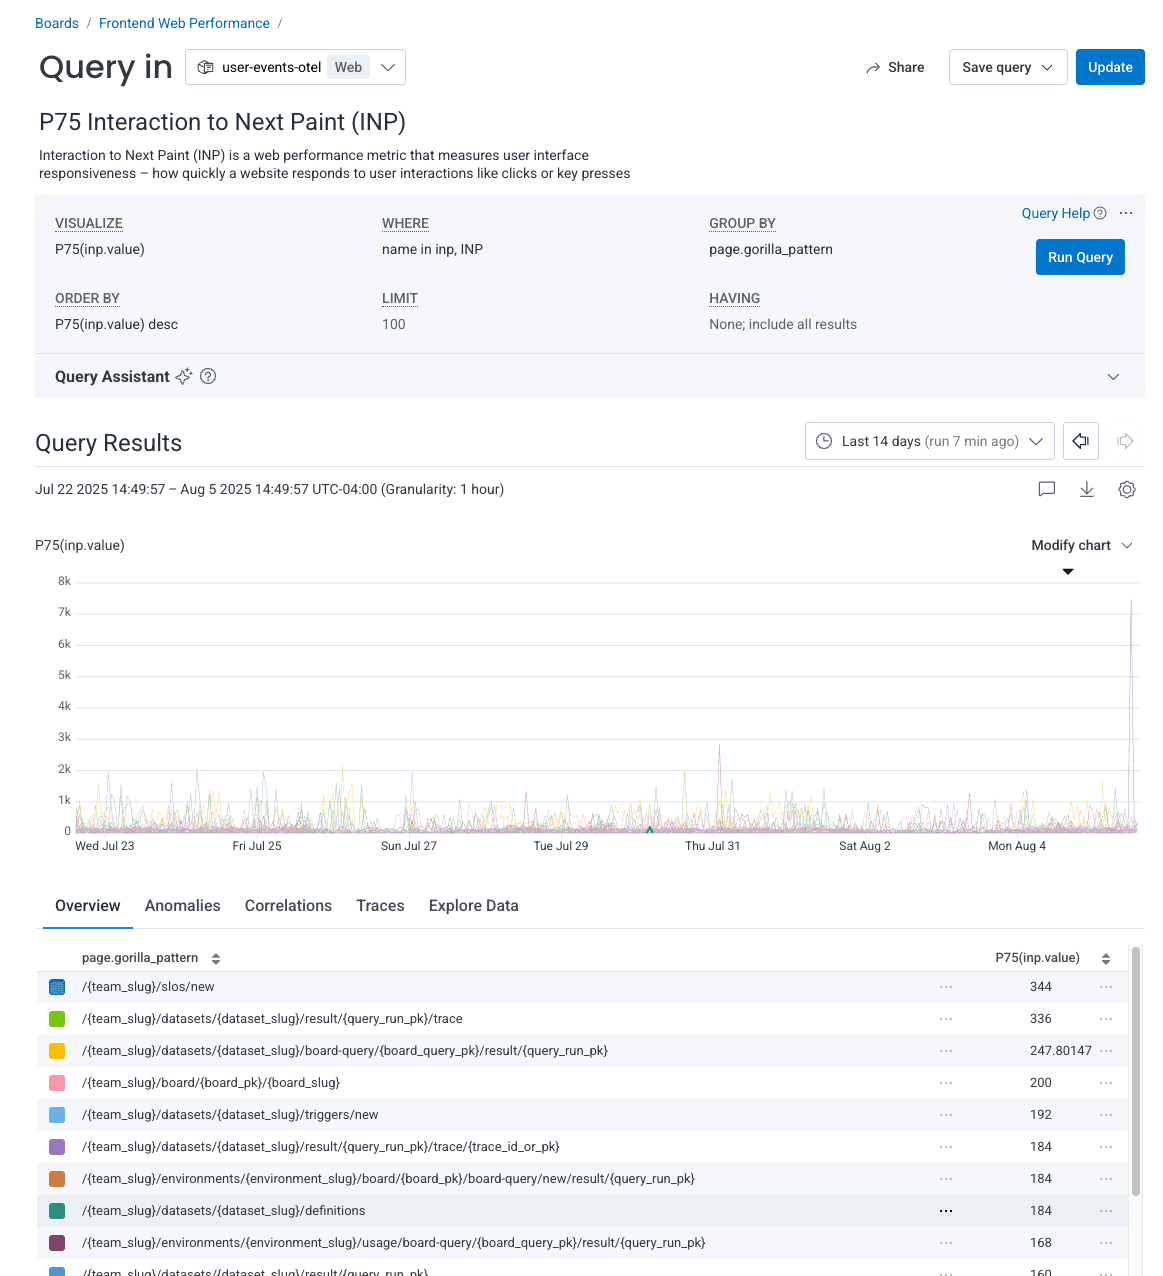
Our worst performing route is /{team_slug}/slos/new, with a P75 value of 344. We can filter to only look at that particular route. Once we click the “Filter to this group” option, we see a new query with data only for this particular route.
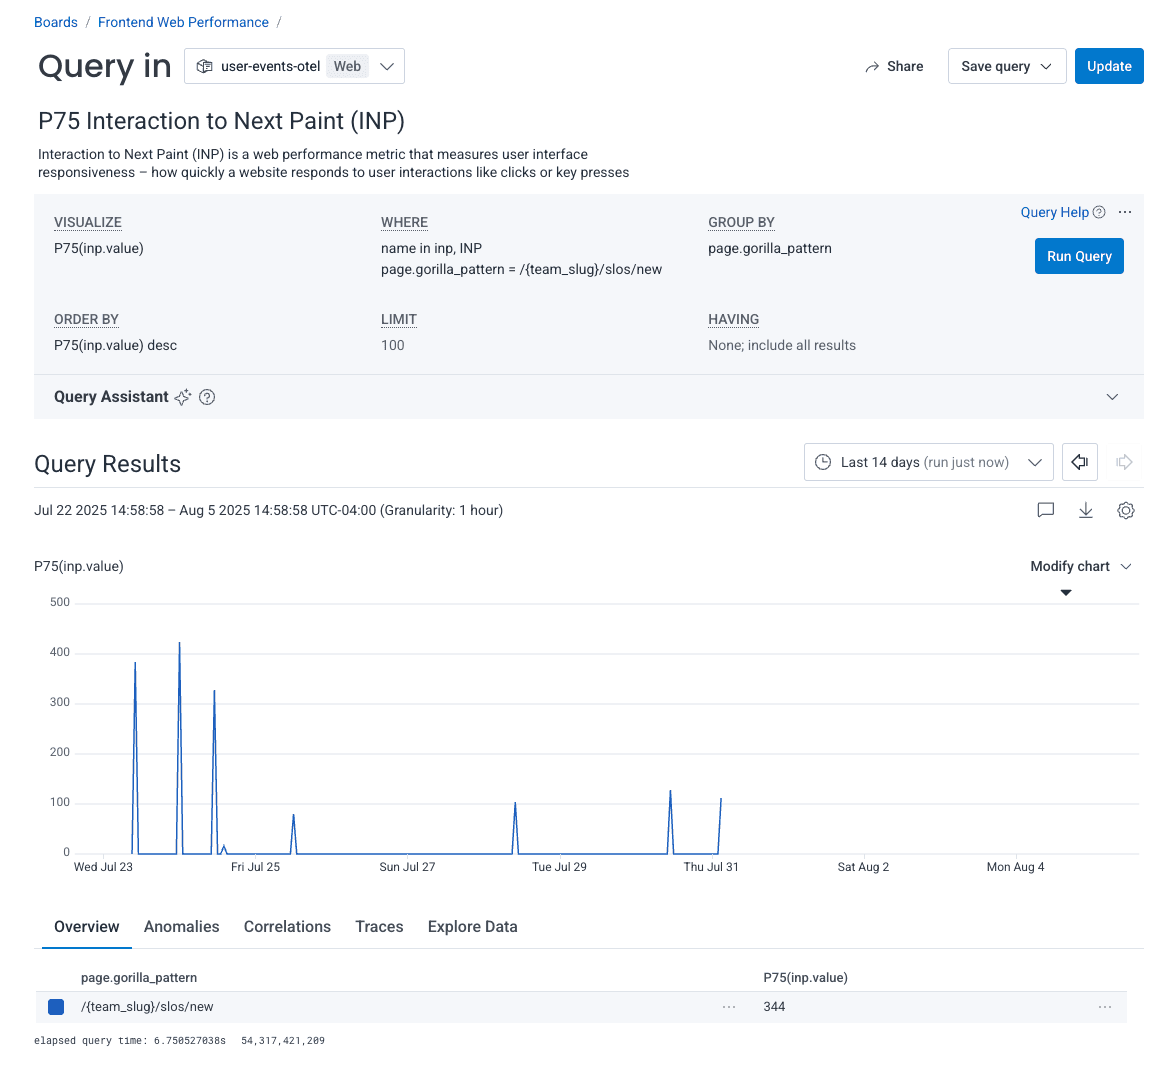
Let’s view a trace of one of the recent spikes:
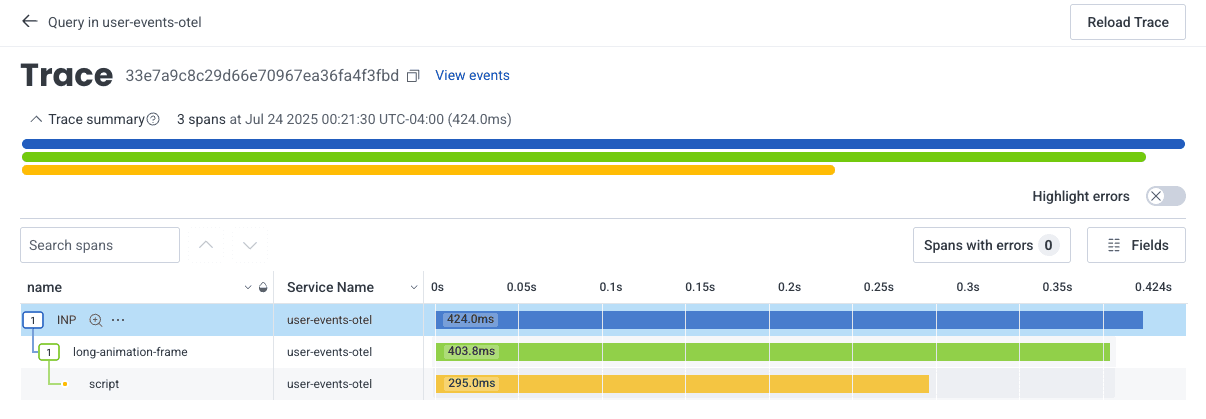
At first glance, this trace doesn’t look too exciting. It only tells us name and Service Name. There’s a “Fields” button right above the trace waterfall that will allow us to add more relevant fields.
I can add all kinds of fields, some which come out of the box with OpenTelemetry, and some that we have added on to our custom instrumentation.
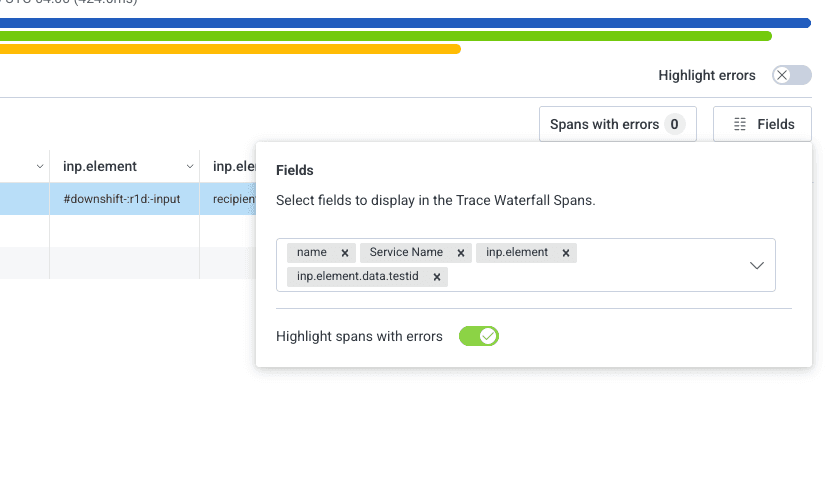
For example, I can see which route this was, what the INP score was, the id of the element that actually caused the poor INP score, and the data.testid of the element!
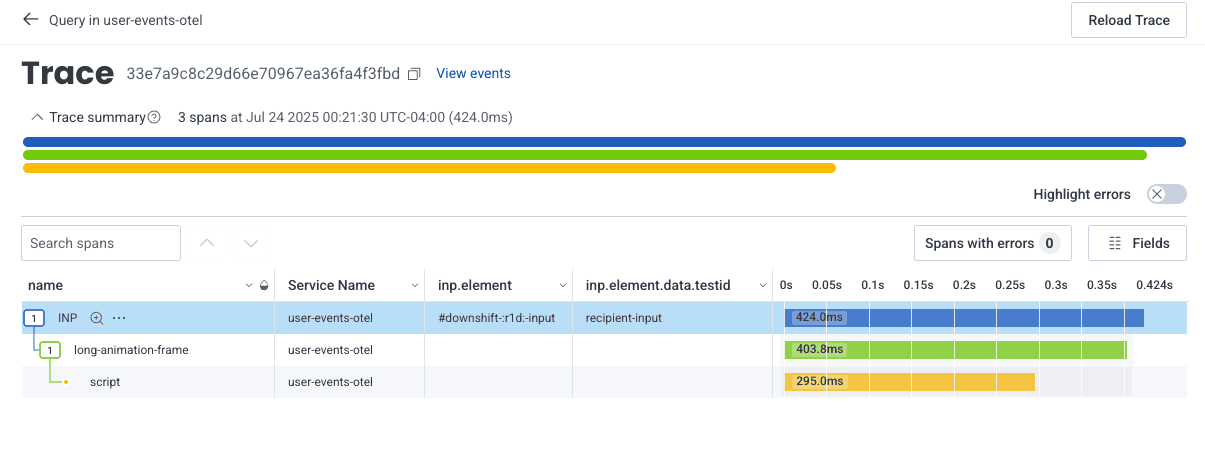
In this case, the poor score was caused by an element with an id of #downshift:r1d:-input, and has a data.testid called recipient-input.
When I search for recipient-input in my codebase, I discover it’s the test id of a component called RecipientInputDropdown. Within moments, I have identified a component that is causing poor performance. You can do this type of investigation across all of the CWVs that you have created queries for, not just INP.
Honeycomb greatly simplifies the effort it takes to capture data about your site’s CWVs, and allows you to drill down and leverage wide events to gather insights about why your site isn’t performing well.
Identify which routes load the most JavaScript
Honeycomb for Frontend Observability goes far beyond tracking CWVs. I also like to pay attention to how much JavaScript we are loading on certain routes.
Unless there’s significant latency caused lower down the stack, we can generally assume that the less JavaScript the browser has to load, the faster the page will load.
For the sake of this blog post, we’ll focus on querying for which routes load the most JavaScript.
- In the
VISUALIZEfield, I addAVG(http.response_content_length). - In the
WHEREclause, I addhttp.url starts-with https://poodle-static-assets.honeycomb.ioandhttp.url ends-with jsto filter down to only JS files. The actualhttp.urlwill be different for you, depending on how your site’s assets are loaded. - I
GROUP BYroute so I can see which route loads the most JS.
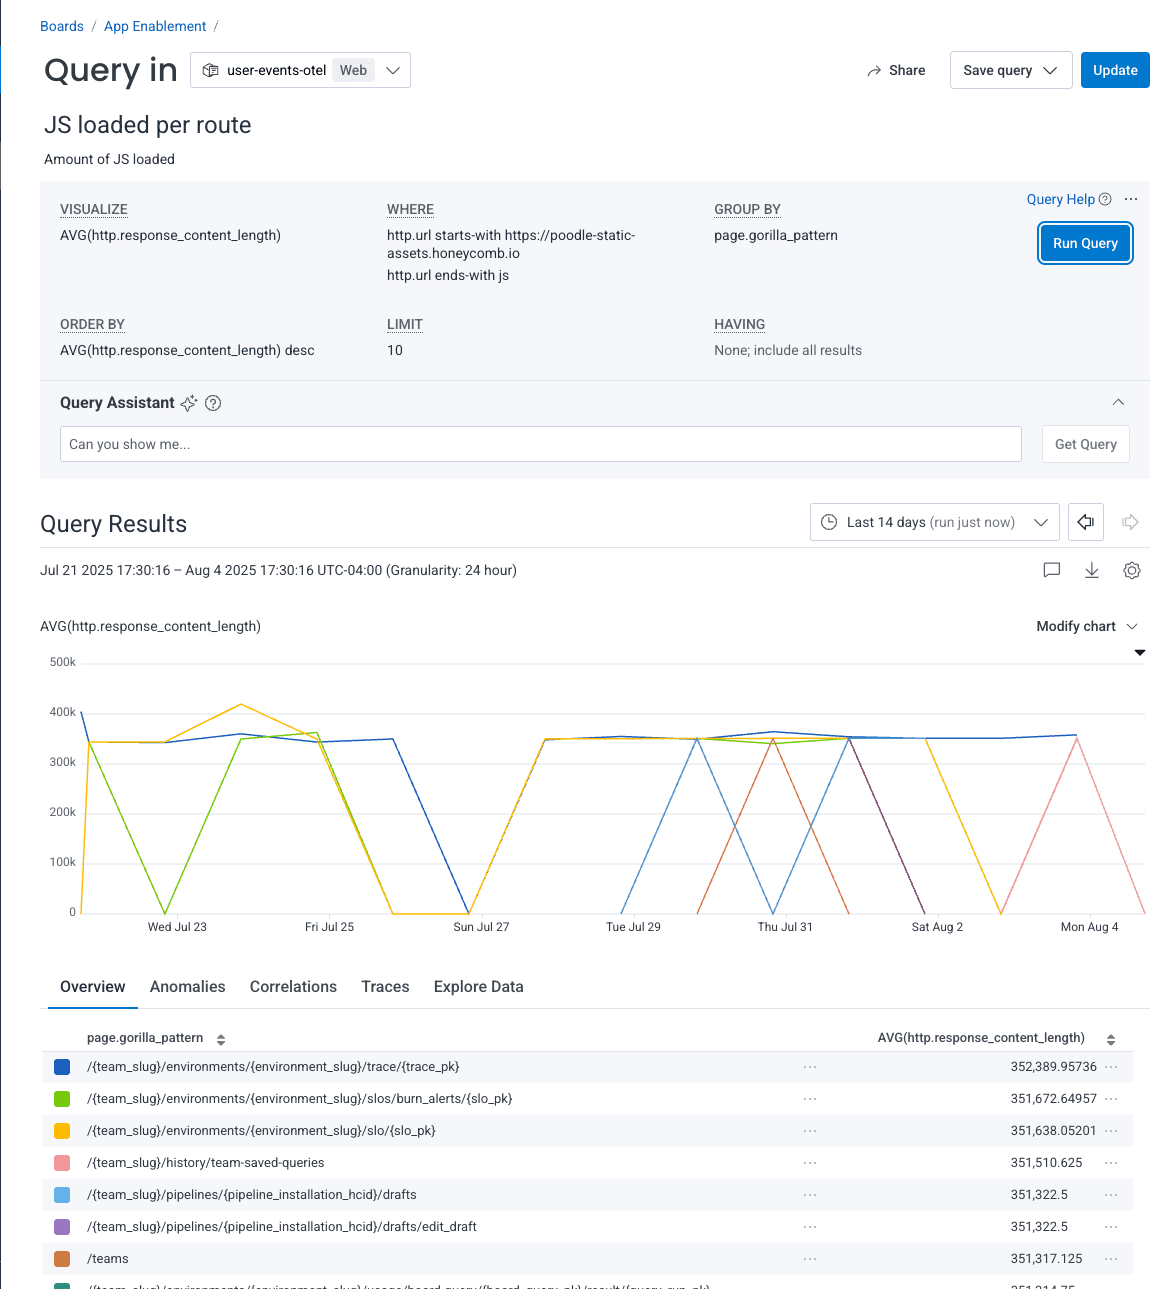
This visualization allows me to see which routes are loading the most JS in moments so that I can start investigating right away. It looks like /{team_slug}/environments/{environment_slug}/trace/{trace_pk} loads the most JavaScript, so I’m going to dig a bit deeper by filtering out all other routes.
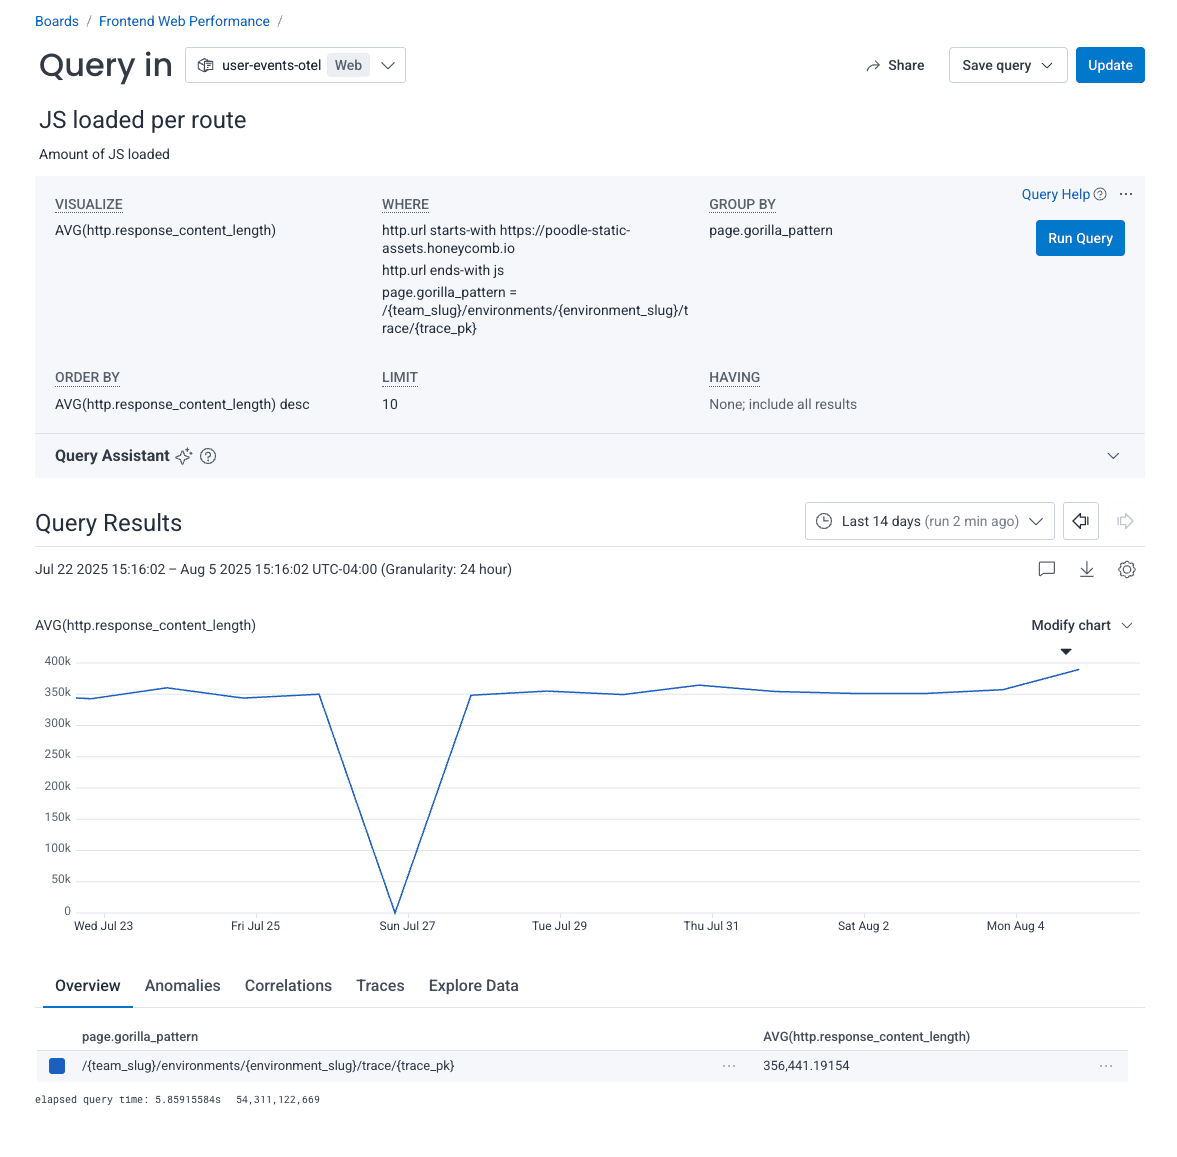
It looks like the amount of JavaScript that we’ve been loading on this page has increased over the past two weeks. Let’s look more closely by viewing the trace.
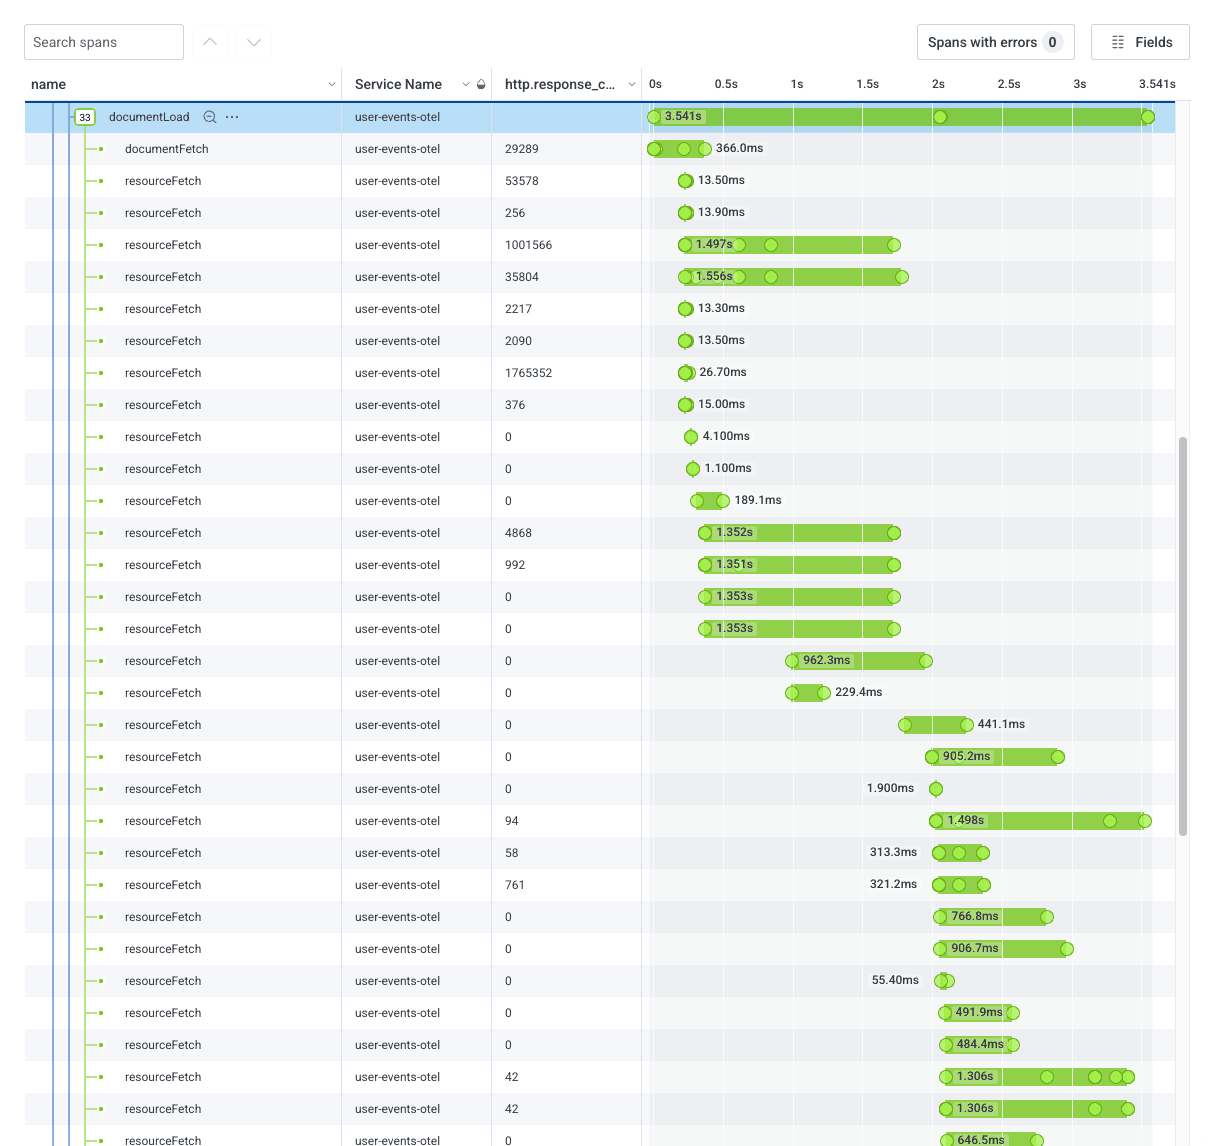
The trace waterfall shows us that when we call renderTmplWithData, we load a whole bunch of resources. By adding the http.response_content_length field, we can see which resource calls load the most JavaScript.
We can dig in even further by adding the http.url field to identify exactly what is being loaded, and whether it is a .js file:
The highlighted row has an http.url field: https://poodle-static-assets.honeycomb.io/static/dist/vendor.4d96baaa28854e409763.js. I recognize this as our bundle that contains third-party libraries.
Diving into the trace gives me a great starting point to start to improve the web performance on this page.
Track improvements and regressions over time
Once you’ve determined what you want to measure, you can save your queries to a board. You can regularly review the board to see if your web performance is tracking in the right direction.
Let’s say that we did decrease the bundle size of the vendor bundle. You can add a marker that explains the change that you made. When you check back in a few days, you can see whether what you’re tracking increased or decreased as a result of your change.
Understanding and improving a site’s web performance can be complicated. Not only is it hard to fix web performance problems, it is difficult to identify and prioritize which ones will have the biggest impact. With Honeycomb for Frontend Observability, you can save hours and quickly identify problems without having to spend hours in dev tools reloading the network tab.