Introducing the New Honeycomb Quick Start
Today we are pleased to announce the release of the new Honeycomb Quick Start to help you in your quest to become an observability master. In case you’re unfamiliar, Honeycomb is a tool to…

By: Nathan LeClaire
Today we are pleased to announce the release of the new Honeycomb Quick
Start to help you in your quest to become an
observability
master.
In case you’re unfamiliar, Honeycomb is a tool to help you debug complex
systems such as databases, distributed infrastructure, containers,
microservices, and more. It improves upon existing tools such as static
dashboards and pre-aggregated metrics because it encourages an interactive
workflow where locating “needles in haystacks” is easier because critical
information is not being thrown away.
To start using Honeycomb, the steps are:
- Send “events” to Honeycomb in the form of JSON
- Visualize these sent events in the Honeycomb web UI to identify areas of
interest - Continue to iterate on initial queries to deduce the source of your issue(s)
Because we love you :), we’re working diligently to help you understand how you
can get value out of Honeycomb. The new Honeycomb Quick Start will get you from
zero knowledge to querying data as quickly as possible. Follow along at home
and start learning what this
observability thing is all about!
What’s observability all about?
In the quick start, we walk you through digging into a common problem: your
users have reported that the website is slow, and you are trying to figure out
what might be the source of the issue. Honeycomb is uniquely positioned as a
tool to help you pin-point the source of these kinds of maddeningly open-ended
questions.
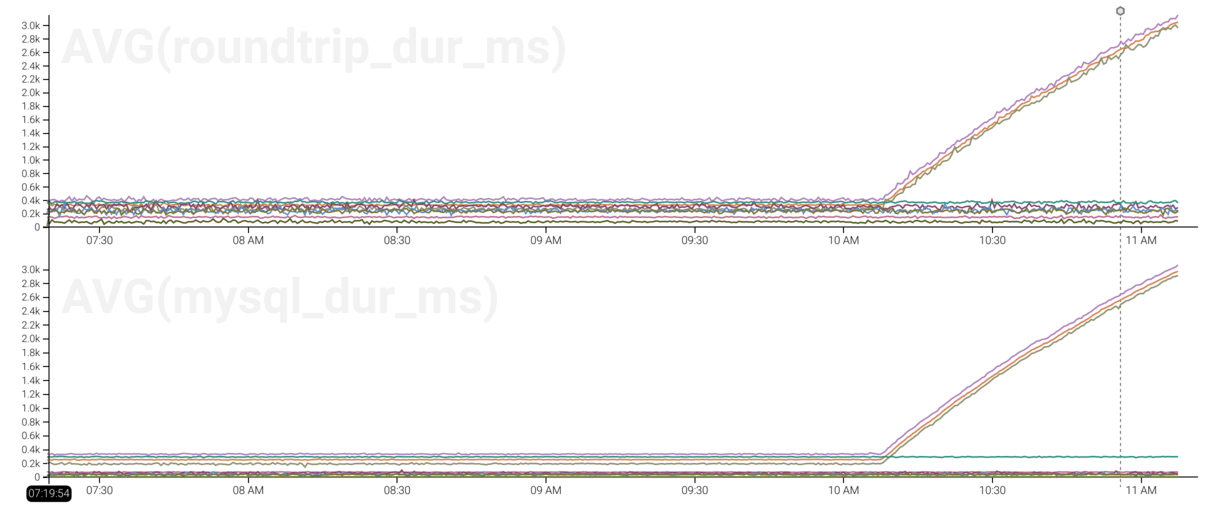
After going through the Quick Start, you’ll be able to make and interpret charts
like the following using the Honeycomb UI, and will have a much better feel for
what you are aiming for when instrumenting code, sending data, and making
queries in Honeycomb. The end result? You’ll have more reliable infrastructure,
more empowered engineers, and happier users.
Try Honeycomb today
Sign up for Honeycomb today or go directly to the Quick Start
tutorial (if you already have an account) to get started on
your journey to become an observability master. If you encounter any issues or
have questions, please feel free to reach out to us at
support@honeycomb.io
Want to know more?
Talk to our team to arrange a custom demo or for help finding the right plan.