Collecting Kubernetes Data Using OpenTelemetry
Running a Kubernetes cluster isn’t easy. With all the benefits come complexities and unknowns. In order to truly understand your Kubernetes cluster and all the resources running inside, you need access to the treasure trove of telemetry that Kubernetes provides. With the right tools, you can get access to all the events, logs, and metrics of all the nodes, pods, containers, etc. running in your cluster. So which tool should you choose? Since we are all in on OpenTelemetry, we think the best solution is the OpenTelemetry Collector.

By: Tyler Helmuth
Running a Kubernetes cluster isn’t easy. With all the benefits come complexities and unknowns. In order to truly understand your Kubernetes cluster and all the resources running inside, you need access to the treasure trove of telemetry that Kubernetes provides.
With the right tools, you can get access to all the events, logs, and metrics of all the nodes, pods, containers, etc. running in your cluster. So which tool should you choose? Since we are all in on OpenTelemetry, we think the best solution is the OpenTelemetry Collector.
OpenTelemetry Collector
The OpenTelemetry Collector is a vendor-agnostic solution to receiving, processing, and exporting traces, metrics, and logs. It is a modular solution, allowing you to configure the specific components that fit your needs. For Kubernetes, the OpenTelemetry community maintains and provides these components:
- filelogreceiver: Scrapes all the logs your cluster produces.
- hostmetricsreceiver: Scrapes the cpu, memory, process, etc. stats of your nodes.
- kubeletstatsreceiver: Scrapes metrics from kubelets, such as the pod memory or cpu usage.
- K8sobjectsreceiver: Collects objects, such as events, from the Kubernetes API server.
- K8sclusterreceiver: Collects cluster-level metrics, such as container restarts.
- K8sattributesprocessor: Enhances traces, metrics, and logs with Kubernetes metadata.
These components allow you to collect all the telemetry Kubernetes has to offer. However, configuring these components is not trivial. Some components should be deployed as a DaemonSet and others as a Deployment. Others require special permissions in order to function properly. While it is achievable, configuring these different components manually can be complex and time consuming. That’s where the Collector Helm chart comes in.
OpenTelemetry Collector Helm chart
The opentelemetry-collector Helm chart is a tool that simplifies and manages your Collector deployments in Kubernetes. The chart allows you to quickly and consistently configure a Kubernetes manifest that will deploy an OpenTelemetry Collector. If you’re unfamiliar with Helm, you can read more about it here.
With Helm installed, deploying a Collector to your Kubernetes cluster is as easy as a few lines on code:
helm repo add open-telemetry https://open-telemetry.github.io/opentelemetry-helm-charts
helm install my-opentelemetry-collector open-telemetry/opentelemetry-collector
Unfortunately, it won’t know how to collect K8s telemetry or export it to Honeycomb. You need to configure the Helm chart to make that happen. Luckily, configuring the chart to meet those needs is much easier than configuring the Collector yourself.
The Helm chart exposes all the components mentioned above via presets. When you enable a preset, the chart adds the components’ configuration to the Collector configuration and it takes care of setting any Kubernetes-specific requirements, like permissions, so that the component works. All it takes is a few lines of yaml:
mode: daemonset
config:
  exporters:
    otlp:
      endpoint: "api.honeycomb.io:443"
      headers:
        "X-Honeycomb-Team": "YOUR_API_KEY"
        "X-Honeycomb-Dataset": "METRIC_DATASET_NAME"
  service:
    pipelines:
      traces:
	  exporters: [ otlp ]
      metrics:
        exporters: [ otlp ]
      logs:
        exporters: [ otlp ]
presets:
  logsCollection:
    enabled: true
  hostMetrics:
    enabled: true
  kubeletMetrics:
    enabled: true
  kubernetesAttributes:
enabled: trueThe above values.yaml will tell the helm chart to install the Collector as a DaemonSet in the cluster with the capability to collect logs, host metrics, and kubelet metrics. Each Collector in the DaemonSet will gather the logs, host metrics, and kubelet metrics of the node on which it runs.
mode: deployment
config:
  exporters:
    otlp:
      endpoint: "api.honeycomb.io:443"
      headers:
        "X-Honeycomb-Team": "YOUR_API_KEY"
        "X-Honeycomb-Dataset": "METRIC_DATASET_NAME"
  service:
    pipelines:
      traces:
        exporters: [ otlp ]
      metrics:
        exporters: [ otlp ]
      logs:
        exporters: [ otlp ]
presets:
  kubernetesAttributes:
    enabled: true
  kubernetesEvents:
    enabled: true
  clusterMetrics:
enabled: trueThe above values.yaml will tell the Helm chart to install the Collector as a deployment in the cluster with the capability to collect cluster-level metrics and objects.
To avoid duplicate data, you should only use these presets in a single instance of the Collector, hence using a Deployment with one replica (the chart’s default number of replicas) instead of a DaemonSet. This single instance of the Collector will gather all the events across the cluster as well as the cluster-level metrics.
With those configurations saved in files like `daemonset-values.yaml` and `deployment-values.yaml`, all that’s left is to use them in some installs:
helm install daemonset open-telemetry/opentelemetry-collector --values daemonset.yaml
helm install deployment open-telemetry/opentelemetry-collector --values deployment.yaml
Conclusion
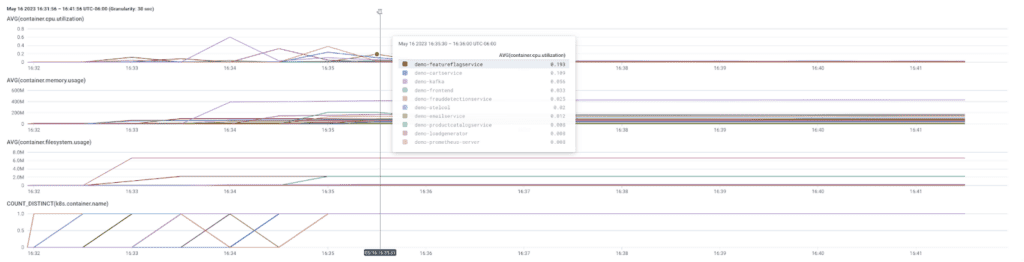
Collecting Kubernetes Data Using OpenTelemetry is that simple! When you install the Collector chart with these values.yaml files, you’ll start collecting all that precious telemetry and sending it over to Honeycomb—courtesy of the OTLP exporter.
Here are some next steps you can take in your observability journey:
Read more about the Collector chart.
Review its default values.
Read our new guide on Honeycomb & OpenTelemetry for in-depth observability.
Want to know more?
Talk to our team to arrange a custom demo or for help finding the right plan.