Meet Canvas, where humans and agents collaborate
AI agents can greatly accelerate your incident response, but complex investigations still require a team, and teamwork needs a space to happen. Canvas is where humans and agents can meet to share data, compare work, and build on each other’s conclusions.
An AI co-pilot for your human team
Faster debugging with guided investigations
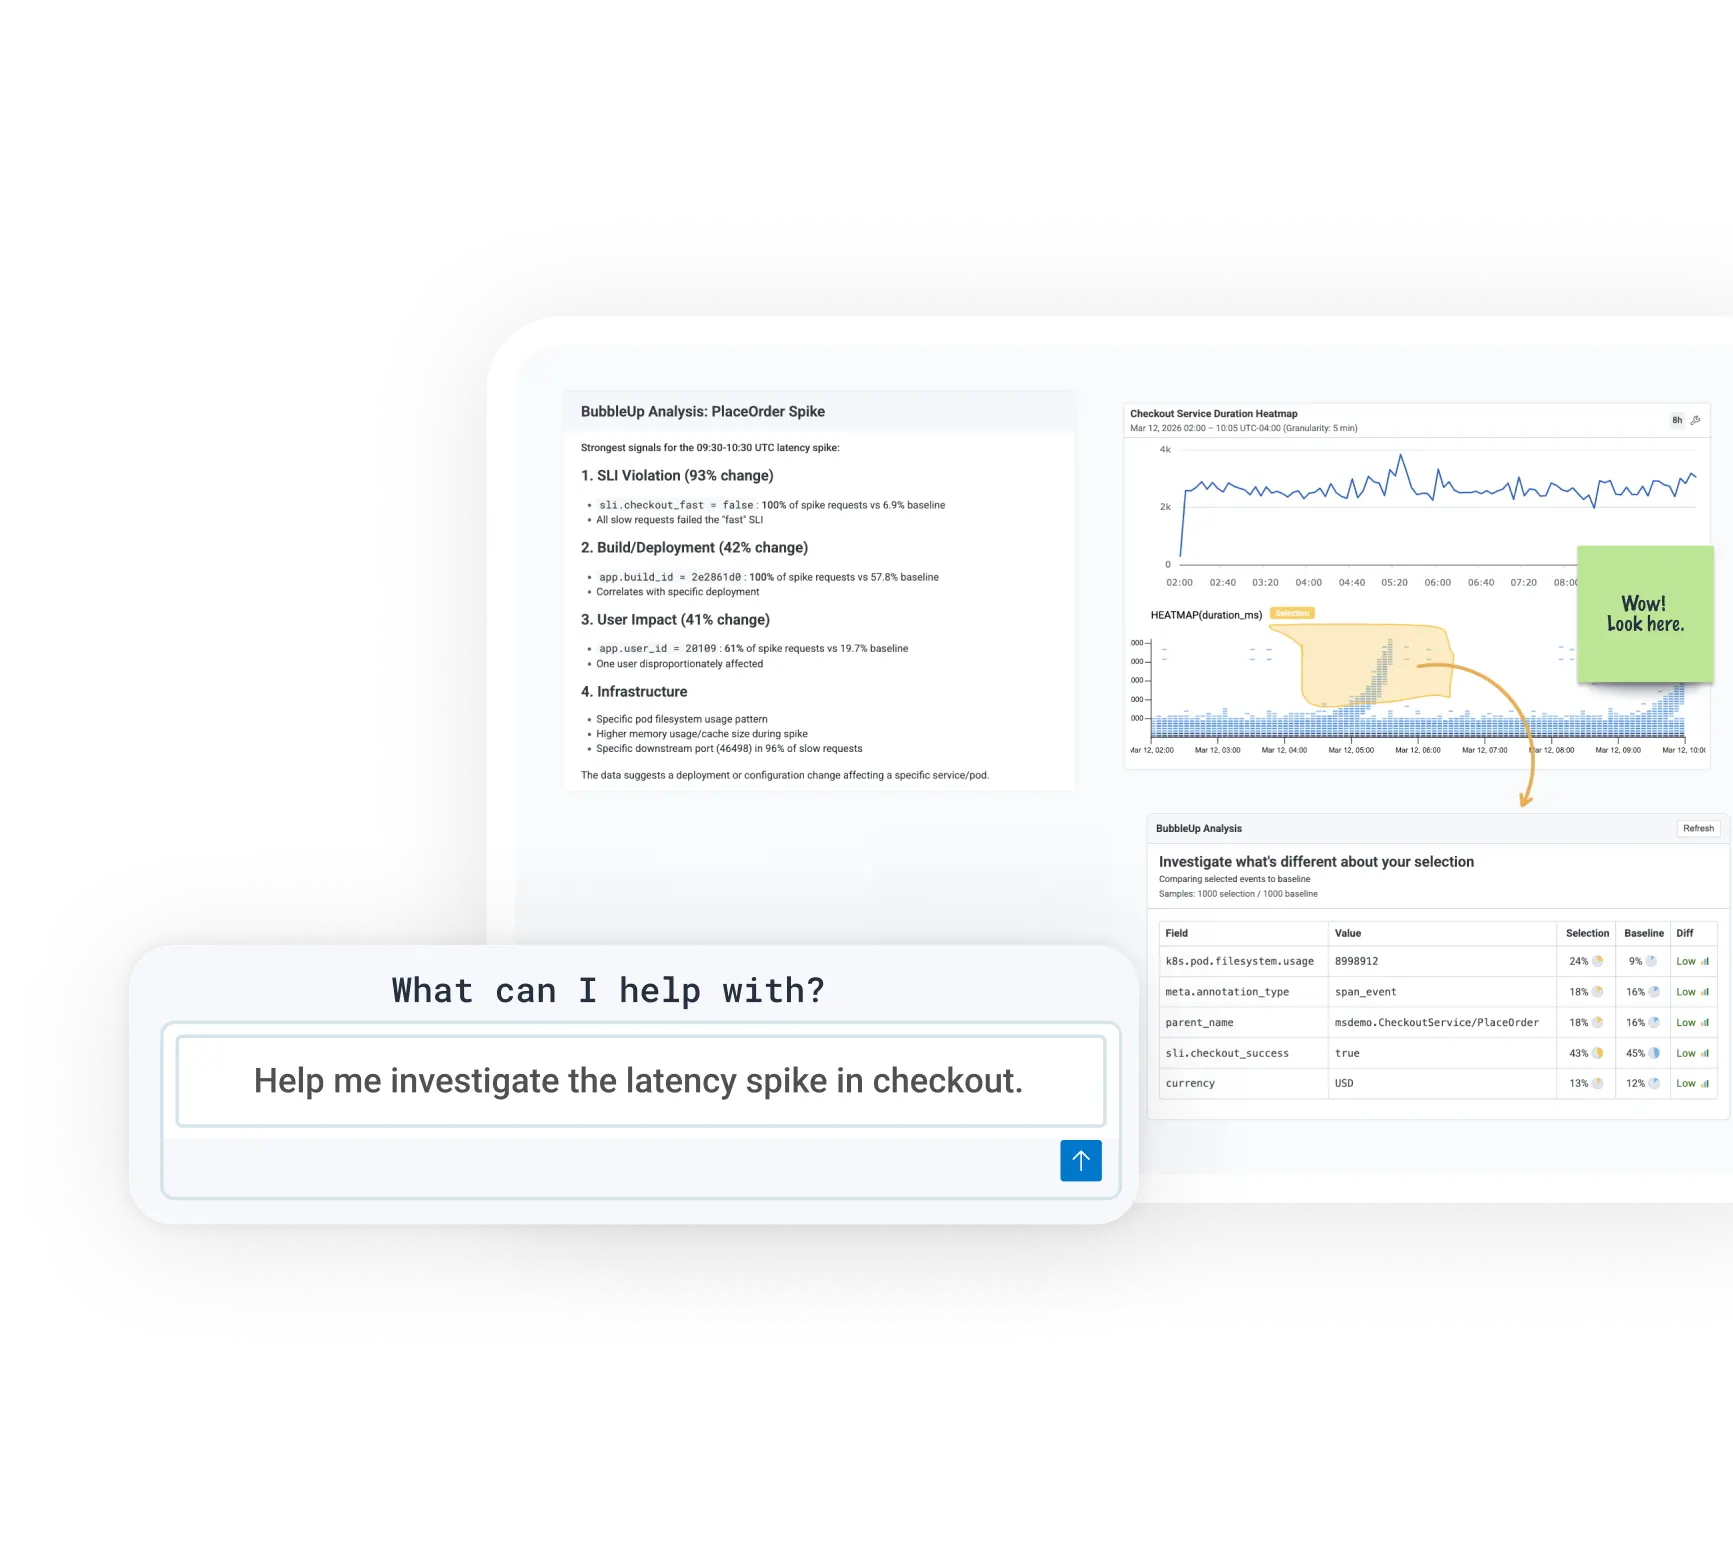
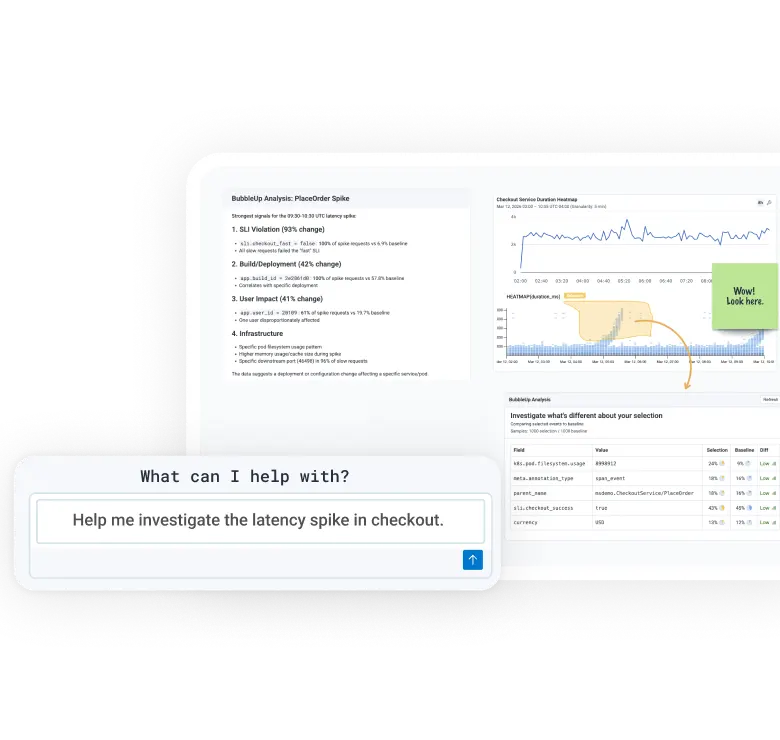
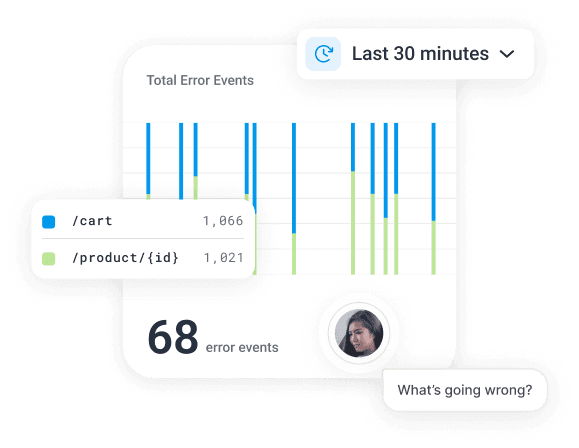
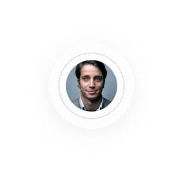
Canvas instantly shows why an SLO fired or performance degraded with AI-driven visualizations, suggested queries, and plain-language explanations.
Shared workspaces for team analysis
Investigations do not live in silos. Share a live Canvas to Slack, let teammates ask follow-up questions, and keep everyone aligned in one interactive workspace.
Automatic incident response with investigations
Any alert, SLO, or anomaly can trigger an automatic investigation so that you arrive to tested hypotheses and proposed solutions, not just an alarm.
Transform complexity into actionable insights
Help every engineer uncover patterns, identify performance bottlenecks, and share findings with the team instantly. Built on Honeycomb’s OpenTelemetry-native, event-based architecture, Canvas gives AI the speed and context it needs to make every investigation interactive, explainable, and actionable.
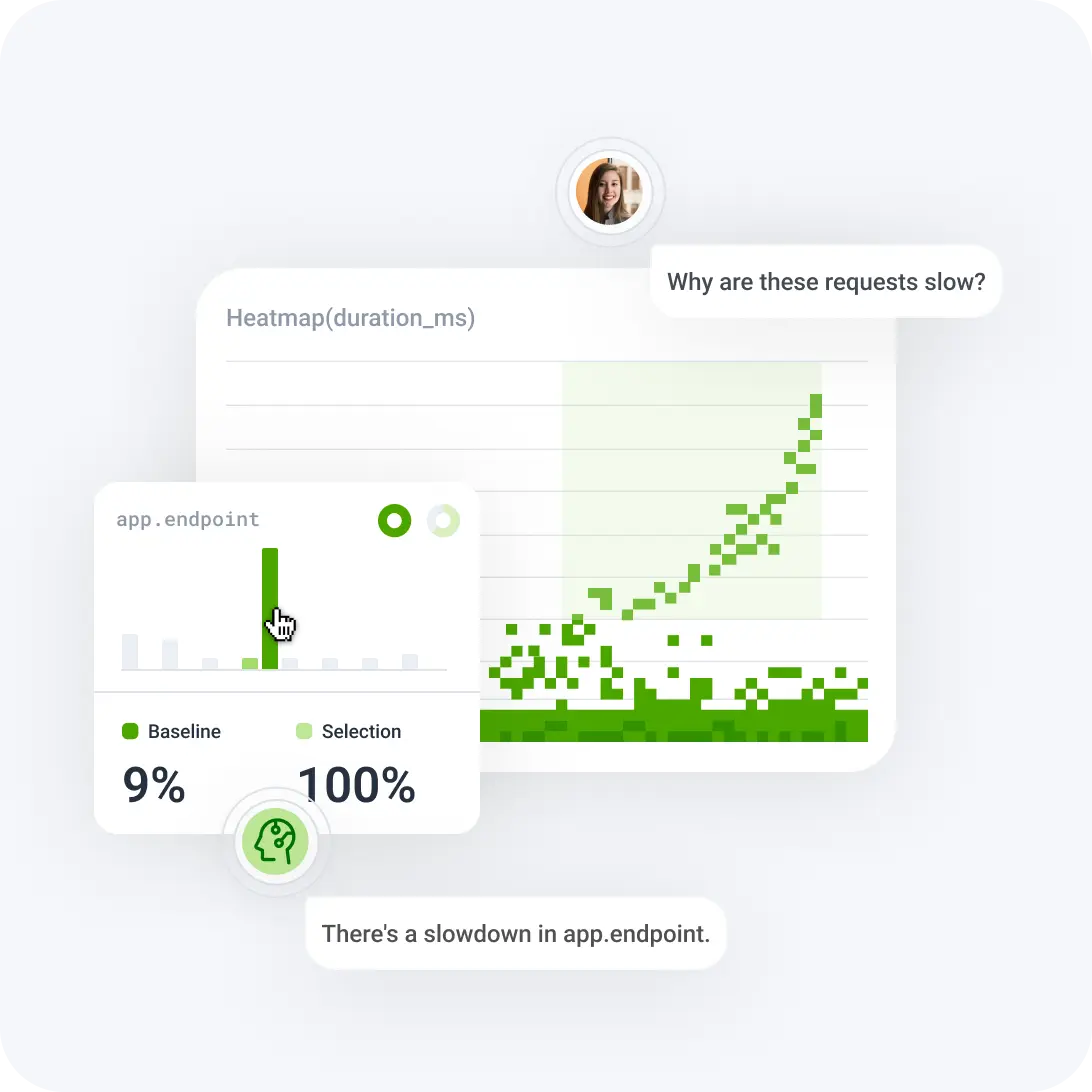
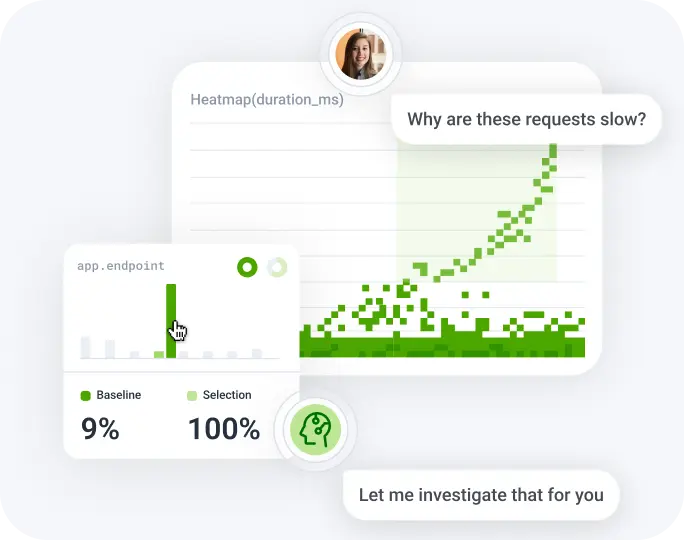
Ask questions in plain English
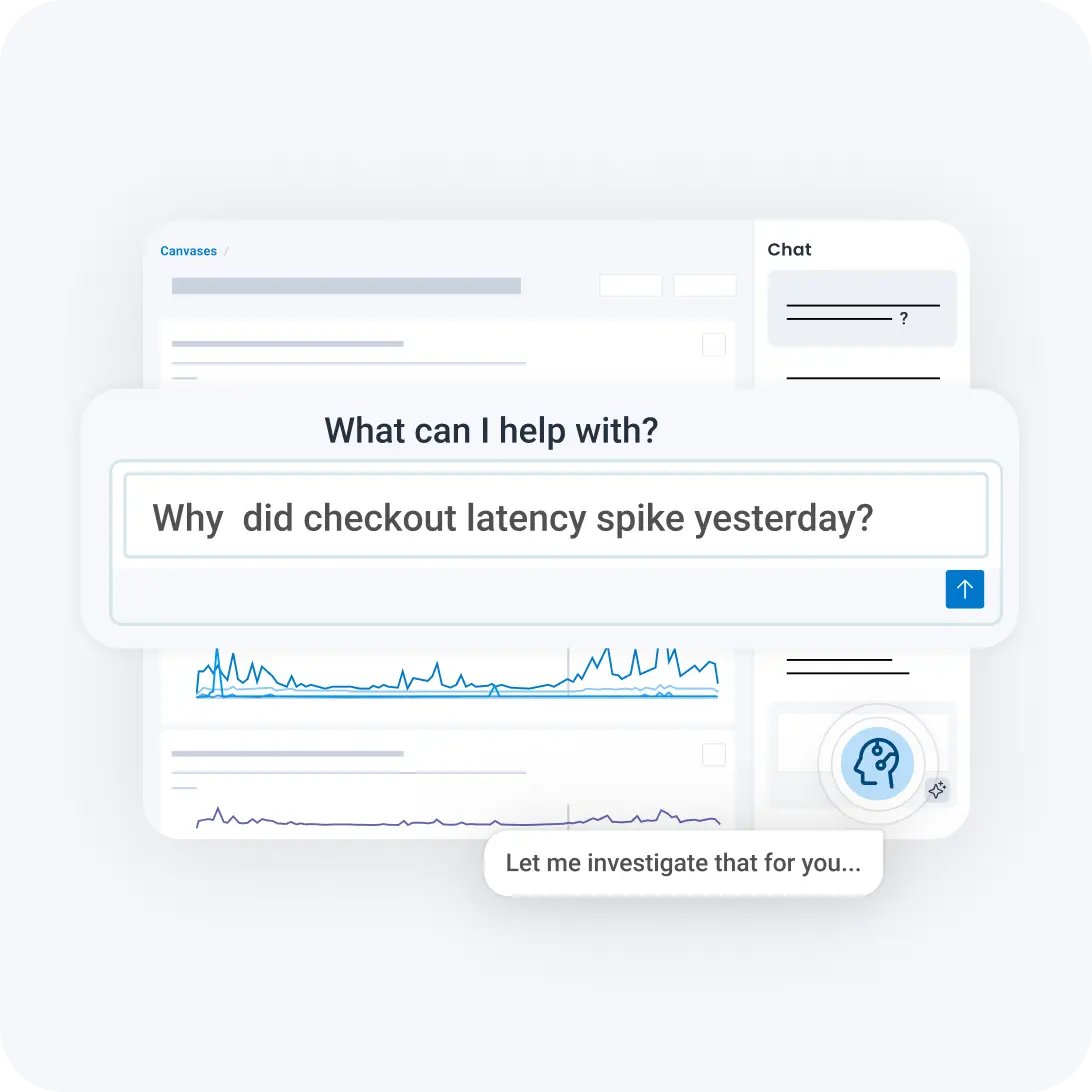
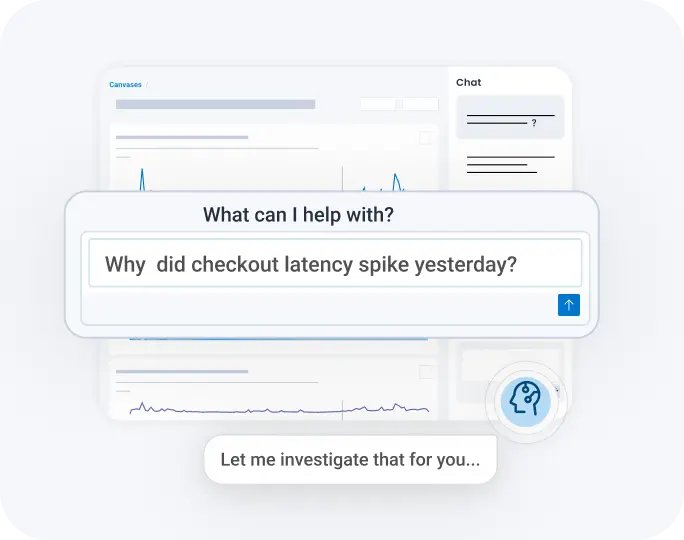
Users can ask natural language questions (e.g., "Why did checkout latency spike yesterday?") and the AI assistant will automatically run queries, analyze traces, and propose visualizations to find answers.
AI that shows its work
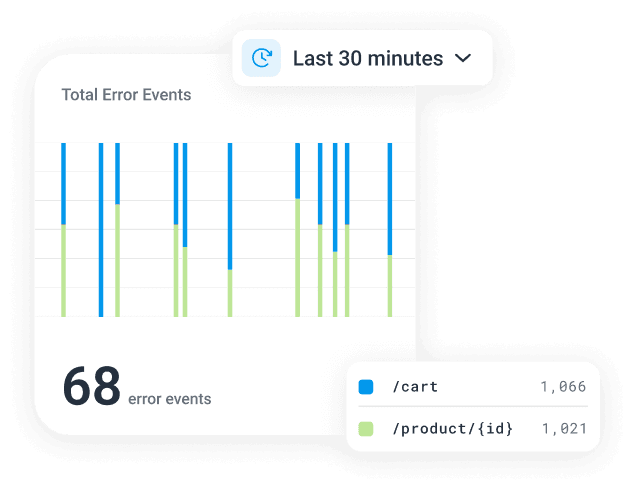
The AI's investigation steps and query results are presented in an interactive notebook, allowing users to follow the logic, verify conclusions, and guide the investigation with follow-up questions.
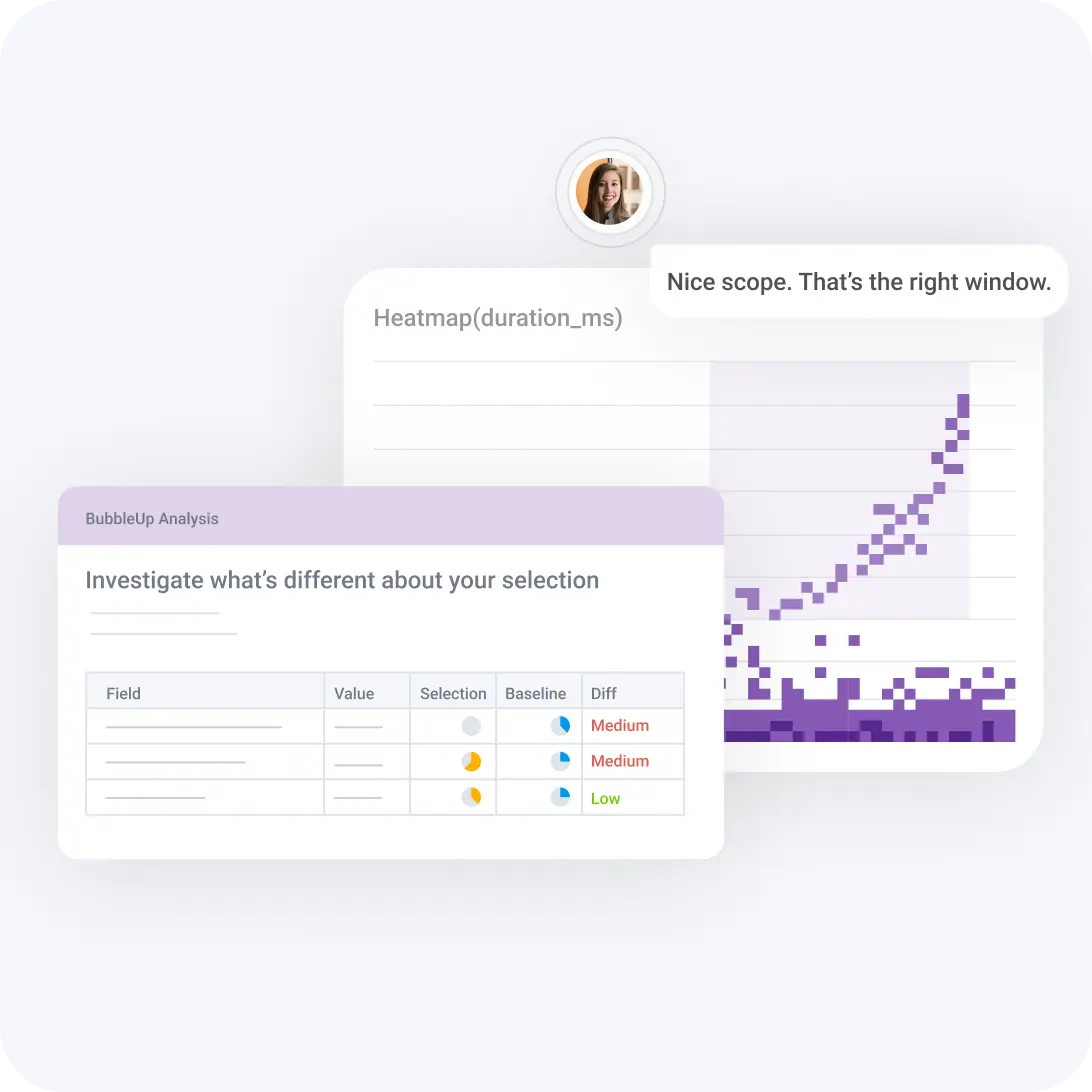
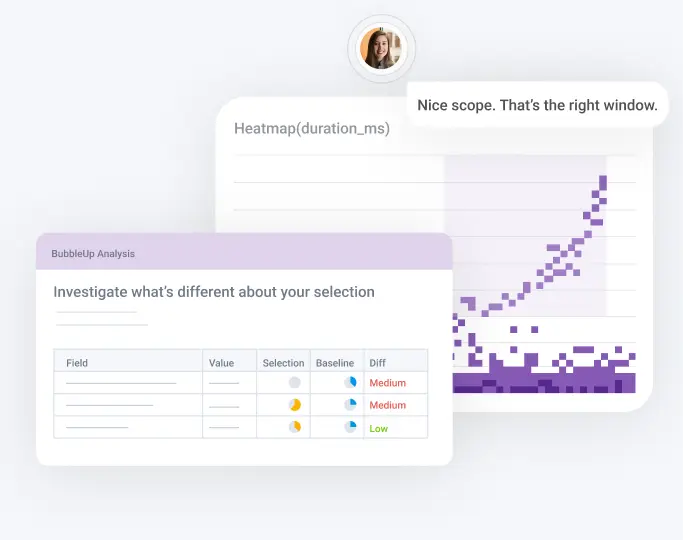
Surface relevant evidence
Features you trust, like BubbleUp, are enhanced with AI insights to pull relevant correlations out of hundreds of dimensions.
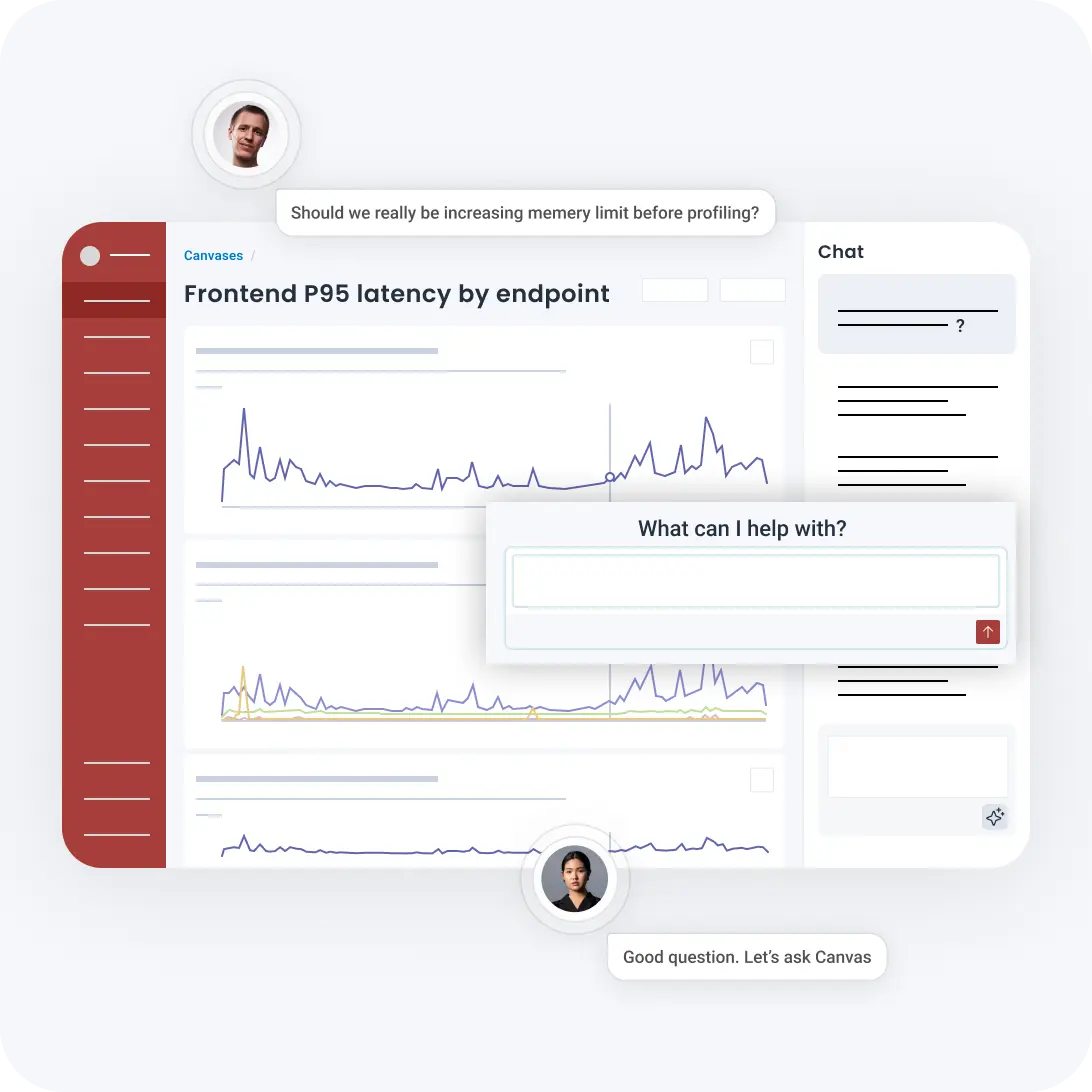
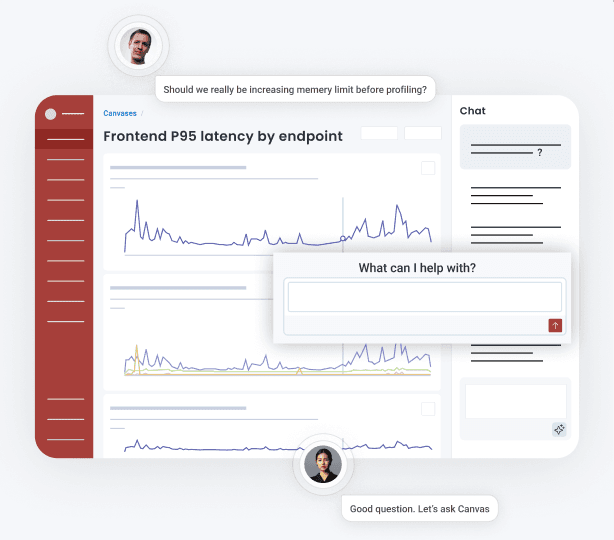
Bring your team up to speed
Multiple team members can work on each Canvas, in collaboration with their own AI agent. Your agent can catch you up on what’s happening, read your teammates’ queries, and even their notes, so your team always knows what you’ve done.
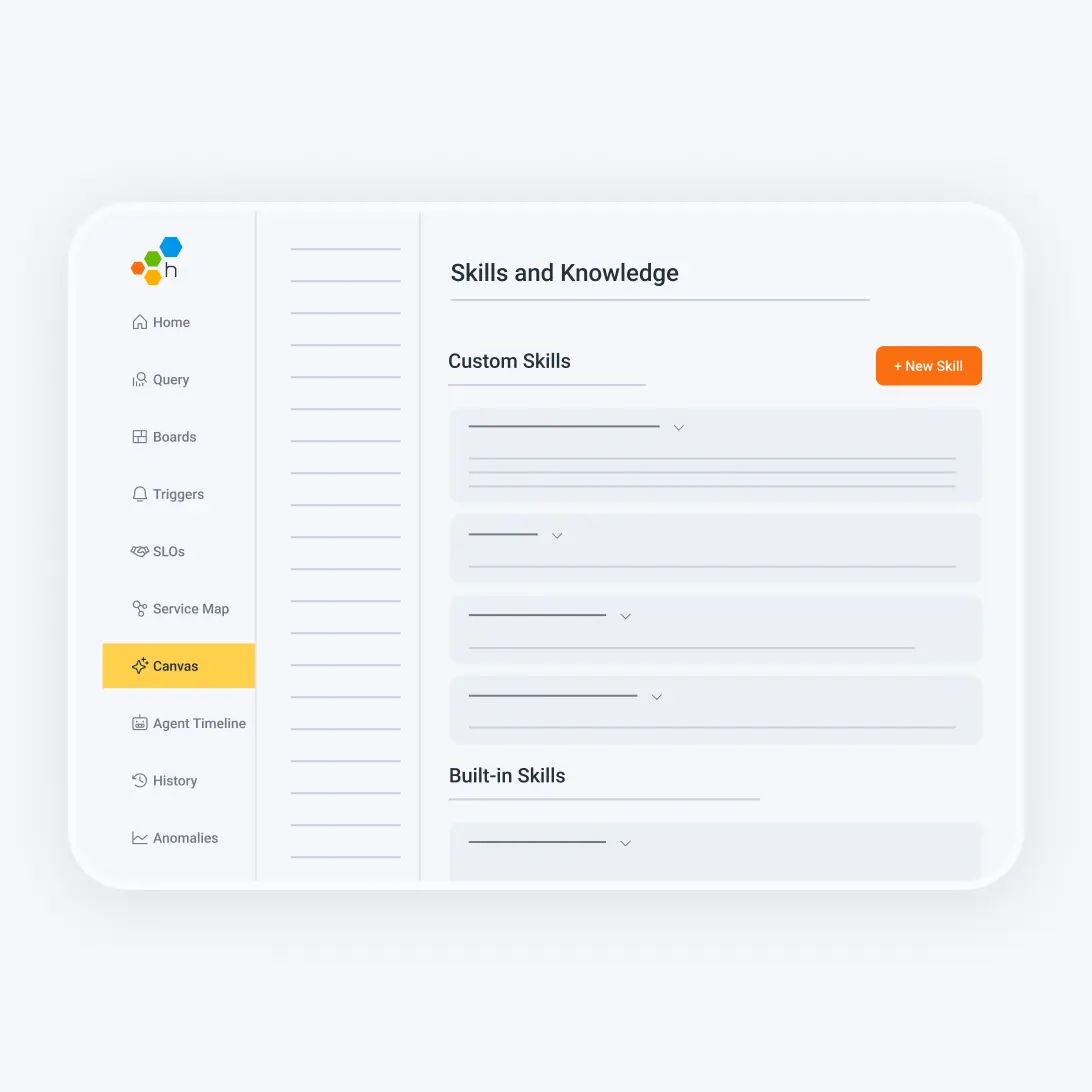
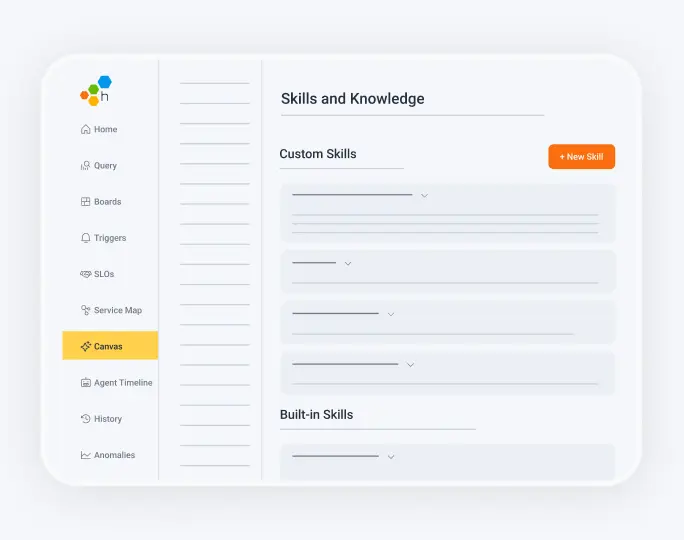
Make your agents experts
Built-in skills give your agents an in-depth understanding of observability fundamentals and Honeycomb queries. By creating custom skills you can teach your agents to work from the same runbooks as your top SREs.
See it in action
Canvas is how teamwork happens in the agentic era. Agents and humans need to communicate, collaborate, and share evidence to reach a trusted conclusion. See how it works.
Engineers are drowning in uncertainty as most observability tools weren’t built for this sort of “unknown-unknown.” Honeycomb was built for the hardest parts of building software—and autonomous agents have taken those hardest parts mainstream.

Christine Yen
Cofounder & CEO, Honeycomb
Experience the power of Honeycomb
See Canvas in action in our interactive product tour–no sign up required.


Related features
Want to know more?
Talk to our team to arrange a custom demo or for help finding the right plan.