Getting Started With the Honeycomb OpenTelemetry Tutorial
Honeycomb allows you to send in data from a variety of sources. The steps to get there are a choose-your-own-adventure path and the choices to make may not always be clear to folks new…

By: Liz Fong-Jones
Honeycomb allows you to send in data from a variety of sources. The steps to get there are a choose-your-own-adventure path and the choices to make may not always be clear to folks new to Honeycomb. This guide is aimed at developers that own Go applications in production and would like to send instrumentation data to Honeycomb using OpenTelemetry.
This step-by-step guide will help you add OpenTelemetry to your web service, leverage automatic instrumentation, show you how to add additional custom context to that instrumentation, and ensure that instrumentation data is being sent to Honeycomb. This is a zero-to-insight follow-along OpenTelemetry tutorial to get started quickly.
Create a free Honeycomb account
There are several ways to get started with Honeycomb. For simplicity, we’ll start this OpenTelemetry tutorial by signing up for an account in Honeycomb’s free tier. Go to ui.honeycomb.io/signup to create a free Honeycomb account. We support SSO with Google and if you choose that, there are no new passwords to create or remember!
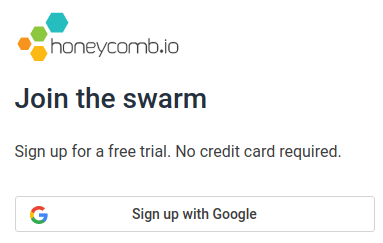
The handy setup wizard will walk you through the steps you’ll need:
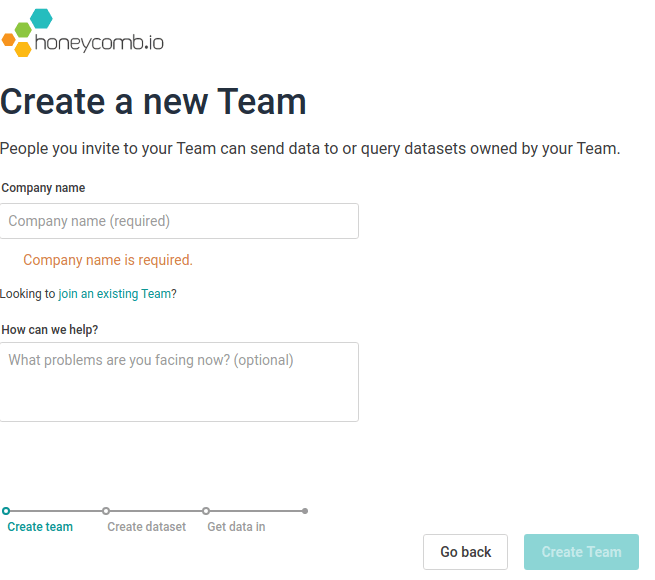
You’ll get prompted for a team name. This slug will appear in your team’s Honeycomb URL, so choose carefully. If different teams in your org use different tools, or you see the possibility of expanding usage to other teams, we find that using a team name in the format of {company name}-{team name} works well, where {team name} is the name of your team, service, business unit, etc.
Provide your organization’s name:
And now, you’ll be prompted to choose how you want to send data to Honeycomb.
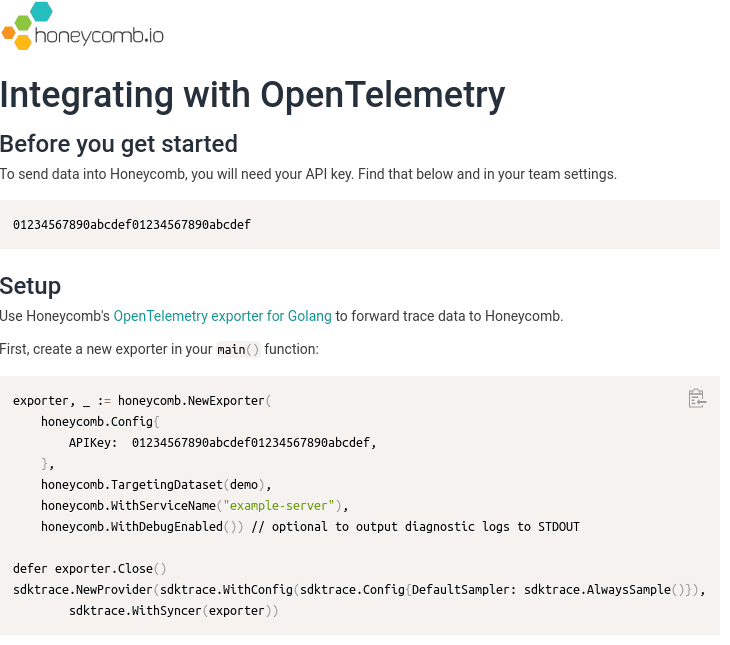
Click “Show All Integrations”, then “OpenTelemetry”. Now you’ll see a prompt with your API key and some sample code.
But instead of using the sample code shown to you in the app, instead let’s follow along here with the rest of this post, as these instructions here are more comprehensive and detailed.
Automatically create traces/spans on HTTP requests
OpenTelemetry can help you jumpstart your way to observability by providing automatic instrumentation for HTTP requests. You have your choice of request routers in OpenTelemetry or you can use the standard HTTP handler. You should pick the mux that’s right for your framework.
Automatic instrumentation with request routers
Add one line to your import() stanza depending upon your request router:
- If you are using gin/gonic:
middleware "go.opentelemetry.io/contrib/instrumentation/github.com/gin-gonic/gin" - If you are using gorillamux:
middleware "go.opentelemetry.io/contrib/instrumentation/github.com/gorilla/mux" - If you are using echo:
middleware "go.opentelemetry.io/contrib/instrumentation/github.com/labstack/echo"
Then, in your main() function, right after you create your primary router, inject the OpenTelemetry middleware:
router.Use(middleware.Middleware("service-name"))Yes, it was that simple with request routers. Two lines of code!
If you don’t use a request router
import (
  otelhttp "go.opentelemetry.io/contrib/instrumentation/net/http"
)In each place where you pass an http.Handler to a ServeMux, you’ll wrap the handler function. For instance, replace:
- mux.Handle("/path", h)
with
mux.Handle("/path", <b>otelhttp.</b>NewHandler(h, "description of path")) - mux.Handle("/path", http.HandlerFunc(f))
with
mux.Handle("/path", <b>otelhttp.NewHandler</b>(http.HandlerFunc(f), "description of path"))
In this fashion, you can ensure that every function you wrap with othttp will automatically have its metadata collected and a corresponding trace started.
Automatically create traces/spans on gRPC server requests
Similarly, OpenTelemetry can also help you automatically instrument gRPC requests. To instrument any gRPC servers you have, add an Interceptor to the instantiation of the server.
import (
  grpcotel "go.opentelemetry.io/contrib/instrumentation/google.golang.org/grpc"
)

func main() {
  [...]

  s := grpc.NewServer(
    grpc.UnaryInterceptor(grpcotel.UnaryServerInterceptor(global.Tracer(""))),
    grpc.StreamInterceptor(grpcotel.StreamServerInterceptor(global.Tracer(""))),
  )
}Configure export to Honeycomb
Now that your code is set up to emit instrumentation, you’ll need to send it to Honeycomb in order for it to be useful. We’ve written a Honeycomb exporter for OpenTelemetry to help make that easier. You’ll need to import the Honeycomb exporter in your main module, and place the initialization code first in your main() function. Use the API key you found in the getting started screen from the Honeycomb website…
import "github.com/honeycombio/opentelemetry-exporter-go/honeycomb"
import "go.opentelemetry.io/otel/api/global"

func initTracer() func() {
  apikey, _ := os.LookupEnv("HNY_KEY")
  dataset, _ := os.LookupEnv("HNY_DATASET")
  hny, err := honeycomb.NewExporter(
    honeycomb.Config{
      APIKey: "*0123456789abcdef0123456789abcdef*",
    },
    honeycomb.TargetingDataset(dataset),
    honeycomb.WithServiceName(serviceName),
  )
  if err != nil {
    log.Fatal(err)
  }
  tp, err := sdktrace.NewProvider(
    sdktrace.WithConfig(sdktrace.Config{DefaultSampler: sdktrace.AlwaysSample()}),
    sdktrace.WithSyncer(hny),
  )
  if err != nil {
    log.Fatal(err)
  }
  global.SetTraceProvider(tp)
  return hny.Close
}

func main() {
  cleanup := initTracer()
  defer cleanup()
  // rest of initialization, including creating HTTP and gRPC servers/handlers...
}Add custom instrumentation
OpenTelemetry includes a fair amount of automatic instrumentation that can help you get started quickly. However, you’ll likely soon discover that it would be helpful to understand additional bits of context for each event that is now emitting automatic instrumentation data. This is where the power of observability particularly shines. Honeycomb encourages you to send in as much context as you need for these events. You can make your events incredibly wide with no penalties for doing so. I know we’re using the Free tier for this tutorial, but even in that tier the only limitation is 20M events per month. Each of those events can include as much additional context as you want to add in: it still only counts as one event to Honeycomb.
(Yes, there’s actually a cap on max event size, but for most folks this is essentially unlimited).
OpenTelemetry Span Attributes
Attributes in OpenTelemetry are any arbitrary key value pairs you can add to any event. Anything at all! If there’s a property you want to see that isn’t captured by the HTTP instrumentation, that’s not a problem! Inside of any HTTP handler, you can access the current span from the request’s Context() and add any number of key-value pairs using SetAttributes().
import "go.opentelemetry.io/otel/api/kv"
import "go.opentelemetry.io/otel/api/trace"

func h(w http.ResponseWriter, req *http.Request) {
  ctx := req.Context()
  span := trace.SpanFromContext(ctx)
  span.SetAttributes(kv.Any("id", id), kv.Any("price", price))
  // [...]
}Child spans
Sometimes you want to track units of work performed within a single HTTP request. For instance, suppose you needed to look up 50 different items inside a function or goroutine before returning the results to the user. OpenTelemetry allows you to easily create a new span with tracer.Start().
For instance, in your cart/item_lookup.go file for a hypothetical shopping service:
import "go.opentelemetry.io/otel/api/global"
var tracer = global.Tracer("cart")

func getItem(ctx context.Context) {
  _, span := tracer.Start(ctx, "item")
  defer span.End()
  // [...]
}This creates a child span for each item that is retrieved, allowing you to understand whether the items are being fetched in serial or parallel, and how long each item is taking to retrieve.
Context propagation
Part of why tracing is so useful is because it can be distributed across multiple services. In order to get the most benefit out of distributed tracing, you’ll need to make sure that any downstream services that are issued HTTP client calls, or gRPC client calls, are aware of your traces so that you can build upon them. You’ll need to add OpenTelemetry to those services to see their spans once you’ve added context propagation between services.
For HTTP calls, you’ll need to specify a custom http.Client instrumented with OpenTelemetry hooks. Instead of:
func remoteCall(...) ... {
  http.Get(url)
}You’ll write:
import (
  otelhttp "go.opentelemetry.io/contrib/instrumentation/net/http"
)

var httpClient = http.Client{Transport: otelhttp.NewTransport(http.DefaultTransport)}

func remoteCall(...) ... {
  req, _ := http.NewRequestWithContext(ctx, "GET", url, nil)
  resp, err := httpClient.Do(req)
}For gRPC, you’ll just add an Interceptor to your outgoing connections, without needing to modify your gRPC calls:
import (
  grpcotel "go.opentelemetry.io/contrib/instrumentation/google.golang.org/grpc"
)

func main() {
  var conn *grpc.ClientConn
  conn, err := grpc.Dial("remotehost:1234",
    grpc.WithUnaryInterceptor(grpcotel.UnaryClientInterceptor(global.Tracer(""))),
    grpc.WithStreamInterceptor(grpcotel.StreamClientInterceptor(global.Tracer(""))),
  )
}Start observing your application!
Now that you’ve added OpenTelemetry and custom instrumentation to your code, you’ll need to deploy and run it in order for any data emitted to the Honeycomb exporter to send it to Honeycomb. Once you deploy your binary (or multiple binaries) with the changes you just made above, the “waiting for data…” screen in the Honeycomb UI will let you proceed into the analysis homepage, where you can see a summary of your data.
You can see the list of recent traces at the bottom of the home view, and can inspect a trace to verify it shows the spans and fields you instrumented. You can start digging around for more sophisticated insights using the ‘New Query’ button to create and issue custom queries against that data.
Congratulations! You’ve just added your Go application to Honeycomb using OpenTelemetry. Have questions or comments? Go to your inbox and accept that invite to join the Honeycomb Pollinators Slack group. We look forward to seeing you there!
Want to know more?
Talk to our team to arrange a custom demo or for help finding the right plan.