How We Saved 70% of CPU and 60% of Memory in Refinery’s Go Code, No Rust Required
We've just released Refinery 3.0, a performance-focused update which significantly improves Refinery's CPU and memory efficiency.

By: Ian Wilkes

The Engineer’s Guide to Sampling
Download
We've just released Refinery 3.0, a performance-focused update which significantly improves Refinery's CPU and memory efficiency.
Refinery has a big job: it performs dynamic, consistent tail-based sampling that maintains proportions across key fields, adjusts to changes in throughput, and reports accurate sampling rates.
The traffic patterns it handles are challenging, with long or large traces requiring it to hold lots of information in memory, while sudden volume spikes leave little time for infrastructure to scale up—all in a package that people want to run as cheaply as possible, since one of the primary use cases for sampling is cost control. When you're spending money to save money, you always want to spend less. Version 3.0 is a big advance in that direction.
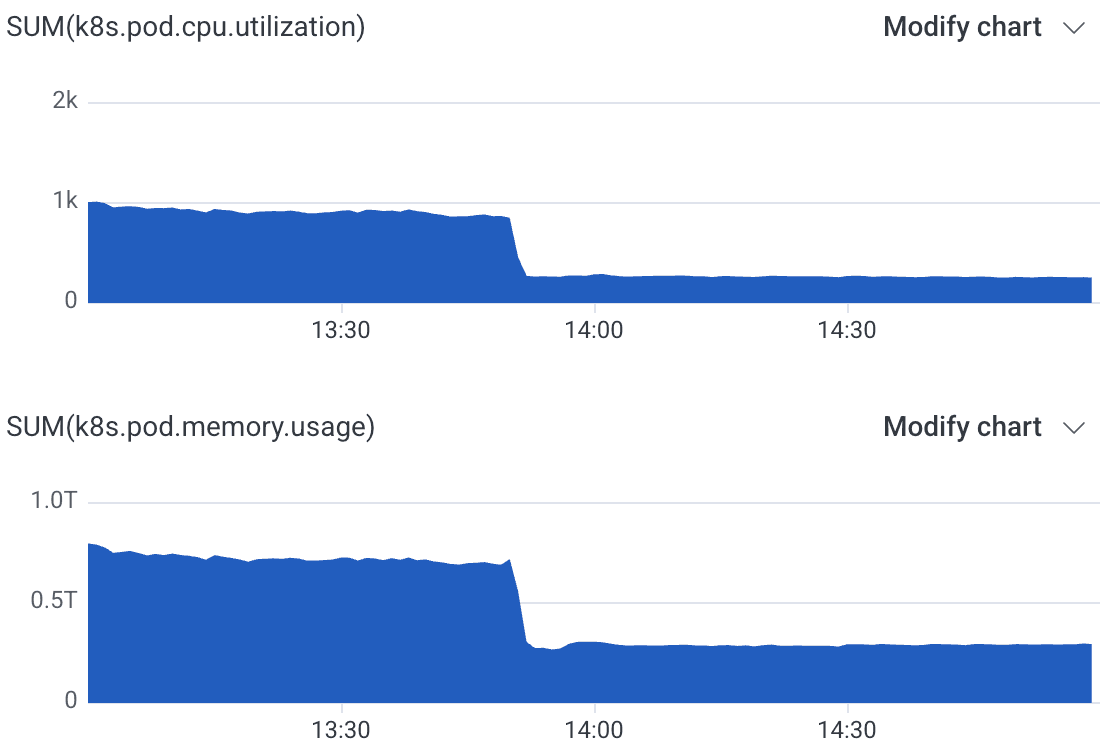
When we upgraded our internal Refinery cluster, total CPU usage dropped by 70%, while RAM use dropped by 60%:

With an improvement like this, we can downsize this 72-node cluster by half—a meaningful savings—while still keeping more headroom than before. If you’re a Refinery user, hopefully so can you.
How did we pull off such a big change?
The code’s all in this merge, but I’ll cover the basics here.
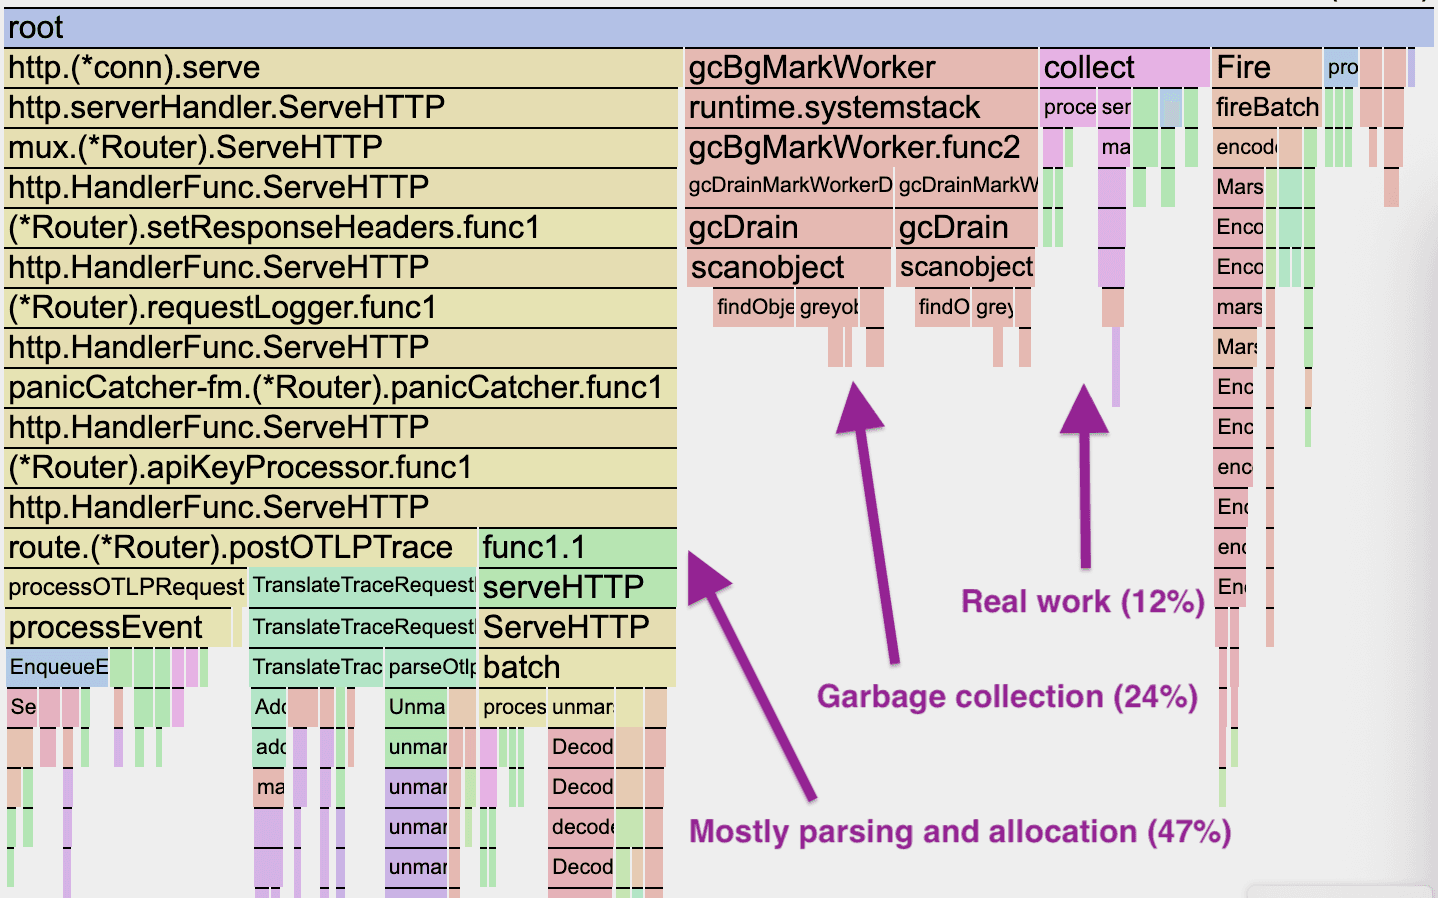
Like many programming languages, Go is capable of being very fast under the right circumstances (working with bounded quantities of strongly typed data), and very slow under the wrong ones. Unfortunately, Refinery’s job of handling customer-defined trace spans is very close to the wrong one. Historically, we followed the standard approach and fully de-serialized every span that came in through the API. Since there’s no fixed schema, the fields went into a big map[string]any — hundreds of heap allocations, pointers everywhere. It was simple and effective, but it was also expensive. Compounding this cost, in a cluster configuration, the majority of spans are handled twice since they’re redirected from the receiving node to the node which “owns” the relevant trace. Here’s what a profile of a typical clustered Refinery looked like:
There’s a lot going on here, but you can see almost a quarter of CPU time going to garbage collection. Digging further reveals that a lot of the leaf nodes are ultimately some form of malloc. In total, 50% of all CPU time in this process is allocation-related, all in order to hold onto span data as it waits for a sampling decision—after which, in most cases, it’s simply thrown away without being sent to Honeycomb!

There’s also a lot of overhead just for setting up data structures which we’re hardly going to use. The actual refining, which is the reason we’re doing all of this, all happens in the collect loop, a mere 12% of time in this profile. Even that is mostly internal metrics instrumentation rather than the core decision-making algorithms.
The best way to make all this de-serialization (and, eventually, re-serialization) fast is to not to do it at all. Refinery only ever looks at a handful of fields in any given span, the rest is just cargo. And it’s very possible to extract only the fields you need from a serialized blob, as in the simplified example below. These two benchmarks demonstrate de-serializing into a map, and our new selective approach, where we pull out any fields Refinery needs, then hang onto the serialized data for re-transmission. I’m using MessagePack here because that’s Refinery’s native format, with a low-level serialization API provided by the tinylib/msgp library.
func BenchmarkDecodeStrats(b *testing.B) {
    msgpData, _ := msgpack.Marshal(struct {
        TraceID    string
        DurationMs float64
    }{
        TraceID:    "1234567890",
        DurationMs: 123.4,
    })

    // Unmarshal to a schemaless map[string]any, the old way.
    b.Run("to_map", func(b *testing.B) {
        for b.Loop() {
            var m map[string]any
            _ = msgpack.Unmarshal(msgpData, &m)
        }
    })

    // Unmarshal a subset of fields using custom deserialization;
    // this is the new way.
    b.Run("selective", func(b *testing.B) {
        for b.Loop() {
            var durationMs float64
            mapSize, remaining, _ := msgp.ReadMapHeaderBytes(msgpData)

            for range mapSize {
                var key []byte
                key, remaining, _ = msgp.ReadMapKeyZC(remaining)
                if bytes.Equal(key, []byte("DurationMs")) {
                    durationMs, remaining, _ = msgp.ReadFloat64Bytes(remaining)
                } else {
                    remaining, _ = msgp.Skip(remaining)
                }
            }
            _ = durationMs // Pretend we did something with the duration
        }
    })
}You can see that selective involves much more code, but it’s hard to argue with the results:
BenchmarkDecodeStrats/to_map-12     296.1  ns/op   9 allocs/op
BenchmarkDecodeStrats/selective-12 16.98 ns/op 0 allocs/opThis is a very simple scenario, and it’s common for real spans to have hundreds or even thousands of fields, which in the old version meant much longer parsing times and thousands of distinct allocations per span. Instead, Refinery 3.0 keeps the serialized data, retaining it in a format which is much more compact than the web of headers and pointers created for a fully realized map. This more compact data is the main reason for Refinery’s improved memory footprint.
Of course, Refinery supports three other types of input data besides our native MessagePack (libhoney/json, otlp/proto, otlp/json). To handle the others, Refinery now transcodes those formats directly to serial MessagePack, binary-to-binary, again extracting any useful fields along the way. This code is even more voluminous than the selective extraction from MessagePack illustrated above, but it avoids an expensive additional step of translation from generated protobuf data structures into our own.
To add icing to this cake, we also optimized our metrics instrumentation, implemented pools to re-use large buffers, and (coming soon as a minor version update) parallelized the core decision loop to scale across many CPUs. Notably, there are no clever algorithms or language tricks at play here. We didn’t have to rewrite it in Rust. All we've done is reimagine which work this process really needs to do, and focus on only doing that.
New to Honeycomb? Get your free account today.
Get access to distributed tracing, BubbleUp, triggers, and more.
Up to 20 million events per month included.